Proceeding Paper

Blockage Correction and Reynolds Number Dependency of an Alpine Skier: A Comparison Between Two Closed-Section Wind Tunnels †

1
Department of Civil and Environmental Engineering, Norwegian University of Science and Technology, Centre for Sport Facilities and Technology, 7491 Trondheim, Norway
2
Norwegian Ski Federation, 0840 Oslo, Norway
*
Authors to whom correspondence should be addressed.
Presented at the 13th Conference of the International Sports Engineering Association, Online, 22–26 June 2020.
Proceedings 2020, 49(1), 19; https://doi.org/10.3390/proceedings2020049019
Published: 15 June 2020

Abstract

:
The purpose of this study was to investigate the impact of blockage effect and Reynolds Number dependency by comparing measurements of an alpine skier in standardized positions between two wind tunnels with varying blockage ratios and speed ranges. The results indicated significant blockage effects which need to be corrected for accurate comparison between tunnels, or for generalization to performance in the field. Using an optimized blockage constant, Maskell’s blockage correction method improved the mean absolute error between the two wind tunnels from 7.7% to 2.2%. At lower Reynolds Numbers (<8 × 10⁵, or approximately 25 m/s in this case), skier drag changed significantly with Reynolds Number, indicating the importance of testing at competition specific wind speeds. However, at Reynolds Numbers above 8 × 10⁵, skier drag remained relatively constant for the tested positions. This may be advantageous when testing athletes from high speed sports since testing at slightly lower speeds may not only be safer, but may also allow the athlete to reliably maintain difficult positions during measurements.

1. Introduction

Three external forces determine the alpine skier’s trajectory and speed: Gravity, the reaction force arising from the skier’s interaction with the snow surface, and aerodynamic drag. A substantial component of the total braking effect on a skier is caused by aerodynamic drag, particularly in the high speed disciplines of Super-G and Downhill [1]. A better understanding of how skier positioning influences aerodynamic drag has the potential to improve performance and, as a result, has been of interest to both researchers and practitioners for several years [2,3,4,5].
Wind tunnel testing is a commonly used tool for studying aerodynamic forces in high-speed sports, such as alpine skiing. One benefit of wind tunnel testing is the possibility to replicate the flow field around an athlete in a controlled environment, allowing accurate force- and flow measurement techniques to be used. However, two important limitations to be considered when using wind tunnel testing are blockage effect and Reynolds Number dependency.

1.1. Blockage Effect

When a bluff body such as an athlete or mannequin is placed in the test section of a closed wind tunnel, the air flow is forced through the open space around the body and may be accelerated due to continuum mechanics, a phenomenon known as blockage. The effects of this flow acceleration on drag measurements needs to be corrected for if one wants to compare positions with different frontal areas, or to generalize findings to field conditions. The magnitude of the blockage effect depends upon the degree to which the body blocks the wind tunnel test section. This is normally quantified as the ratio between the body’s projected frontal area and the test section cross-sectional area, known as the blockage ratio (B). There is no precise agreement in the literature as to what the minimum B should be, above which blockage correction is necessary. Battisti et al. considered a B of 5–10% a high degree of blockage [6] while Molina et al. recommended blockage correction when B exceeds 10% [7]. According to Anthoine et al. [8], one can neglect blockage effects when B is less than 3%. Regardless of what the minimum limit is, blockage correction is likely of importance in many closed test-section wind tunnels when testing alpine skiers, with the need to correct for blockage when B is in the range of 3–10% and larger.
Blockage correction has been extensively studied and different recommendations and approaches are available. Maskell proposed the following equation to estimate blockage in a closed test-section wind tunnel:
C D u C D c = 1 + θ C D u B ,
where B is the blockage ratio as previously defined, CDu is the uncorrected drag coefficient, CDc is the corrected drag coefficient and θ is the blockage constant [9]. θ is an empirical constant, determined by the base pressure coefficient and the aspect ratio of the bluff body. Based on data from normal flat plates, θ has been estimated to be 2.58 with an aspect ratio of 3, a value in a previous study to estimate blockage on alpine skiers by Elfmark et al. [5]. For a bluff body with an infinite aspect ratio, Maskell showed that θ = 0.96 from experimental data [9]. Antoine et al. investigated different blockage corrections in different flow regimes on circular cylinders [8] and found that none of the known correction models were valid for all flow regimes. They proposed combining two different correction models where Maskell’s method with θ = 0.96 was used for sub-critical flow (Re < 2 × 10⁵) and Gaulbert’s formula was used for super-critical flow (Re > 2 × 10⁵) [8]. While Anthoine et al.’s approach has merit, how it might be applied when testing the human body is not clear as varying flow regimes will be expected on different body parts for any given Re. A better understanding of how closed test-section wind tunnel measurements of an alpine skier are affected by blockage, and how these effects can be corrected, can improve accuracy when comparing results between positions, athletes, and wind tunnels.

1.2. Reynolds Number Dependency

It is well known how air flow characteristics—and the resulting drag coefficient—change with respect to Re for simple shapes such as a cylinder or sphere. This knowledge is sometimes used in the design of competition suits [10]. However, the flow about a complex shape such as the human body is much more complicated and how the drag coefficient for such a body changes with Re is not well understood. Further complicating things, it is not uncommon for alpine skiers who often compete at speeds up to 35–40 m/s to be tested in wind tunnels that are not able to produce such high wind speeds. Taking into consideration the uncertainty of how the drag coefficient changes with Re, this raises into question the degree to which conclusions based on wind tunnel testing at lower speeds can be generalized to the higher competition speeds. Even if a wind tunnel does have the speed capacity, athlete safety is also an important consideration as it is physically demanding and possibly dangerous to perform measurements at such high speeds with the legs firmly attached to the ground. An improved knowledge of how the whole-body drag coefficient changes with respect to Re for varying positions may therefore provide not only better insight into performance, but also help guide testing methodology in terms of both measurement validity and safety.
Given the aforementioned limitations, the purpose of this study was to investigate the impact of blockage effect and Reynolds Number dependency by comparing measurements of an alpine skier in standardized positions between two wind tunnels with varying blockage ratios and speed ranges.

2. Methods

2.1. Wind Tunnel Testing

The experiments were carried out in wind tunnel at the Norwegian University of Science and Technology (NTNU) and in the Politecnico di Milano high speed wind tunnel (PoliMi). The characteristics of the wind tunnels and blockage ratio for this study are listed in Table 1.
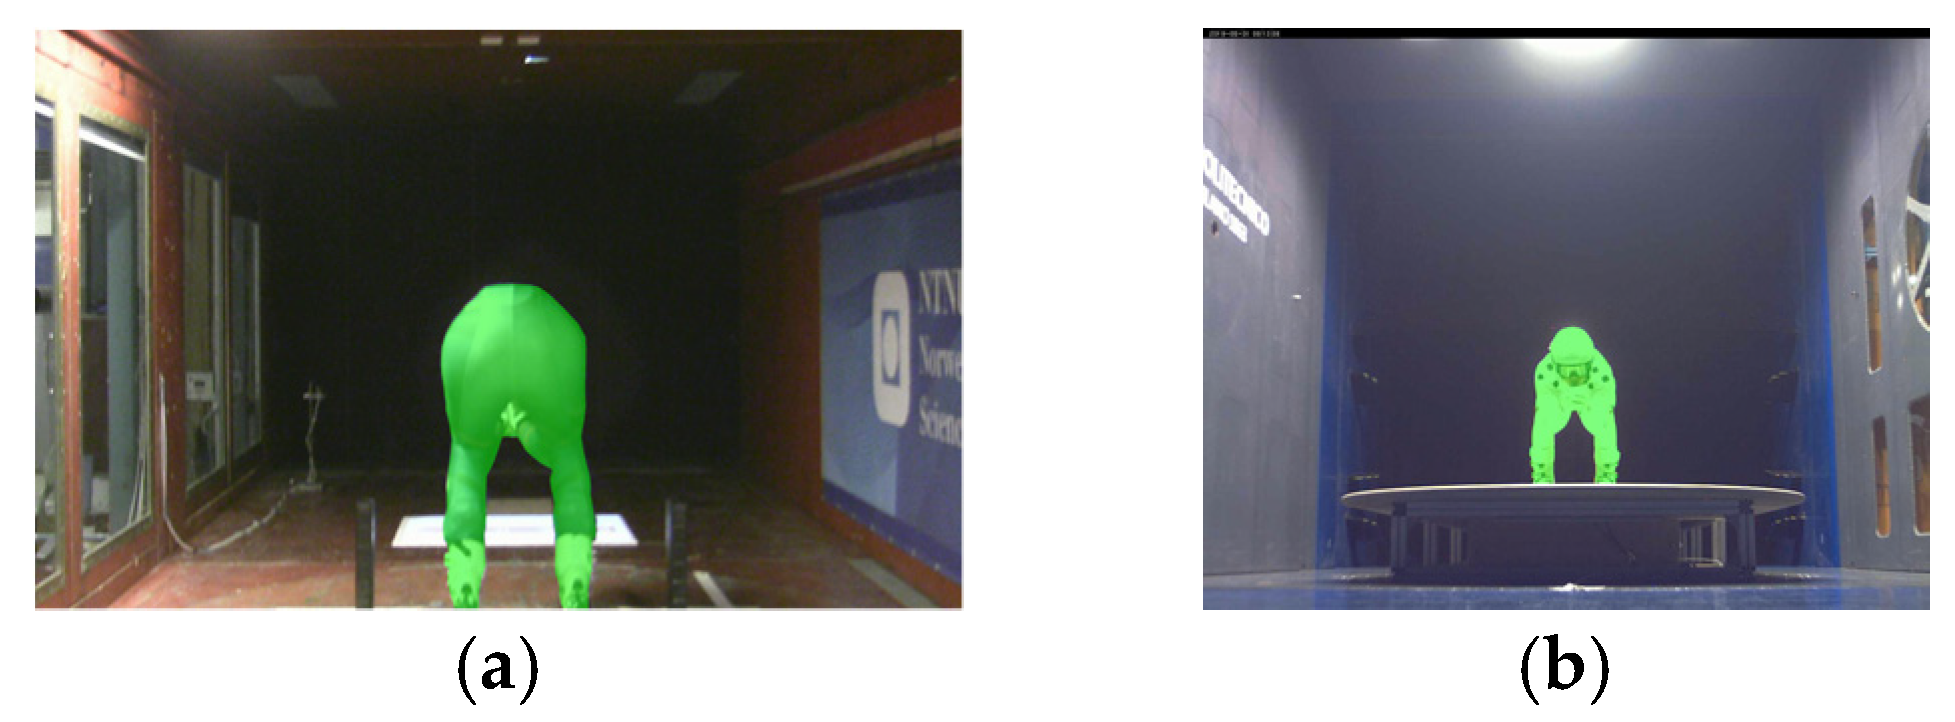
In both wind tunnels, alpine bindings were mounted directly on the force balance with a 35 cm distance between the bindings, center-to-center. A live video feed from a side-view perspective was projected onto the wind tunnel floor in front of the test subject (Figure 1). Cameras were also positioned inside the wind tunnel to capture the front/rear view of the athlete (Figure 2). In addition to position evaluation, images from these cameras were used to calculate the athlete’s frontal area. While this camera was mounted downstream and at the same height as the athlete at NTNU, it was mounted in the floor upstream of the athlete at PoliMi.
The test procedure was identical at both wind tunnels. To help the test subject maintain the intended positions, graphics were added to the video feed that was projected onto the floor of the tunnel. At each position and wind speed, three 20 s samples were taken from which mean values were calculated. Measurements were done in steps of 5 m/s from 10 up to 25 m/s at NTNU, and up to 35 m/s at PoliMi. Two positions were tested in both tunnels: (1) a standing position with the arms held outward at approximately 90 degrees abduction in the frontal plane and (2) a tucking position (Figure 1).
Images were taken from both the side and rear perspectives at the start of each measurement period to evaluate if the subject had maintained the intended position. The same test subject was used in both wind tunnels with the same equipment. The suits used were of the same fabric and differed only in color, with the suit used at PoliMi being white to facilitate frontal area measurement.

2.2. Frontal Area Measurements

The frontal area for each measurement was calculated on the basis on the front and rear-view images (Figure 2) taken during each measurement at NTNU and PoliMi, respectively. To calibrate the cameras, images were captured of a calibration object of known frontal area. For each sample period image, the silhouette of the subject was extracted from the background and the frontal area was calculated using the known calibration factor.
Figure 2. Rear (a) and front (b) images taken from the NTNU and PoliMi testing, respectively. These images were calibrated and used to calculate athlete frontal area.
Proceedings 49 00019 g002
This method of frontal area measurement has several important limitations. First, the measurements are based on a single camera and the plane where the calibration object was placed. Consequently, the part of the test subject that is closer to the camera than the calibration plane will be overestimated while the part of the test subject that is behind the calibration plane will be underestimated. Furthermore, the position and focal length of the cameras were also different in the two wind tunnels, which may influence the calculated frontal area, and consequently any comparisons of CD between tunnels.

2.3. Blockage Effect Correction

This study focused on Maskell’s method for blockage correction described in Equation 1 as this method is widely used. Determining an appropriate blockage constant θ in Equation 1 is a critical aspect of this method. We therefore investigated the effect of different blockage constants (θ) in Equation (1). In addition to θ = 2.58 and θ = 0.96, values which have been used previously in similar studies, an optimized θ was determined based on the least squares residual fit between the results from the two tunnels. The different θ were evaluated by examining the mean percentage absolute error between the results from the two wind tunnels.

2.4. Reynolds Number Dependency

Reynolds Number dependency was evaluated using the PoliMi test results where testing was over a larger Re range. Measurements were performed from 10 m/s to 35 m/s. Higher speeds were not tested in this experiment due safety considerations. The tested speed range corresponds to a Re range from Re = 3.2 × 10⁵ to Re = 1.1 × 10⁶, where a critical length of 0.4 m was defined based on the shoulder width of the athlete.

3. Results and Discussion

3.1. Blockage Effect Correction

For comparison between the two wind tunnels, mean percentage absolute error (MAE) was used. The results for both separate and combined comparisons of the Standing and Tuck positions for the evaluated blockage constants are presented in Table 2.
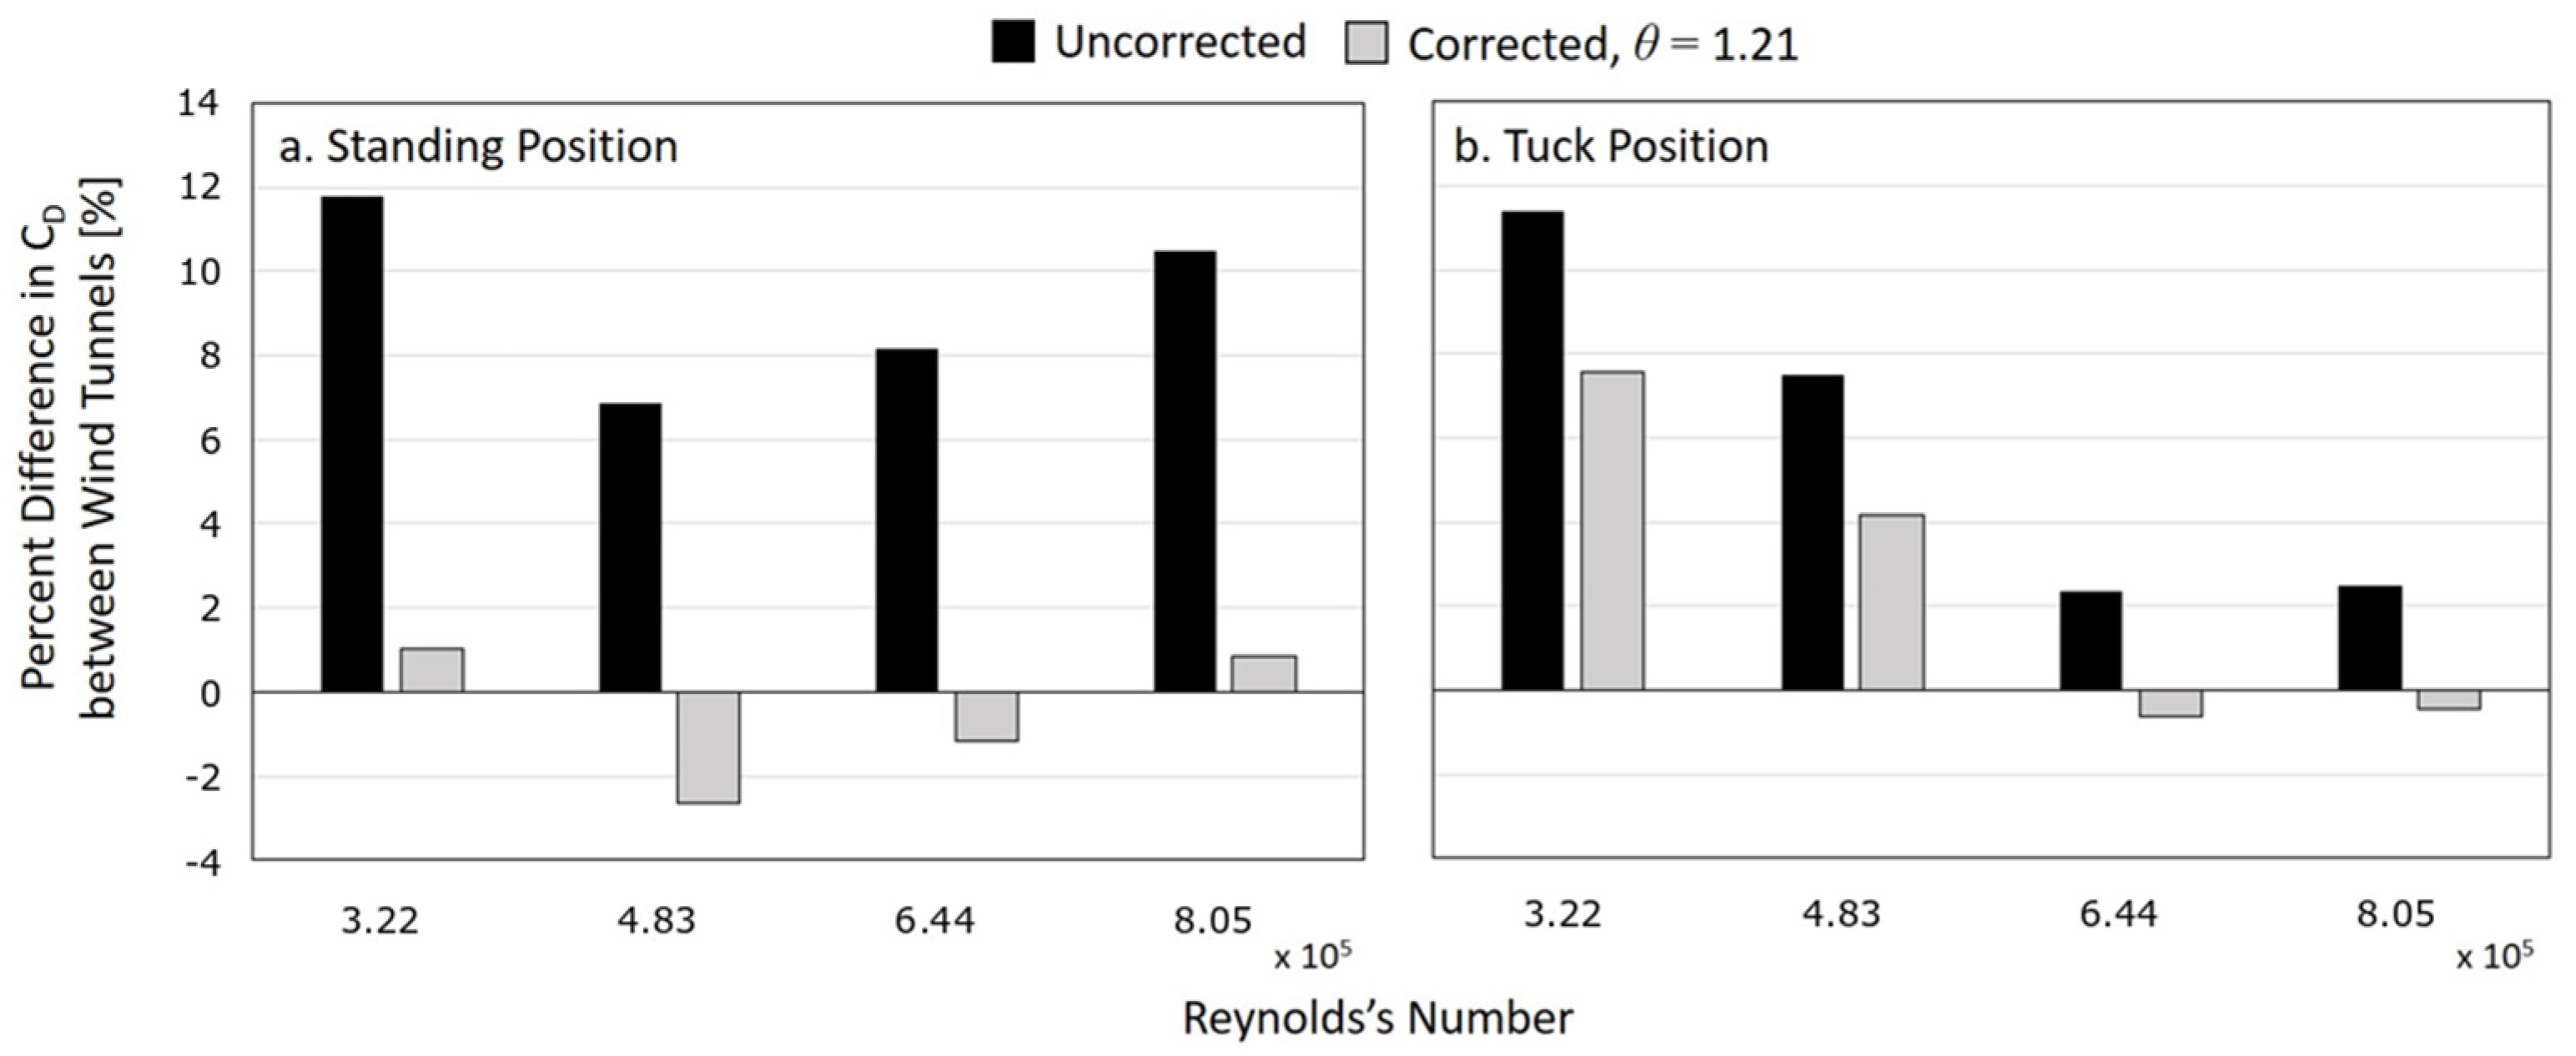
As Table 2 shows, the largest differences in C D measurements between the two tunnels were measured when blockage correction was not performed. Even for the low position, where the blockage ratio B was as low as 5.6% at NTNU, blockage correction substantially improved the agreement between tunnels. A universal θ for all positions was not ideal as there is a big difference in MAE between the different positions for the same θ. Nevertheless, by choosing a θ = 1.21 the resulting MAE is only 2.2%, in the same range as the best fits for both positions separately. The effect of blockage correction on the comparison between wind tunnels is shown in Figure 3.
As expected, the drag coefficient at NTNU was larger than at PoliMi, due to the higher blockage ratios at NTNU. A θ = 1.21 corrected the measurements to within one standard deviation for the two highest speeds (20 and 25 m/s). It is worthwhile to point out that while θ = 1.21 worked well in correcting both the standing and tuck positions at higher Re, it did not do well for the tuck position at low Re. While this may not be a problem when studying high speed sports such as alpine skiing, it does indicate that further investigation of appropriate θ for lower speed sports is warranted.
One uncertainty in this comparison between the wind tunnels is due to the frontal area measurement method in which the pictures were not taken from the same perspective and distance. The frontal area for the standing position measured at NTNU and PoliMi was calculated to be 0.57 ± 0.006 m2 and 0.55 ± 0.01 m2 respectively. However, a difference in frontal area could also result from a slight postural change. In this study, a difference in head position between the wind tunnels was observed which could explain some of the difference in frontal area.

3.2. Reynolds Number Dependency

Reynolds Number dependency was evaluated by examining the uncorrected measurements from PoliMi (Figure 4). The drag coefficient in both positions becomes stable at Re higher than 8 × 10⁵ (wind speed of 25 m/s). This indicates that one could test positions of an alpine skier at wind speeds around 25 m/s and expect the same results as at 35 m/s. When testing different suits however, the Reynolds number dependency must be considered, as this is an inherent part of the design.
One limitation in testing the Standing position at high Re was that the athlete was forced to lean forward to maintain balance. By estimating an air density of 1.225 kg/ m 3 and a C D A of 0.47   m 2 (taken from the highest position at 25 m/s in PoliMi) an athlete will experience around 180 N and 350 N in drag force at 25 m/s and 35 m/s, respectively. To maintain balance against the much higher drag force, the athlete was forced to lean forward, changing their position and frontal area slightly. By calculating the CD for all measurements this change in frontal area between measurements was accounted for. The frontal area at 35 m/s was nearly 3% lower than at 25 m/s. A high speed will make it hard for the athlete to maintain the intended position and possibly influence the validity of the measurements and the safety of the athlete.

4. Conclusions

The aerodynamic drag and frontal area of an alpine skier in two standardized positions were measured in two different wind tunnels, with different wind speed ranges and cross-sectional areas. The results between the two wind tunnels were compared and an optimized blockage constant was calculated for use in Maskell’s method for blockage correction. The best blockage constants for the high and low positions were θ = 1.15 and θ = 2.52 with a mean absolute error of 1.5% and 1.8%, respectively. For the two tested positions combined, a blockage constant of θ = 1.21 resulted in a mean absolute error of 2.2% and showed good agreement for measurements above 20 m/s. Both positions showed a decrease in drag coefficient between 10 m/s and 25 m/s and a constant drag coefficient for speeds higher than 25 m/s, indicating that the shape of a human body is independent of Reynolds number from Re = 8 × 10⁵. Not having to test alpine skiers at higher Reynolds number might not only make it easier for athletes to reproduce intended positions for testing, but also make wind tunnel testing safer for the athlete.

Acknowledgments

This study was carried out with support and funding from the Norwegian Olympic Committee and the Norwegian Ski Federation under the project Aerodynamic 2022. The authors would like to acknowledge and thank Ing. Stefano Giappino, Ing. Umberto Spinelli, Marco Belloli and Marco Bocciolone from the Politecnico di Milano wind tunnel for facilitating the experiment at PoliMi. The authors would also like to acknowledge the participation of the athlete who voluntarily gave her time to this research.

References

  1. Savolainen, S.; Visuri, R. A review of athletic energy expenditure, using skiing as a practical example. J. Appl. Biomech. 1994, 10, 253–269. [Google Scholar] [CrossRef]
  2. Watanabe, K.; Ohtsuki, T. Postural changes and aerodynamic forces in alpine skiing. Ergonomics 1977, 20, 121–131. [Google Scholar] [CrossRef]
  3. Meyer, F.; Le Pelley, D.; Borrani, F. Aerodynamic drag modeling of alpine skiers performing giant slalom turns. Med. Sci. Sports Exerc. 2012, 44, 1109–1115. [Google Scholar] [CrossRef]
  4. Supej, M.; Sætran, L.; Oggiano, L.; Ettema, G.; Šarabon, N.; Nemec, B.; Holmberg, H.C. Aerodynamic drag is not the major determinant of performance during giant slalom skiing at the elite level. Scand. J. Med. Sci. Sports 2013, 23, 38–47. [Google Scholar] [CrossRef]
  5. Elfmark, O.; Bardal, L.M. An Empirical Model of Aerodynamic Drag in Alpine Skiing. Proceedings 2018, 2, 310. [Google Scholar]
  6. Battisti, L.; Zanne, L.; Anna, S.D.; Dossena, V.; Persico, G.; Paradiso, B. Aerodynamic measurements on a vertical Axis wind turbine in a large scale wind tunnel. J. Energy Resour. Technol. 2011, 133, 1–9. [Google Scholar] [CrossRef]
  7. Molina, A.C.; De Troyer, T.; Massai, T.; Vergaerde, A.; Runacres, M.C.; Bartoli, G. Effect of turbulence on the performance of VAWTs: An experimental study in two different wind tunnels. J. Wind Eng. Ind. Aerodyn. 2019, 193, 103969. [Google Scholar] [CrossRef]
  8. Anthoine, J.; Olivari, D.; Portugaels, D. Wind-tunnel blockage effect on drag coefficient of circular cylinders. Wind Struct. 2009, 12, 541–551. [Google Scholar] [CrossRef]
  9. Maskell, E.C. A Theory of the Blockage Effects on Bluff Bodies and Stalled Wings in a Closed Wind Tunnel; No. ARC-R/M-3400; Aeronautical Research Council: London, UK, 1963.
  10. Oggiano, L.; Sætran, L.; Løset, S.; Winther, R. Reducing the athlete’s aerodynamical resistance. J. Comput. Appl. Mech. 2007, 8, 163–173. [Google Scholar]
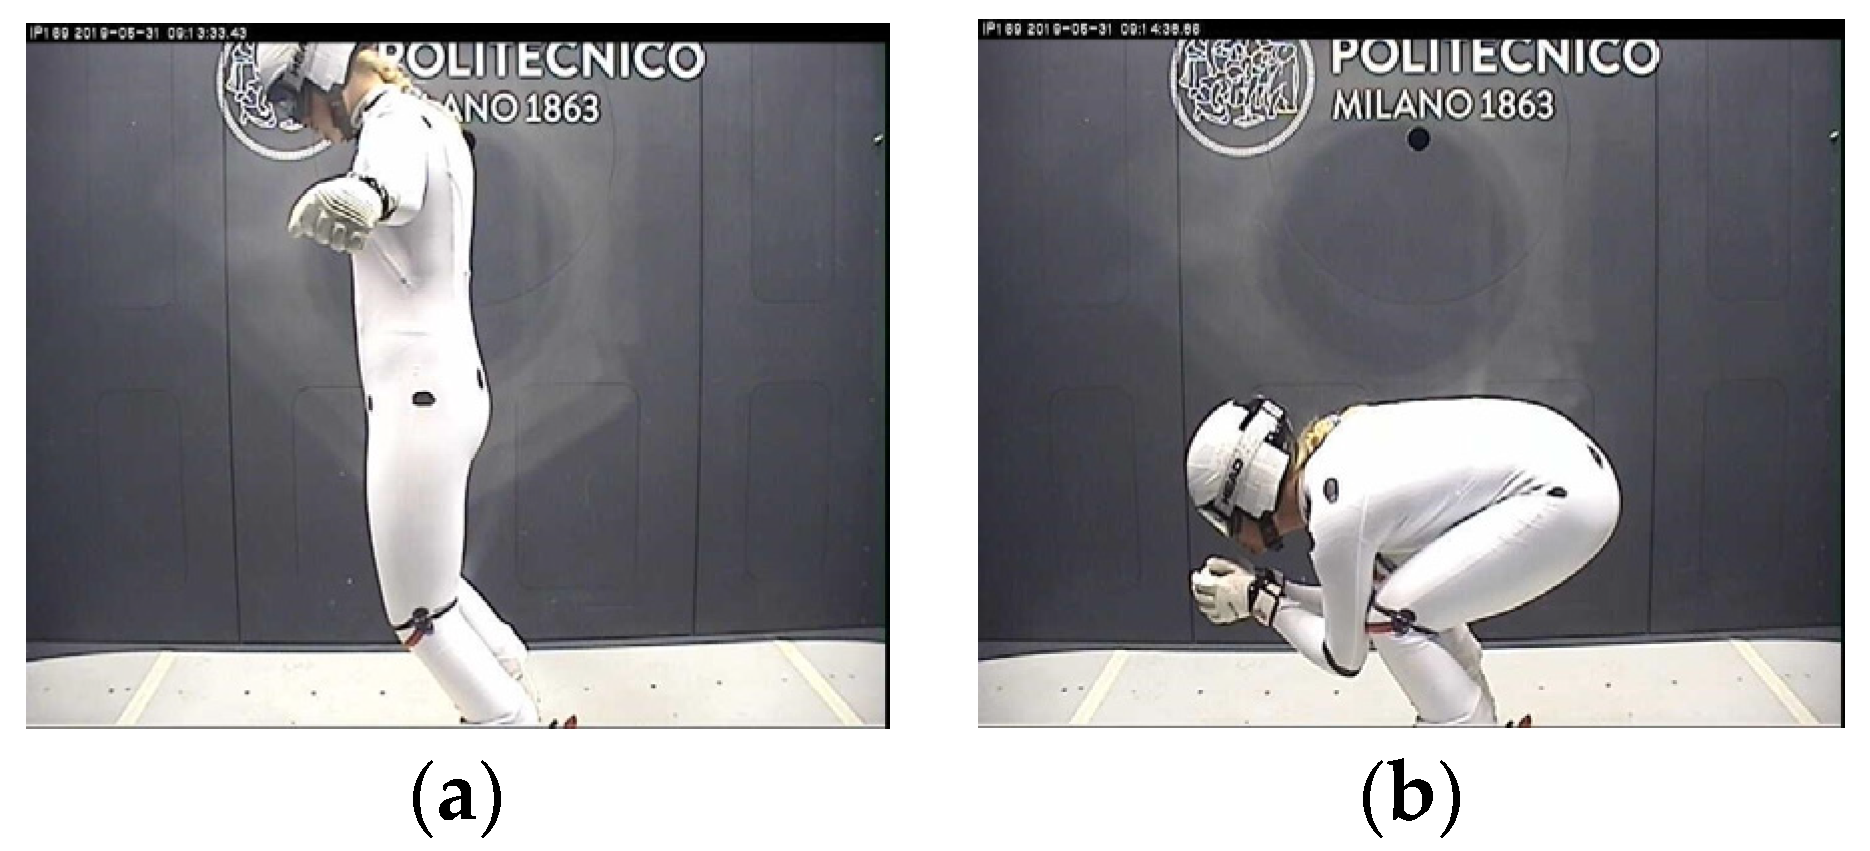
Figure 1. Images of the standing (a) and tuck (b) positions taken from the side-view camera during the PoliMi testing.
Proceedings 49 00019 g001
Figure 3. The effect of blockage correction (θ = 1.21) on the percentage difference in C D between the two wind tunnels for both the Standing (a) and Tuck (b) positions. The measured points correspond to measurements at every 5 m/s from 10 to 25 m/s.
Proceedings 49 00019 g003
Figure 4. Uncorrected results of drag coefficient with respect to Reynolds number from the Standing and Tuck position measured PoliMi. The measured points correspond to measurements at every 5 m/s from 10 to 35 m/s. The error bars show the standard deviation with n = 3.
Proceedings 49 00019 g004
Table 1. Main characteristics of the wind tunnel, turbulence intensity (Ti) and blockage ratios for the experiments at the Norwegian University of Science and Technology and at the Politecnico di Milano.
Wind TunnelTest Section [m] (Width × Height)Blockage Ratio [%] (Standing/Tuck)Max Wind Speed [m/s]Force BalanceTi [%]
NTNU2.7 × 1.8 (4.9   m 2 )11.7/5.625Schenck
6-comp.
<0.24
PoliMi4 × 3.84 (15.4   m 2 )3.5/1.755RUAG Aerospace
6-comp.
<0.1
Table 2. Mean percentage absolute error (MAE) in CD measured for the Standing and Tuck positions at the NTNU and PoliMi wind tunnels, with and without Maskell’s blockage correction. The mean standard error in measurements was 0.005 (0.5%). θ1, θ2 and θ3 indicate the optimized blockage constants for standing, tuck and both positions combined, respectively.
Blockage ConstantStandingTuckCombined
None (no correction)8.94.07.7
θ = 2.589.41.86.6
θ = 0.961.82.22.4
θ1 = 1.15, θ2 = 2.52, θ3 = 1.211.51.82.2
Publisher’s Note: MDPI stays neutral with regard to jurisdictional claims in published maps and institutional affiliations.