Proceeding Paper

A Comparison between Conceptual and Physically Based Models in Predicting the Hydrological Behavior of Green Roofs †

Department of Civil Engineering, University of Salerno, Via Giovanni Paolo II, 132, 84084 Fisciano (Salerno), Italy
*
Author to whom correspondence should be addressed.
Presented at the 4th International Electronic Conference on Water Sciences, 13–29 November 2019; Available online: https://ecws-4.sciforum.net/.
Proceedings 2020, 48(1), 8; https://doi.org/10.3390/ECWS-4-06450
Published: 12 November 2019
(This article belongs to the Proceedings of The 4th International Electronic Conference on Water Sciences)

Abstract

:
The evolving climate conditions contribute to increase flooding risk in urban areas. Green roofs are effective tools for controlling and managing stormwater runoff. With the aim to prevent these damaging events, an accurate modelling of the response of green roofs to storm events becomes essential. The goal of this research is to compare the accuracy of two hydrological models in predicting the behavior of two green roof test beds in terms of runoff production. The test beds are located in the campus of University of Salerno, in a typical Mediterranean climate and they differ in the composition of the drainage layer. The selected models are the Storm Water management model (SWMM) model and the Nash model. They have been calibrated against hourly data of 25 rainfall-runoff events observed at the experimental site and compared using a number of goodness of fit indexes. The Nash cascade model aims to be a very simple but effective approach. No substantial differences were observed in the behavior of the two green roof plots, though they differ in their design characteristics. Finally, the existence of a relationship between the errors and the rainfall characteristics has been found.

1. Introduction

One of the consequences of climate change is the increase in the occurrence and intensity of heavy rainfall events. This condition leads to more frequent and severe urban flooding caused by the increasing stormflow volumes that exceed sewer capacity [1,2,3]. In order to mitigate the risk of flooding in urban areas, sustainable urban drainage strategies have been proposed, including green roofs [4,5,6]. The potential of green roofs to manage urban stormwater has largely been proved [7]. In light of this, modeling the hydrological behavior of vegetated covers appears a crucial issue for urban planners, policy-makers and developers in order to quantify the stormwater management ability of green infrastructures before retrofitting existing buildings or planning new settlements. To predict the hydrological performance of a green roof, different models with different levels of complexity have been introduced by several authors [8,9,10]. Among these, the Storm Water management model (SWMM) model has been selected here due to its widespread use and demonstrable efficiency [11,12]. It has been compared, using a number of goodness of fit indexes with a basic transfer function approach, to the Nash model [13], typically used to simulate the hydrological behavior of natural river basins and not yet fully explored concerning its implementation in predicting the runoff production from green roof systems [14,15]. The two models have been calibrated against hourly data of 25 rainfall-runoff events observed at two experimental green roofs located in southern Italy, in a typical Mediterranean climate. They are characterized by different composition of the drainage layer that is expanded clay for GR1 and plastic trays filled with expanded clay for GR2. The present research aims, behind a comparative assessment of the ability of conceptual and physically based models to simulate the hydrological performance of green roofs; and to investigate whether the hydrological behavior of the two experimental plots, in terms of runoff production, differs and quantify this difference, if there is any difference. Finally, with a multiple regression analysis, the existence of a relationship between the errors and the rainfall characteristics has been analyzed.

2. Materials and Methods
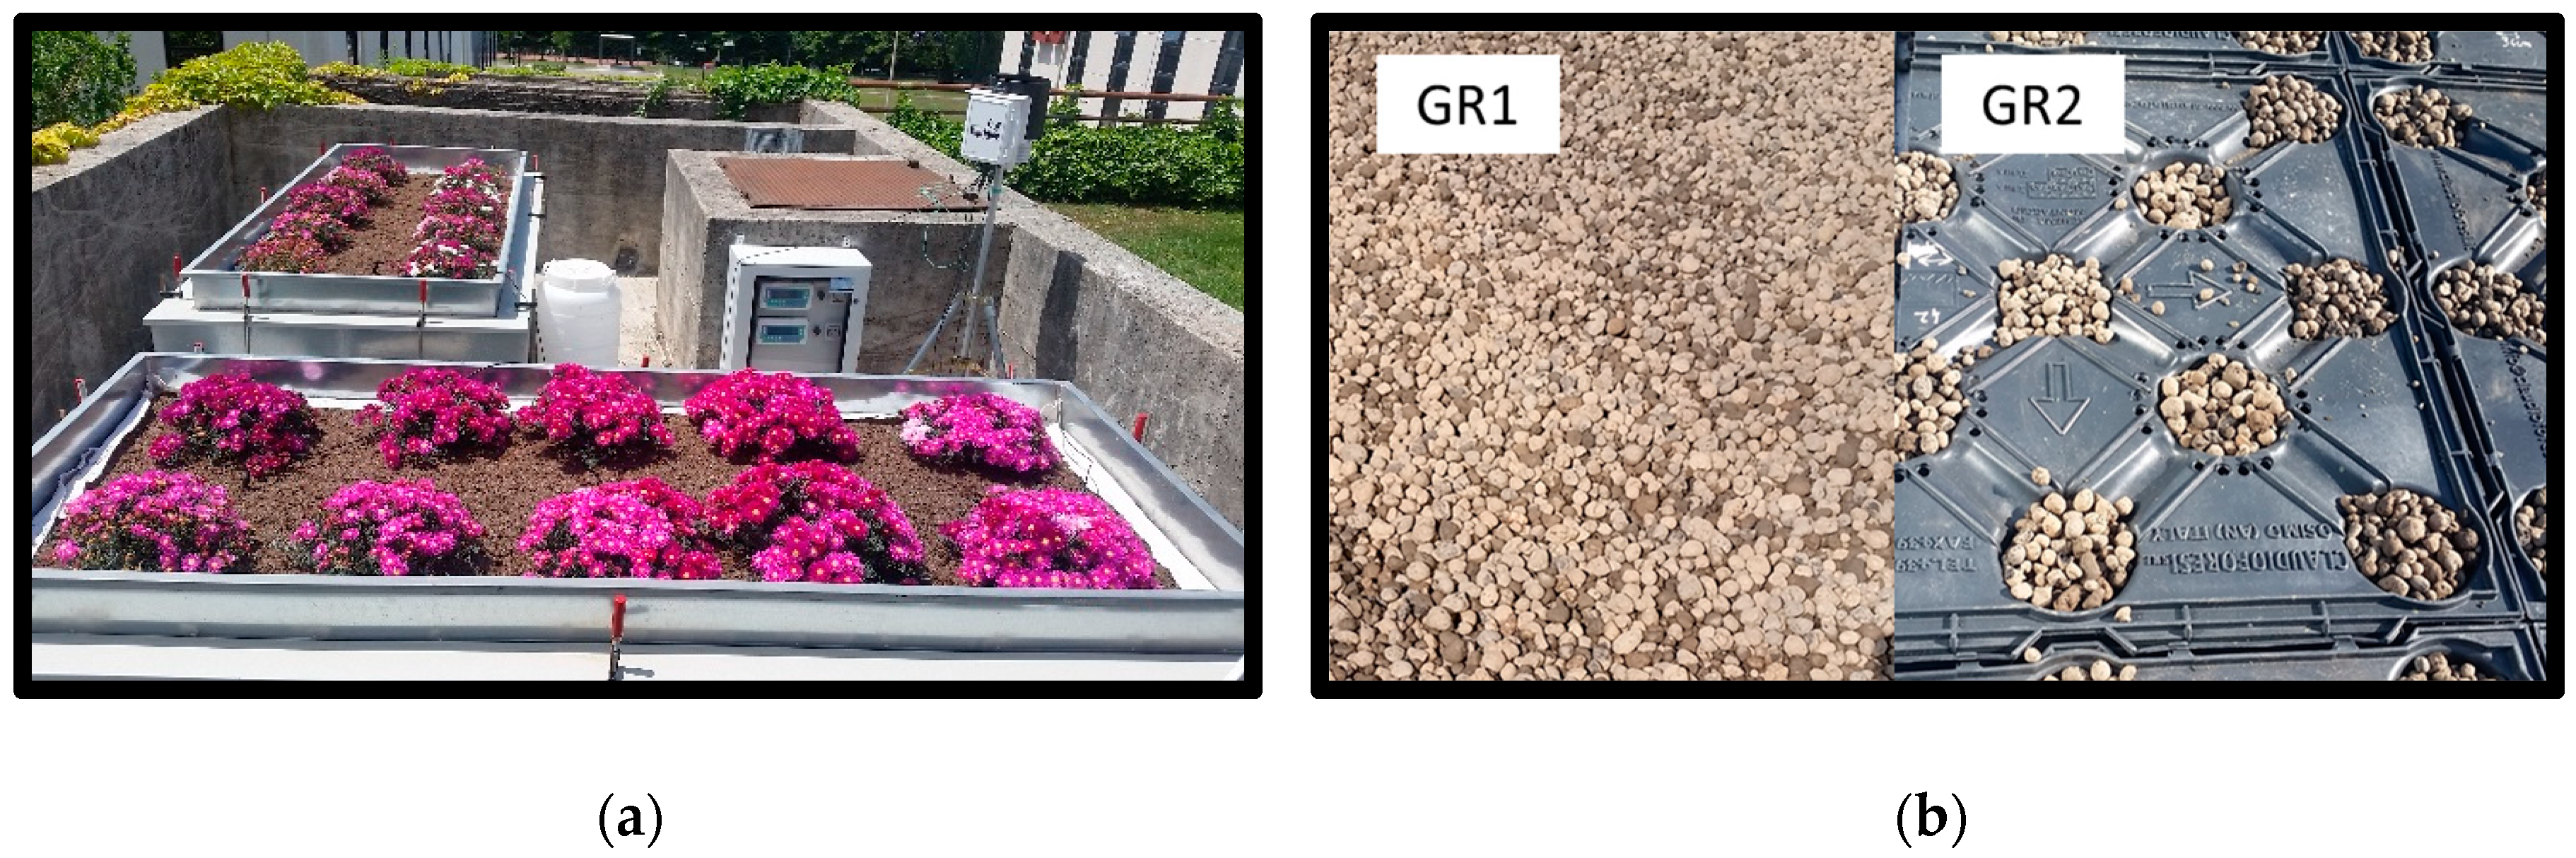
2.1. Case Study

The study site consisted of two green roof test beds installed in the campus of University of Salerno [16,17]. They were placed on steel benches with a slope of 1% and an area of 2.5 m2 (1 × 2.5 m) that were surrounded by perimetral channels. The latter convey the runoff fluxes into a tank located on a scale which measures the weight of the rainwater at 5-min time intervals. The two green roofs were made up of three layers for a total thickness of 15 cm: the vegetation layer where succulents grew, a 10 cm deep support substrate of peat and zeolite required for the root development, and a water storage layer of approximately 5 cm. The two benches differed for the construction material of the drainage layer, that was expanded clay for GR1 and commercial drainage panels with trays filled with expanded clay for GR2 (Figure 1). The meteorological conditions were monitored with a 5 min resolution by a weather station equipped with a rain gauge, a thermohygrometer, and a pyranometer; in addition two soil moisture sensors were installed in the support layers of each bench. The monitoring campaign started on 16 February 2017 and is ongoing.

2.2. Datasets

Twenty-five rainfall-runoff events were considered for this study. The events with the highest quality were selected since they do not have missing values due to the temporary failure of the instruments. For each storm event, the following three parameters were evaluated: rain duration, “d”; cumulative rainfall, “C”; and the mean storm intensity, “I”. The retention capacity “RC” was used as indicator of the hydrological performance of the roofs. The events presented a minimum and a maximum duration of 60 and 1800 min, respectively, whilst the cumulative rainfall ranged between 0.8 mm and 30.2 mm. The average intensity was never less than 0.5 mm/h and never higher than 10.2 mm/h. Finally, the retention capacity reached at least 6.6% and 2.8% and at most 96.2% and 90.3% for GR1 and GR2, respectively. In Table 1, an overview of the above-cited parameters for each event is presented.

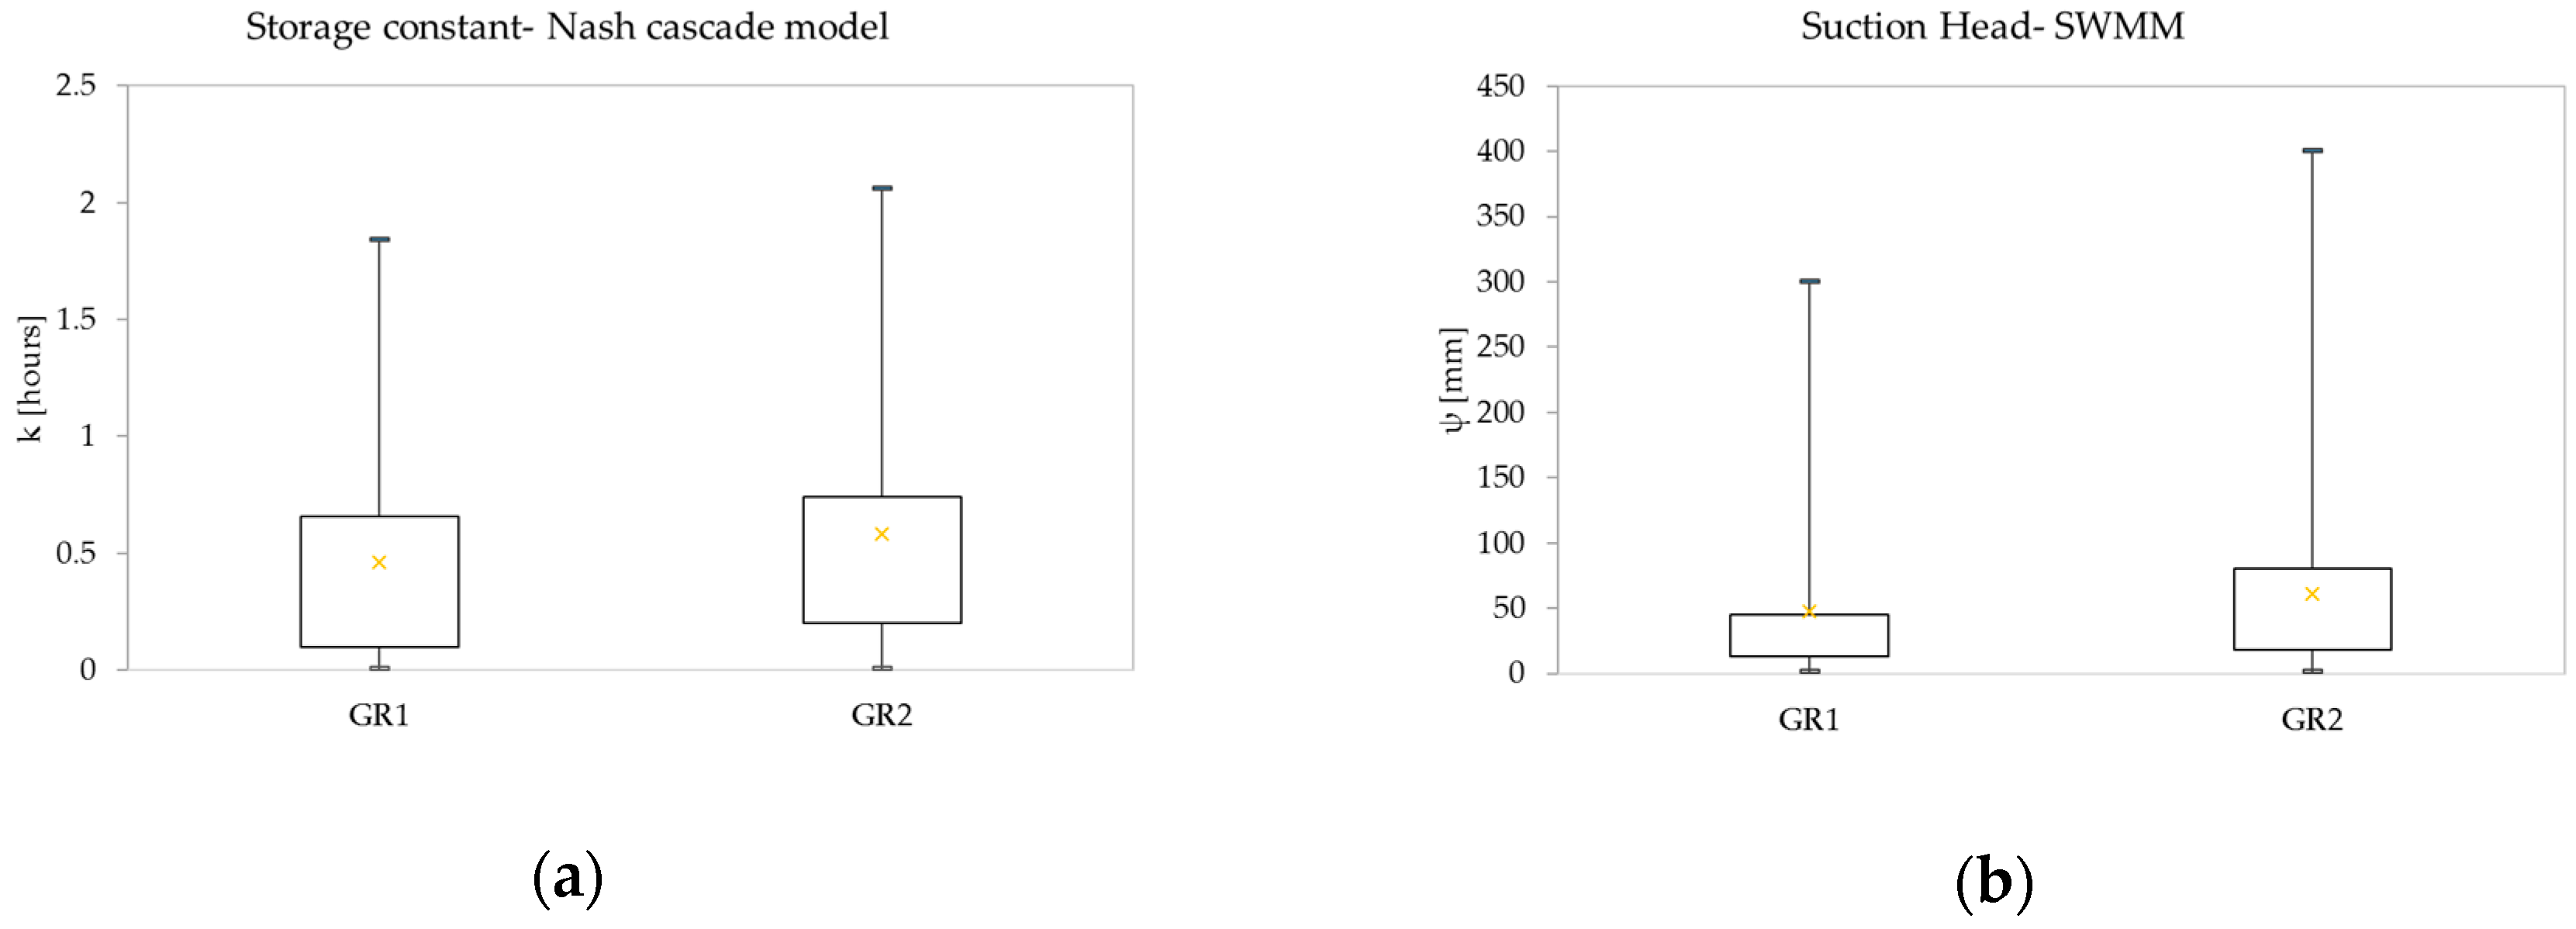
2.3. SWMM and NASH Model

The Nash cascade model and the storm water management model (SWMM) have been selected in this study to reproduce the hydrological response at the event scale for the two green roof test rigs in terms of runoff production. The rainfall–runoff conceptual model introduced by Nash [13] considers a linear cascade of n reservoirs with equal storage constant k for derivation of the instantaneous unit hydrograph (IUH). The IUH of the Nash model is given by:
h ( t ) = t n 1 ( n 1 ) ! k n e t k
where t is the time step.
In this research, the Nash model parameter “n” was set a priori to 2 by analyzing the hydrograph patterns, whilst the “k” parameter results from the calibration of the model.
The SWMM is a dynamic rainfall–runoff simulation model. It performs a moisture balance tracking the movement of water through each layers of the system. The bio-retention module was selected among the low-impact development (LID) controls to simulate the green roofs. It consisted of three layers (surface, substrate, and a drainage layer). SWMM uses a routing equation to quantify water flow through the surface:
Q s = ( S 1 n A ) W D 5 3
While the Green–Ampt equation was used to simulate the infiltration of the water into the substrate:
f = k s a t [ 1 + ( ϕ θ ) ψ F ]
where Qs is the surface overflow rate, S1 represents the surface slope, n is depth of depression storage, A is flow area, W is the sub-catchment width, D corresponds to the depth of water above the sub-catchment, f stands for the infiltration rate, ksat represents the saturated hydraulic conductivity, ϕ is the soil porosity, θ equals the water content, ψ corresponds to the suction head, and F is the cumulative amount of infiltrated water. All the required parameters were estimated from field measurements, the literature, or taken from default values, while the suction head was subject to calibration process.

2.4. Model Evaluation

The Nash–Sutcliffe efficiency (NSE) index, the root mean square error (RMSE), and the mean absolute error (MAE) were used to quantitatively assess how well the observed runoff vales have been reproduced by the applied models for each event. The k and ψ parameters were iteratively adjusted until the NSE reached the highest value. The indexes were calculated as follows:
NSE = 1 i = 1 n ( R o b s . i R m o d . i ) 2 i = 1 n ( R o b s . i R ¯ o b s . i ) 2
RMSE ( mm ) = [ 1 n i = 1 n ( R mod . i R obs . i ) 2 ] 1 2
MAE ( mm ) = 1 n i = 1 n | R mod . i R obs . i |
where n represents the length of the sample, and Rmod,i and Robs,i represent the modeled and the observed runoff, respectively.
An efficiency index equal to one and a value of RMSE and MAE close to zero indicate a perfect match between the simulated and observed runoff.

3. Results and Discussion

The goodness of fit indexes reported in Table 2 show the agreement between the modeled and the observed values of runoff. The average values of NSE, which was higher than 60%, indicated an acceptable level of performances for both models and test benches. The errors were slightly lower for SWMM than for the Nash cascade model. Indeed, SWMM returned mean RMSE and MAE of about 0.30 mm and 0.22 mm, respectively, compared to mean RMSE around to 0.40 mm and MAE close to 0.25 mm, for Nash cascade model. For the comparison between the two experimental beds, the indexes show very similar errors for GR1 and GR2, which suggests no substantial differences between their hydrological behavior.
Concerning the calibrated values of the storage coefficient for Nash model, it was observed (median values in boxplot of Figure 2a) that the average value of k was higher for GR2 (0.5) than for GR1 (0.46). This result proves that the detention capacity of GR2 was slightly higher, probably because of the existence of the plastic trays in the panels, which store, retain, and delay water until the maximum capacity has been reached and runoff begins. The distance between the first and the third quartile illustrated by the boxplot were furthermore similar for the two experimental roofs, highlighting a similar variability for the k parameter. The maximum values were also comparable, and no outliers have been detected.
As regards the calibration process of SWMM, GR2 exhibited an average value of ψ (61 mm) higher than GR1 (48 mm) (median values in boxplot of Figure 2b). One reason might be that the expanded clay in the modular panels of GR2 was confined within the trays. The compaction in these trays caused a lower porosity than the expanded clay in the drainage layer of GR1, and, under the same water content, the larger the pores, the lower the suction to drain the soil. The interquartile distance in the case of SWMM for GR1 and GR2 is quite different, with quite different maximum values calibrated for the two experimental sites, highlighting different behavior in terms of calibration for the two GRs.
In order to improve the descriptive capability of the applied model, and taking into consideration the uncertainty in the performances of the GR retention models generated by the specific rainfall properties at the event scale, a multiple regression analysis was performed in order to investigate the statistical relationships between the errors and the rainfall characteristics (Table 3). The p-value for each term tested the null hypothesis that no correlation existed between the dependent and independent variables.
The low p-values (< 0.05) for the cumulative rainfall and the event duration indicated that the null hypothesis can be rejected, and, in other words, that rainfall duration and cumulative values appear as significant variables with respect to model errors. This circumstance opened the necessity to improve the GRs’ modeled hydrological behavior, especially in the case of large events. On the other side, no effect or relationship appeared between the mean intensity and the errors.

4. Conclusions

The aim of this paper was to evaluate the accuracy of two different hydrological models in simulating the hydrological response of two green roof plots to storm events. The performances of a conceptual model, namely the Nash cascade model, and of SWMM, falling within the class of the physically based, models, in predicting the hydrological behavior of green roofs were tested and compared. The case study was an experimental site including two GR benches located in a Mediterranean climate. The test beds differed for the material used in the drainage layer: expanded clay for GR1 and commercial plastic panels filled with expanded clay for GR2. The selected models were calibrated by comparing the observed values of runoff related to 25 rainfall-runoff events recorded at the experimental site and the observed ones, so as to optimize three goodness of fit indexes, the NSE, RMSE, and MAE. The parameters subjected to calibration were the storage coefficient “k” for the Nash model and the suction head “ψ” for SWMM. The mean values of k and ψ resulting from the calibration process underlined that the drainage layer of GR2 had a slightly higher detention capacity and a lower porosity than GR1. The analysis has proved that both the models have good capabilities in simulating the runoff production from green roofs, as demonstrated by the high values of NSE. Although the Nash model is a simple model, it appears very suitable for the event scale simulations. Furthermore, the low difference in the values of error for GR1 and GR2 shows that the two green benches exhibited similar hydrological behavior. A more detailed study revealed the existence of a relationship between the errors and the rainfall characteristics, specifically, a multiple regression analysis demonstrated that the MAE and RMSE increased with increasing cumulative rainfall and the duration of the events.

References

  1. Califano, F.; Mobilia, M.; Longobardi, A. Heavy Rainfall Temporal Characterization in the Peri-Urban Solofrana River Basin, Southern Italy. Procedia Eng. 2015, 119, 1129–1138. [Google Scholar] [CrossRef]
  2. Mobilia, M.; Califano, F.; Longobardi, A. Analysis of Rainfall Events driving MDHEs Occurred in the Solofrana River Basin, Southern Italy. Procedia Eng. 2015, 119, 1139–1146. [Google Scholar] [CrossRef]
  3. Longobardi, A.; Diodato, N.; Mobilia, M. Historical storminess and hydro-geological hazard temporal evolution in the solofrana river basin—Southern Italy. Water 2016, 8, 398. [Google Scholar] [CrossRef]
  4. Lee, J.Y.; Moon, H.J.; Kim, T.I.; Kim, H.W.; Han, M.Y. Quantitative analysis on the urban flood mitigation effect by the extensive green roof system. Environ. Pollut. 2013, 181, 257–261. [Google Scholar] [CrossRef] [PubMed]
  5. Akter, T.; Quevauviller, P.; Eisenreich, S.J.; Vaes, G. Impacts of climate and land use changes on flood risk management for the Schijn River, Belgium. Environ. Sci. Policy 2018, 89, 163–175. [Google Scholar] [CrossRef]
  6. Sartor, J.; Mobilia, M.; Longobardi, A. Results and findings from 15 years of sustainable urban storm water management. Int. J. Saf. Secur. Eng. 2018, 8, 505–514. [Google Scholar] [CrossRef]
  7. Roehr, D.; Kong, Y. Runoff reduction effects of green roofs in Vancouver, BC, Kelowna, BC, and Shanghai, PR China. Can. Water Resour. J. 2010, 35, 53–68. [Google Scholar] [CrossRef]
  8. Palla, A.; Gnecco, I.; Lanza, L.G. Compared performance of a conceptual and a mechanistic hydrologic models of a green roof. Hydrol. Process. 2012, 26, 73–84. [Google Scholar] [CrossRef]
  9. Carson, T.; Keeley, M.; Marasco, D.E.; McGillis, W.; Culligan, P. Assessing methods for predicting green roof rainfall capture: A comparison between full-scale observations and four hydrologic models. Urban Water J. 2017, 14, 589–603. [Google Scholar] [CrossRef]
  10. Mobilia, M.; Longobardi, A.; Sartor, J. Including a-priori assessment of actual evapotranspiration for green roof daily scale hydrological modelling. Water 2017, 9, 72. [Google Scholar] [CrossRef]
  11. Cipolla, S.S.; Maglionico, M.; Stojkov, I. A long-term hydrological modelling of an extensive green roof by means of SWMM. Ecol. Eng. 2016, 95, 876–887. [Google Scholar] [CrossRef]
  12. Peng, Z.; Stovin, V. Independent validation of the SWMM green roof module. J. Hydrol. Eng. 2017, 22, 04017037. [Google Scholar] [CrossRef]
  13. Nash, J.E. The form of the instantaneous unit hydrograph. Int. Assoc. Sci. Hydrol. 1957, 3, 114–121. [Google Scholar]
  14. Krasnogorskaya, N.; Longobardi, A.; Mobilia, M.; Khasanova, L.F.; Shchelchkova, A.I. Hydrological Modeling of Green Roofs Runoff by Nash Cascade Model. Open Civ. Eng. J. 2019, 13, 163–171. [Google Scholar] [CrossRef]
  15. Mobilia, M.; Longobardi, A. Event Scale Modeling of Experimental Green Roofs Runoff in a Mediterranean Environment. In Frontiers in Water-Energy-Nexus—Nature-Based Solutions, Advanced Technologies and Best Practices for Environmental Sustainability; Springer: Cham, Switzerland, 2020; pp. 153–156. [Google Scholar]
  16. Mobilia, M.; Longobardi, A. Smart Stormwater Management in Urban Areas by Roofs Greening. In Proceedings of the International Conference on Computational Science and Its Applications, Trieste, Italy, 3–6 July 2017; Springer: Cham, Switzerland, 2017; pp. 455–463. [Google Scholar]
  17. Mobilia, M.; D’Ambrosio, R.; Longobardi, A. Climate, soil moisture and drainage layer properties impact on green roofs in a Mediterranean environment. In Frontiers in Water-Energy-Nexus—Nature-Based Solutions, Advanced Technologies and Best Practices for Environmental Sustainability; Springer: Cham, Switzerland, 2020; pp. 169–171. [Google Scholar]
Figure 1. (a) The experimental site; (b) composition of the drainage layers.
Proceedings 48 00008 g001
Figure 2. (a) Boxplot of calibrated K (Nash model); (b) boxplot of ψ (SWMM model) for both roofs.
Proceedings 48 00008 g002
Table 1. Rainfall/runoff characteristics for the selected events (d = duration, C = cumulated rainfall, I = mean storm peak intensity, RC = retention capacity).
Date25/07/201707/09/201707/11/201710/01/201811/01/201812/01/201816/01/201817/01/201817/01/2018
d (min)42054036054096030090018060
C (mm)2.84.615.230.220.15.315.51.33.6
I (mm/h)2.02.39.410.29.42.02.81.03.6
RCGR1 (%)82.468.936.845.222.485.46.677.577.6
RCGR2 (%)84.068.92.949.025.088.014.477.283.4
Date01/02/201803/02/201807/02/201813/02/201814/02/201818/02/201820/02/201802/03/201803/03/2018
d (min)30012008406024018001080240720
C (mm)3.312.411.20.84.811.211.43.311.4
I (mm/h)1.53.84.80.82.51.32.31.82.3
RCGR1 (%)80.536.67.084.381.482.518.938.217.7
RCGR2 (%)74.442.05.690.376.777.629.440.039.1
Date09/04/201817/04/201803/05/201804/05/201823/05/201805/10/201807/11/2018
d (min)180360180300300240360
C (mm)6.15.87.11.313.02.816.0
I (mm/h)3.65.34.80.54.81.36.4
RCGR1 (%)80.382.778.196.211.484.825.2
RCGR2 (%)80.279.973.978.640.576.020.0
Table 2. The goodness of fit indexes for the two models.
EventSWMM-GR1SWMM-GR2NASH-GR1NASH-GR2
NSE (-)RMSE (mm)MAE (mm)NSE (-)RMSE (mm)MAE (mm)NSE (-)RMSE (mm)MAE (mm)NSE (-)RMSE (mm)MAE (mm)
25/07/20170.800.040.030.870.030.020.930.030.020.940.030.02
07/09/20170.780.130.070.740.150.080.580.220.130.650.210.12
07/11/20170.950.890.780.941.070.850.950.710.470.811.761.07
10/01/20180.861.140.720.871.010.680.781.841.070.751.711.04
11/01/20180.890.560.430.820.600.410.930.480.320.561.040.59
12/01/20180.040.090.070.350.060.050.830.040.020.280.060.05
16/01/20180.350.860.480.670.470.350.490.760.350.710.430.28
17/01/20180.540.030.020.250.030.030.810.020.010.820.010.01
17/01/20180.850.170.120.780.090.070.770.130.100.960.030.02
01/02/20180.510.110.110.470.080.060.740.060.040.810.040.03
03/02/20180.900.200.140.900.190.130.820.260.180.780.280.19
07/02/20180.930.250.210.730.420.290.940.240.150.890.260.19
13/02/20180.920.010.000.960.010.000.990.000.00-0.120.030.02
14/02/20180.880.060.050.910.050.030.870.040.010.910.040.02
18/02/2018-0.230.080.05-0.310.090.060.770.030.020.850.030.02
20/02/20180.580.340.22-0.160.420.290.910.180.110.870.170.11
02/03/20180.560.170.100.730.080.060.620.130.060.590.110.05
03/03/20180.760.350.220.830.200.090.800.350.250.700.300.20
09/04/20180.540.190.140.730.200.170.840.260.210.830.280.23
17/04/20180.850.130.080.990.030.021.000.020.020.960.070.04
03/05/20180.930.110.070.660.240.130.960.080.050.950.090.07
04/05/2018-0.050.010.01-0.210.030.020.180.010.000.090.0250.019
23/05/20180.910.490.420.830.520.370.121.541.000.380.910.63
05/10/20180.220.060.040.350.090.050.830.050.030.750.100.07
07/11/20180.681.160.850.471.641.170.612.191.330.652.191.25
MEAN0.640.300.220.610.310.220.760.390.240.690.410.25
Table 3. The p-values of the multiple regression analysis.
Dependent VariableIndependent Variablep-Value (SWMM-GR1)p-Value (SWMM-GR2)p-Value (NASH-GR1)p-Value (NASH-GR2)
RMSEd9.0 × 10−31.6 × 10−13.0 × 10−41.2 × 10⁻²
C3.5 × 10−52.2 × 10−24.2 × 10−62.0 × 10⁻³
I4.6 × 10−15.3 × 10−14.3 × 10−28.3 × 10⁻¹
MAEd4.4 × 10−22.0 × 10−12.3 × 10−41.4 × 10⁻³
C1.6 × 10−34.5 × 10−23.8 × 10−67.2 × 10⁻⁵
I6.6 × 10−14.1 × 10−16.7 × 10−28.5 × 10⁻¹
Publisher†s Note: MDPI stays neutral with regard to jurisdictional claims in published maps and institutional affiliations.

