1. Introduction
The monitoring of water level in natural and built systems like sewer systems, storm water, flood control monitoring and tide level variations is one of the first steps towards managing and operating hydraulic infrastructure. One important step for automatic monitoring networks is to guarantee the quality of the measurements. Several efforts for test standardization, such as those developed by the Quality Assurance of Real-Time Ocean Data and others [
1,
2] are used today. But this data qualification depends firstly on the equipment installed on the field. Several types of water level sensors are currently available in the market, e.g., buoy and counterweight, piezoelectric, radar and bubble sensors. Each of these equipment type has technical and cost benefit features, as well as recommendations for use [
3,
4,
5]. A very common water level sensor is the piezoelectric sensor, also known as vented pressure sensor. This sensor measures the difference in the water column pressure, including atmospheric pressure’s influence. The total pressure difference is converted in a signal varying from 4 to 20 mA, proportional to the water column above the sensor [
6].
One aspect not always acknowledged among different level sensors types is the equipment accuracy, which may vary in a 10 meter range from ±2 to ±50 mm. In fact, accuracy difference is not a problem provided that the user is aware about it and chooses the appropriate sensor for the intended use. Moreover, this kind of sensor must be submerged below the lowest expected level and locked on a known position in a way that it is possible to reallocate it in at the same position after moving it for maintenance or other purposes. It is common that piezoelectric sensors work submerged in harsh waters due to the presence of solid particles that can enter the sensor, biological fouling over the sensor surface or saltwater oxidation. Although subject to these harsh environments, it is very important that the sensor is working properly during extreme events.
In developing countries, the cost of equipment such as piezoelectric sensors are significant, representing around 35% to 40% of the complete monitoring system solution. In this context, any action to preserve and expand equipment uptime makes a significant difference in maintenance costs of an automatic monitoring network. The average price of a professional piezoelectric sensor in Brazil is around 2,000 EUR, with some variation depending on its specifications. Simpler sensors start at 1000 EUR, and prices rise for professional, imported ones, that cost near 2500 EUR. This work presents the results of a simple methodology used to protect the sensors for a long-time span operation. At the same time, we wanted to maintain the quality and reliability of water level measurements.
2. Materials and Methods
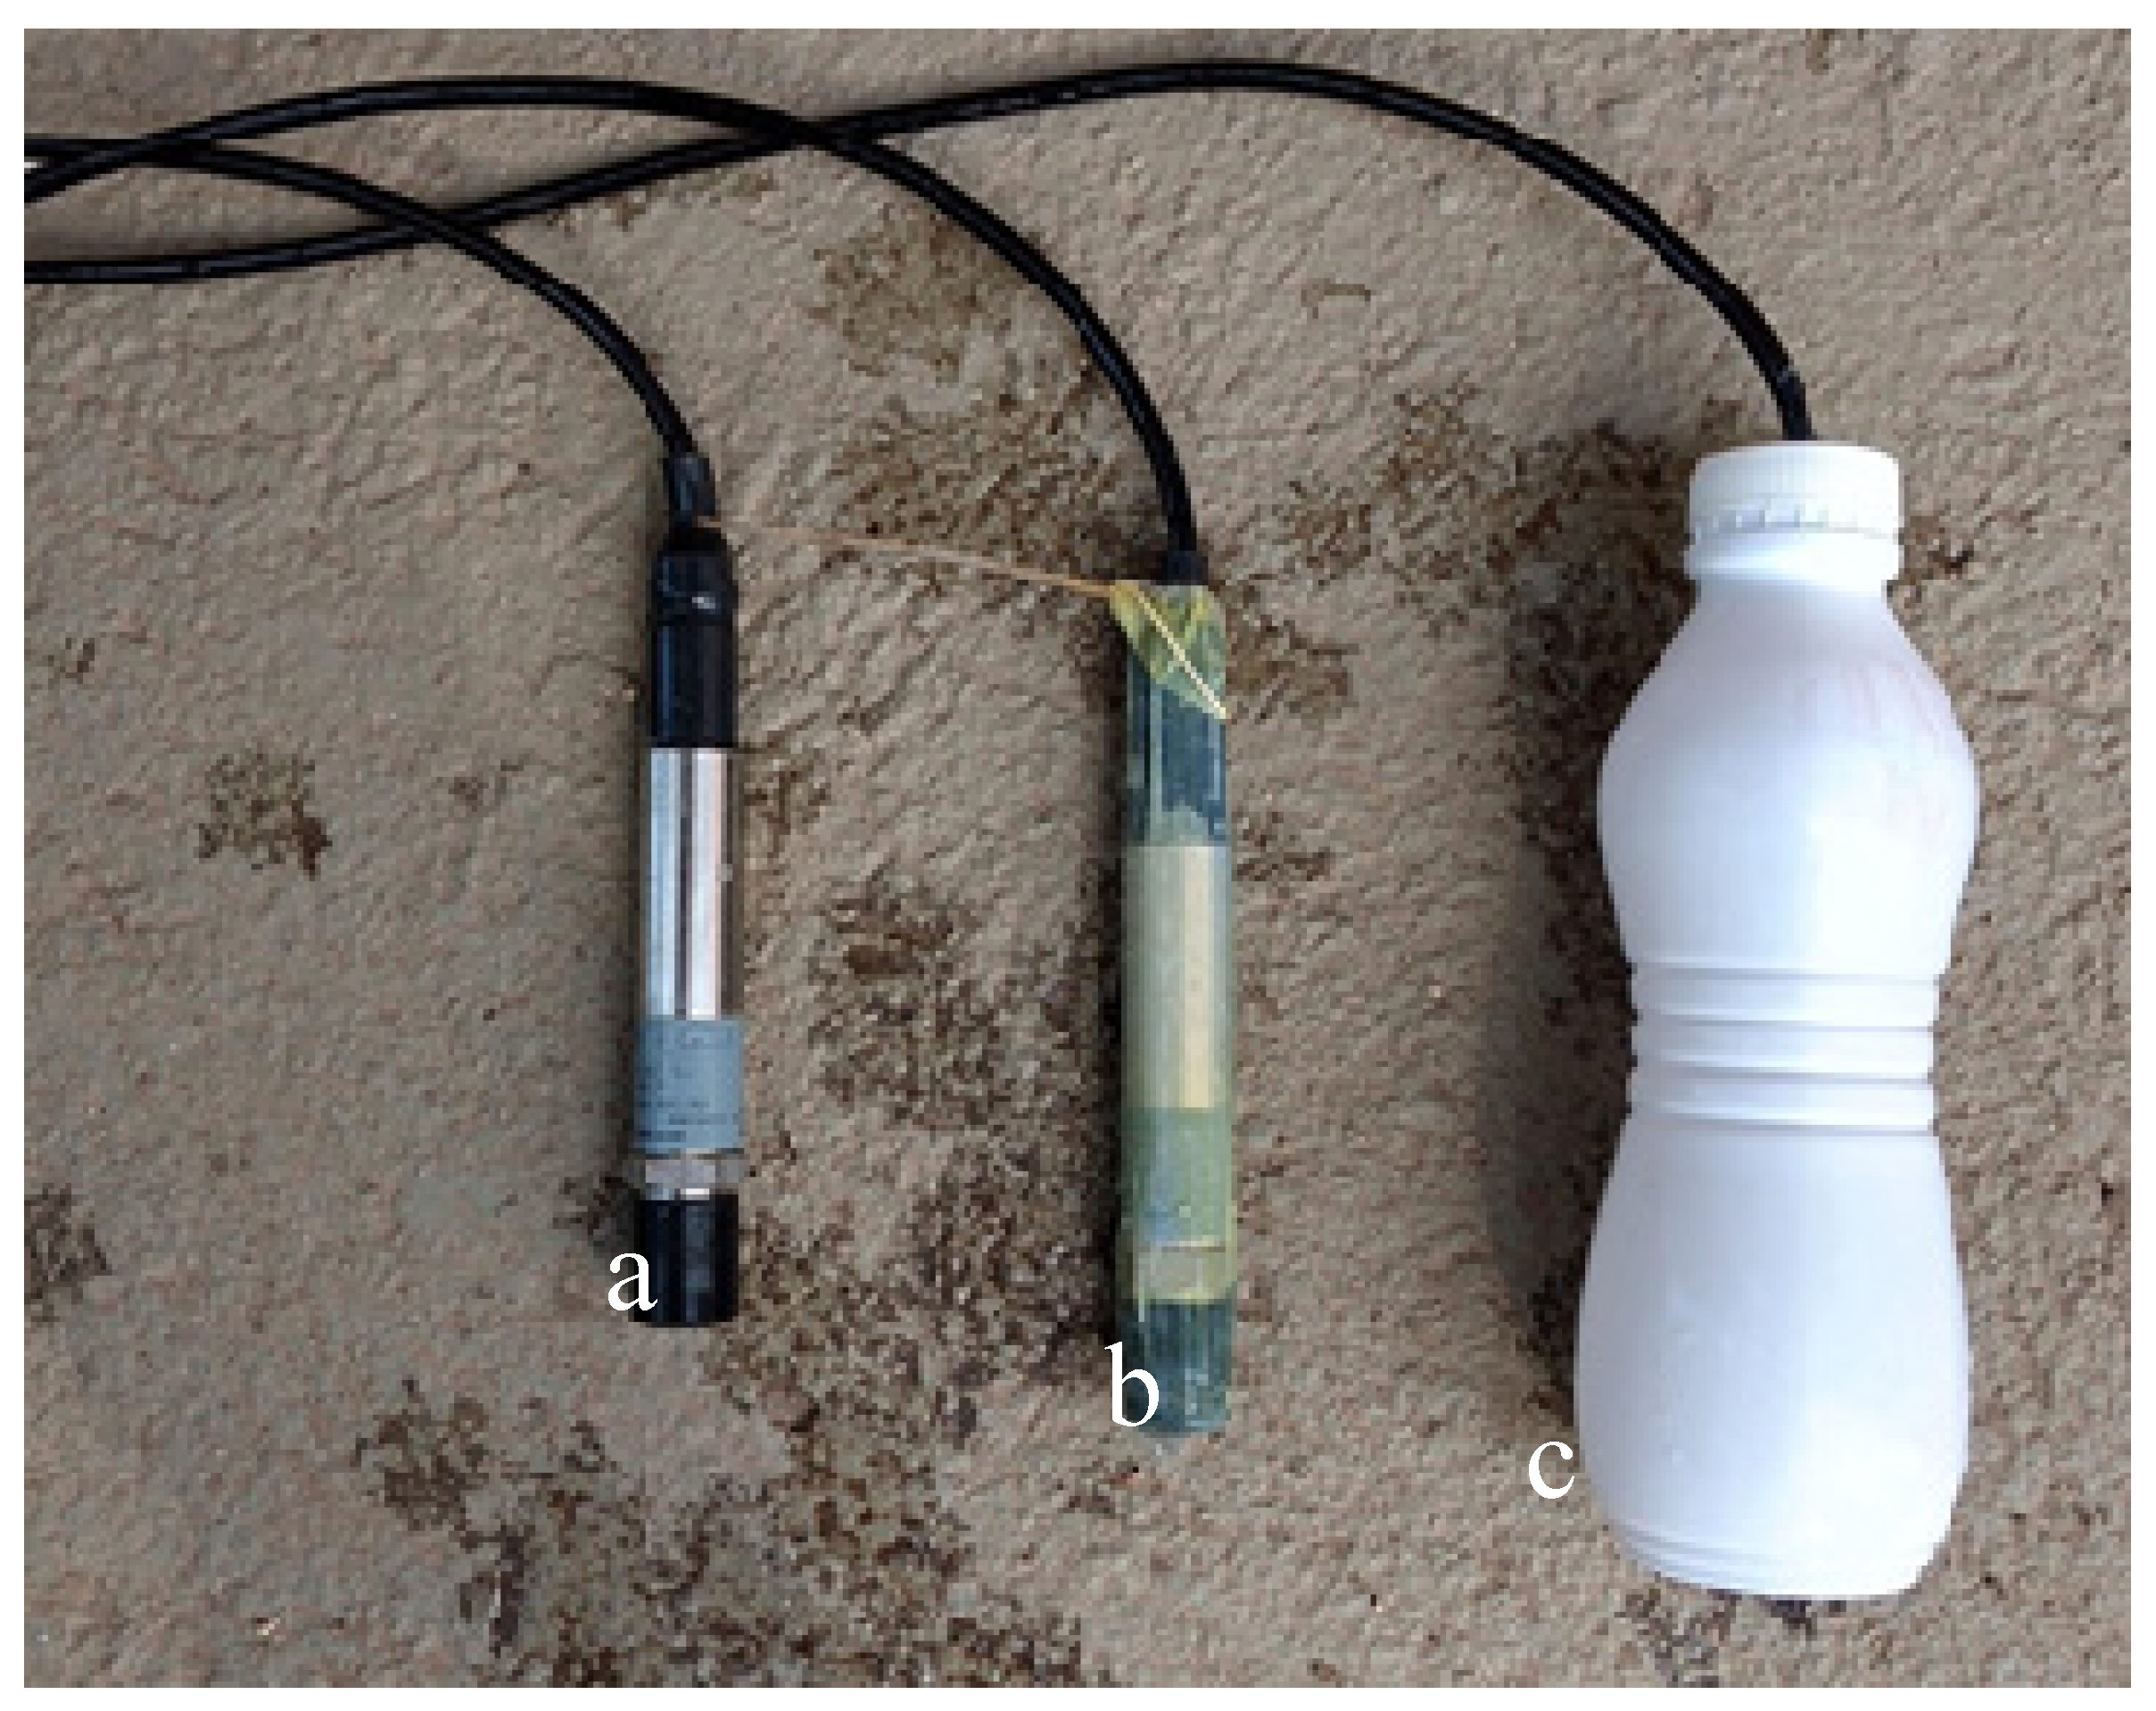
The equipment used in this study consists of typical piezoelectric sensors, as presented in
Figure 1. The sensors are denominated as (a) a bare piezoelectric sensor (BaPS) where the sensor is used without any kind of protection; (b) a latex-protected piezoelectric sensor (LaPS) where the sensor was covered by a condom filled with just enough tap water to eliminate air; and c) a bottle-protected piezoelectric sensor (BoPS), where the sensor was introduced in a thin flexible plastic bottle filled with tap water.
Water column used in the experiment was obtained using a PVC water pipe, 330 cm long and 150 mm in diameter (
Figure 2). The image is rotated 90° due to its elongated format. The experiment started in June 2018 and main tests were two weeks long. After that, the sensors were kept inside the water pipe for over 10 months, until April 2019.
The experimental setup was completed by a datalogger, where the readings and averaging protocols were defined, and a 12-V battery for power supply. The protocol used in the datalogger was an average of one-minute readings at a 1-Hz sampling rate. Over 20,000 readings were recorded during the tests, but not all the data were used. Four main tests were run with the sensors (
Table 1).
The power source test (PWST) was used to check the influence of the power source on the readings. The test objective was to check the stability of the sensors connected to either (a) 12-V battery, and (b) 18-V power supply connected to the power grid. While the recommendation of the manufacturer [
6] is to use an 18 V power source, our data collection platforms (DCP) are operating for more than 10 years using 12 V batteries. During this test, sensors were submerged into a 100-cm water column and were connected to a 12-V battery power source. In the second stage, the same sensors at the same position were connected to an 18-V power source.
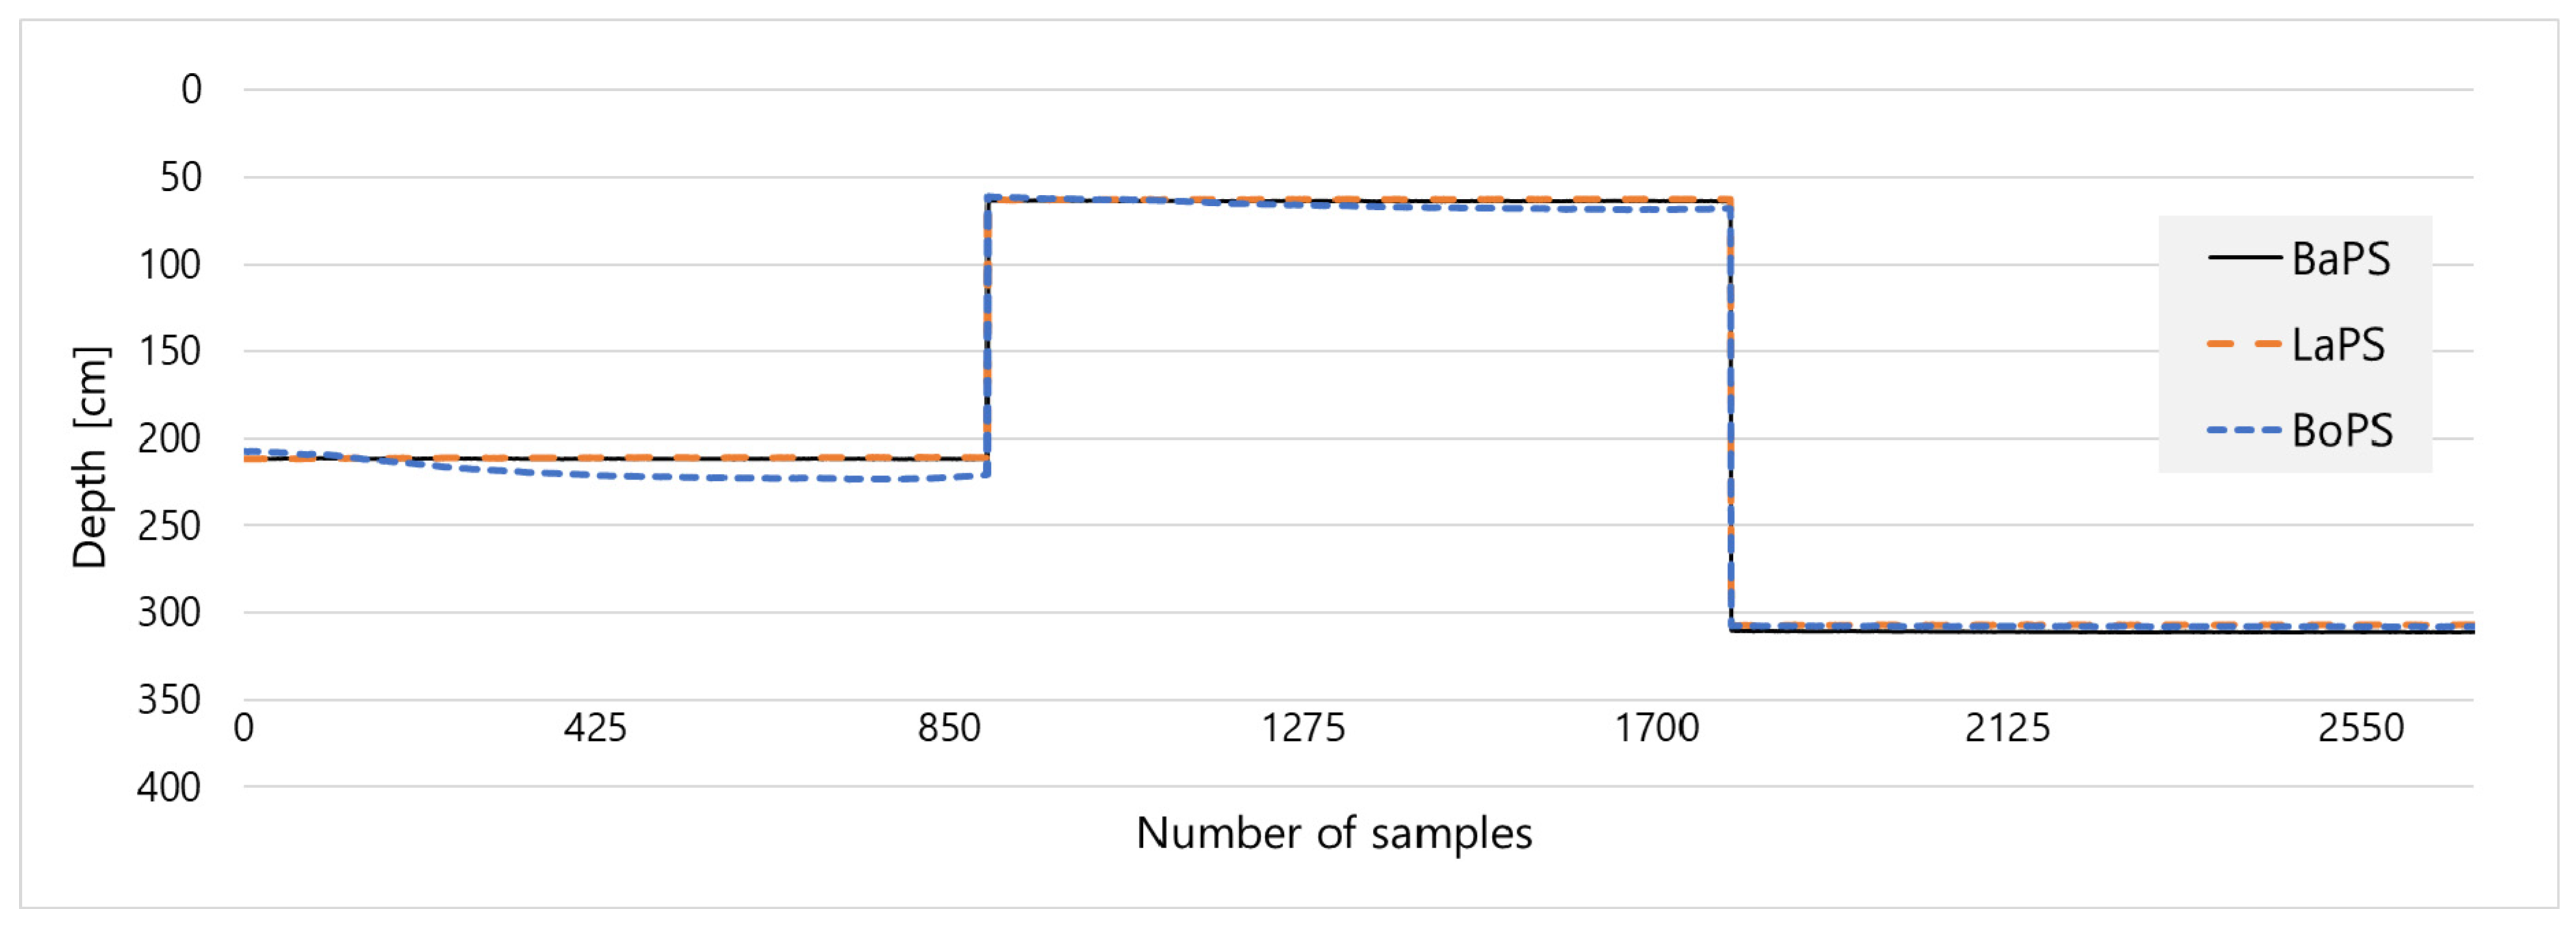
The second test, defined as a long time stability test (LTST), aimed to check the stability of the readings while the three sensors were kept together at three different depths (approximately 210, 60 and 310 cm) for about 15 h in each position. During this test, only a 12-V battery power source was used. Since starting readings of each sensor were not equal, offset values were added to each sensor. This way all the sensors were measuring the same value at the beginning of the experiment.
The third test, defined as rapid variation stability test (RVST), was designed to vary the depth of the sensors 50 cm each time in a relatively short interval of time to check the different sensor protection reproducibility response. The time series obtained in the three first tests where compared using descriptive statistics.
Finally, a long-term resistance test (LTRT) was performed, when all the sensors were left inside the PVC water pipe for additional 10 months. This test aimed to check if the materials would resist and keep its integrity while submerged for a long time.
3. Results and Discussion
As mentioned above, in the PWST, sensors were submerged in a 100-cm water column and, in the first stage, connected to a 12-V battery power source. In the second stage, the sensors were connected to an 18-V power source. The test results are summarized in
Table 2. The average absolute value differences between the sensors varied from 97.8 to 100.7 cm. We attribute these differences in the results to the starting position of the sensors that were not standardized for this test. According to the equipment manual, our test sensors present an accuracy specified as 0.5% of full scale (% FS), resulting in an expected accuracy of ±50 mm in our first test (PWST). During the test, the largest amplitude observed (over 14,000 readings) for all the sensors was 19 mm and a standard deviation of ±4 mm. Moreover, all the values obtained are within the expected range, with an average standard deviation around ±2 mm, which can be considered excellent considering the expected accuracy of this sensor model. All sensors BaPS, LaPS and BoPS presented similar behavior on the PWST. When comparing the results from both 12- and 18-V power source tests, it is possible to identify that there are no significant differences for the obtained values since all values are between the accepted variance presented on the sensor manual. This shows that, although the sensor manufacture company recommendation is to use an 18-V power source, it is possible to use the sensors connected to a typical 12-V battery-powered DCP installation without accuracy loss.
Once it was identified that a 12 V battery was adequate to power the DCP, the second test, LTST, aimed to check the stability of the readings at three different depths. The sensors were submerged at a position near 210 cm, the offset was adjusted to start the measurements and a 15-h deployment started. Subsequently, the cables of the sensors were measured to lock them near a 60-cm water column during the additional 15 h, and finally, a new measurement of the cable length was locked at maximum depth, near a 310-cm water column, as show in
Figure 3.
BaPS is the testimony in our test, since the sensor was used as recommended by the manual. Results presented in
Figure 3 show that LaPS results are very close to BaPS measurements, with a maximum standard deviation of ±2 and ±3 mm, respectively. This is strong evidence that it is possible to use LaPS and obtain adequate level measurements. On the other hand, BoPS presented larger standard deviation for the 210- and 60-cm water column trials, with a value for standard deviation of ±52 and ±23 mm, respectively. Although these values are within the acceptable range of our sensor accuracy, BoPS results were inferior when compared to the other two sensors. This difference was caused, probably, due to the structure of the bottle being not flexible enough, associated with a possible leak in the cover where the sensor cable was inserted.
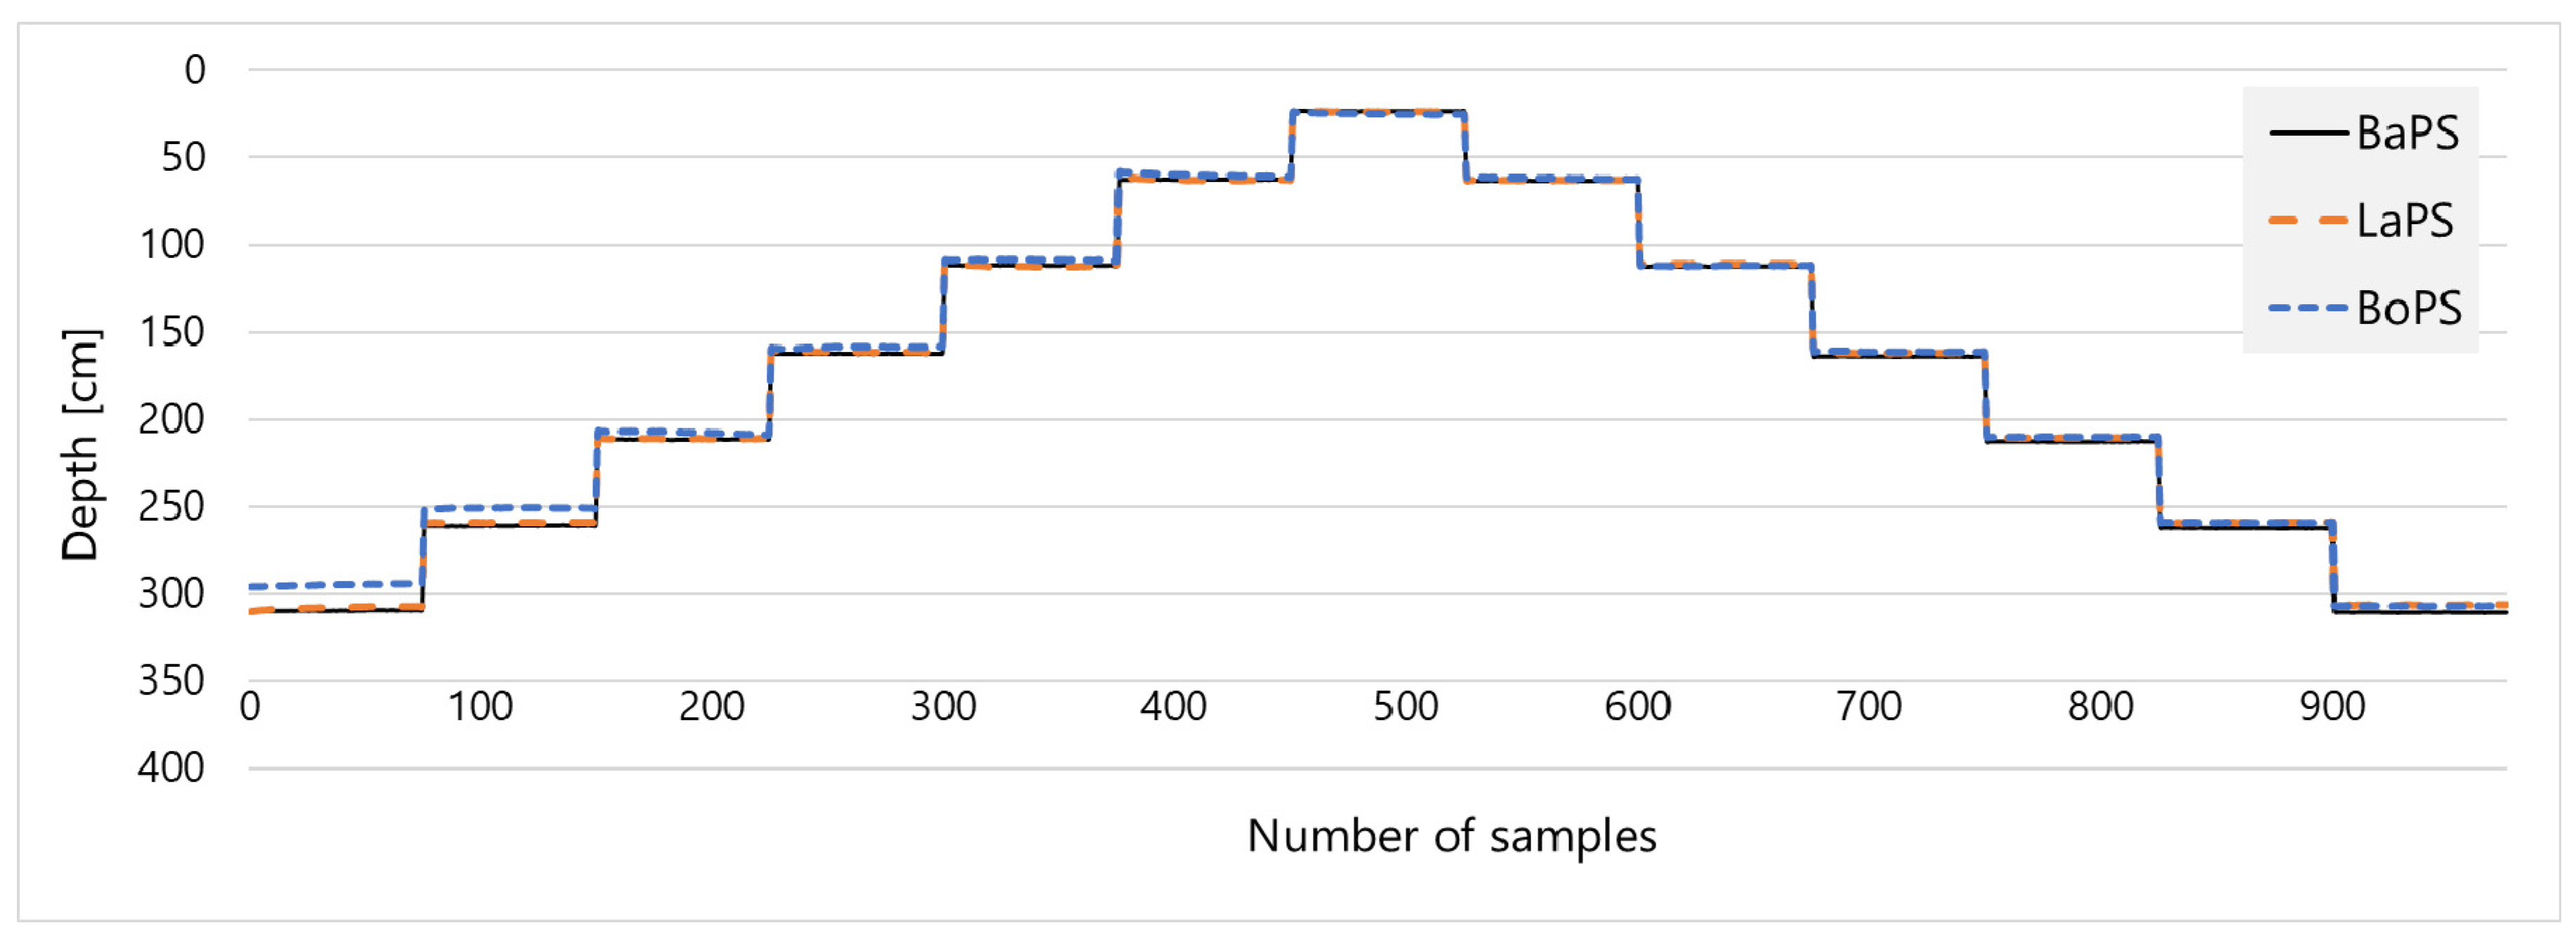
Our third test (RVST) was run in similar conditions as the LTST test. The positioning of the sensors, however, was accomplished by measuring the communication cable and tying it in the desired position. This protocol did not allow precise positioning of the sensors with a 50-cm variation. However, our intention here was to verify the stability of measurements. Thus, we were looking to guarantee that sensor position variation was the same for the three sensors. Third test (RVST) results are presented in
Figure 4.
RVTS test results showed that BaPS presented a constant standard deviation for all depths with a value of ± 1 mm in all the steps. Sensor LaPS, in its turn, presented similar results to BaPS, also presenting standard deviation values of ±1 mm, except for three steps where the standard deviation reached a maximum value of ±8, ±5 and ±6 mm for the 1st, 5th and 6th steps, respectively. Similar to the LTST test results, RVTS showed a larger variation for the BoPS measurements, with an average standard deviation of all measurements of ±3 mm. Nevertheless, none of the BoPS steps presented standard deviation above ±8 mm. This result indicates that BoPS, although stable, presented a higher fluctuation between measurements, which could cause problems to define an initial offset. The determination coefficient (R2) for the RVST considering BaPS vs. LaPS, and BaPS vs. BoPS resulted in 0.999 and 0.998, respectively.
Finally, LTRT aimed to check the endurance of the materials submerged in water for a longer period. This test was basically evaluated through visual and tactile verification. It is important to keep in mind that the environment inside the tube with water is not as aggressive as the environments with sediments or wastewater present in the real world. The plastic bottle (milk bottle) and the latex bag (condom) were left inside the PVC pipe for 10 months and they maintained their integrity while submerged for the time of the test. Considering that preventive maintenance on DCP is recommended at intervals of 3 months, this is strong evidence that it is suitable to use these materials to protect the sensors.
4. Conclusions
Our study shows the viability of using low-cost materials to protect piezoelectric sensors. The results corroborate our hypothesis that low-cost materials may be suitable to use as protection for the sensors. Specifically, LaPS showed virtually no significant interference on their measurements as compared to BaPS. On the other hand, BoPS interferences are higher and near an impeditive limit to be used. Simple actions, costing less than 2 EUR, like the ones presented here, can extend the lifecycle of expensive sensors, worth over 2000 EUR, exposed to harsh environments without impairing its operation and reliability. Further tests should be developed in real operation situation to identify the resistance and lifecycle of the LaPS. Moreover, tests with higher precision piezoelectric sensors, with accuracy as high as 0.02% FS, should be performed using those protective materials and checked for interference on the measurements.


