Proceeding Paper

Surface and Groundwater Quality in South African Area—Analysis of the Most Critical Pollutants for Drinking Purposes †

Department of Engineering, University of Ferrara, Via Saragat 1, 44122 Ferrara, Italy
*
Author to whom correspondence should be addressed.
Presented at the 4th International Electronic Conference on Water Sciences, 13–29 November 2019; Available online: https://ecws-4.sciforum.net/.
Proceedings 2020, 48(1), 3; https://doi.org/10.3390/ECWS-4-06430
Published: 12 November 2019
(This article belongs to the Proceedings of The 4th International Electronic Conference on Water Sciences)

Abstract

:
According to a recent report by World Health Organization, the countries which still have limited access to water for drinking purposes are mainly those in the Sub-Saharan region. (Potential) water sources for drinking needs may contain different contaminants. In this context, the current study consists in an overview of the quality of surface water and groundwater in the Republic of South Africa (RSA) and Mozambique (MZ) and provides the variability ranges of the concentrations of the main pollutants in the two countries. Chemical and physical characteristics and concentrations of macropollutants, inorganic compounds (metals) and selected microorganisms were collected for surface water and groundwater and compared with the standards for drinking water set in the two countries. It was found that in surface water, microorganisms were always at very high concentrations. In addition, nickel (in RSA) and boron and chlorine (in MZ) were the most critical compounds. It emerged that in groundwater, arsenic, lead and chlorine (in RSA) and boron, sodium and chlorine (in MZ) were the main critical pollutants. Adequate treatments in the construction of new drinking water plants in rural areas should be selected on the basis of these most critical compounds and their observed variability over time.

1. Introduction

According to the recent World Health Organization (WHO) report, the countries which still have limited access to water for drinking purposes are mainly those in the Sub-Saharan region [1].
In cases of small rural communities, it may be very expensive to guarantee (including investment and operational and maintenance costs) safe water by means of decentralized small water works. Pollution of source water may be due to many causes, among them a continuous release of untreated wastewater (generated within the rural communities), land runoff and acid mine drainage.
This paper deals with the quality of surface and groundwater in rural areas in the Republic of South Africa (RSA) and Mozambique (MZ) and its variability along the year (mainly due to temperature variations, rainfall and consequent land runoff) in case of their withdrawal for drinking purposes. In order to evaluate how polluted these waters may be (expected), water quality standards for potable use adopted in RSA and MZ are provided.
The aims of this study are (i) to identify the most critical pollutants in surface and groundwater and relate them to their potential origin; and (ii) to show the importance of the need of interventions both in sanitation and potabilization fields. The first type of interventions will improve the quality of surface water bodies and groundwater, considered potential sources for drinking purposes for small communities in rural and peri-urban areas.

2. The Area under Study

The area under study refers to the RSA and MZ (1.2 × 10⁶ km2 and 8.0 × 10⁵ km2, respectively). In RSA, the current resident population is around 58.8 million of persons. According to statistical data referring to the last formal 2018 census, 80.1% are living in formal settlements, 13.1% in traditional settlements and 5% in informal housing (corresponding to 2,940,000 people) [2,3]. In Mozambique, the population, in 2017, was around 28 million of inhabitants [4], and 69% was living in rural areas [5].
The access to (safe) drinking water is limited in some regions of RSA and in most of MZ (Figure 1).
In particular, in Mozambique, the percentage of the rural population using limited or unimproved surface water for drinking water is 60%, and the remaining 40% uses an improved surface water. Safely managed water in these rural areas is not currently reported. In South Africa, the percentages are 19% and 81%, respectively.
According to the local South African regulation, the basic water services are defined in South Africa as 25 L/d per person [7] and according to the UNDP report, in Mozambique less than 10 L/d per person [8]. In these countries, the treatment of rural wastewater is generally absent or scarce. This practice leads to a deterioration of the quality of the local surface water and, due to percolation/infiltration, also of the groundwater. In addition, animal farms are not safely managed from an environmental viewpoint, and generally, zootechnical effluents are directly released into surface water bodies or directly spread on the soil [9].

2.1. Investigations Included in This Overview—Collected Parameters

The study collects quality data of surface water and groundwater in RSA and MZ from the literature. The selected parameters include macropollutants, inorganic chemicals and microorganisms in addition to physical parameters of the water. Their variability ranges are commented on and discussed in order to evaluate which should be the main problems in case the water is withdrawn for drinking purposes.
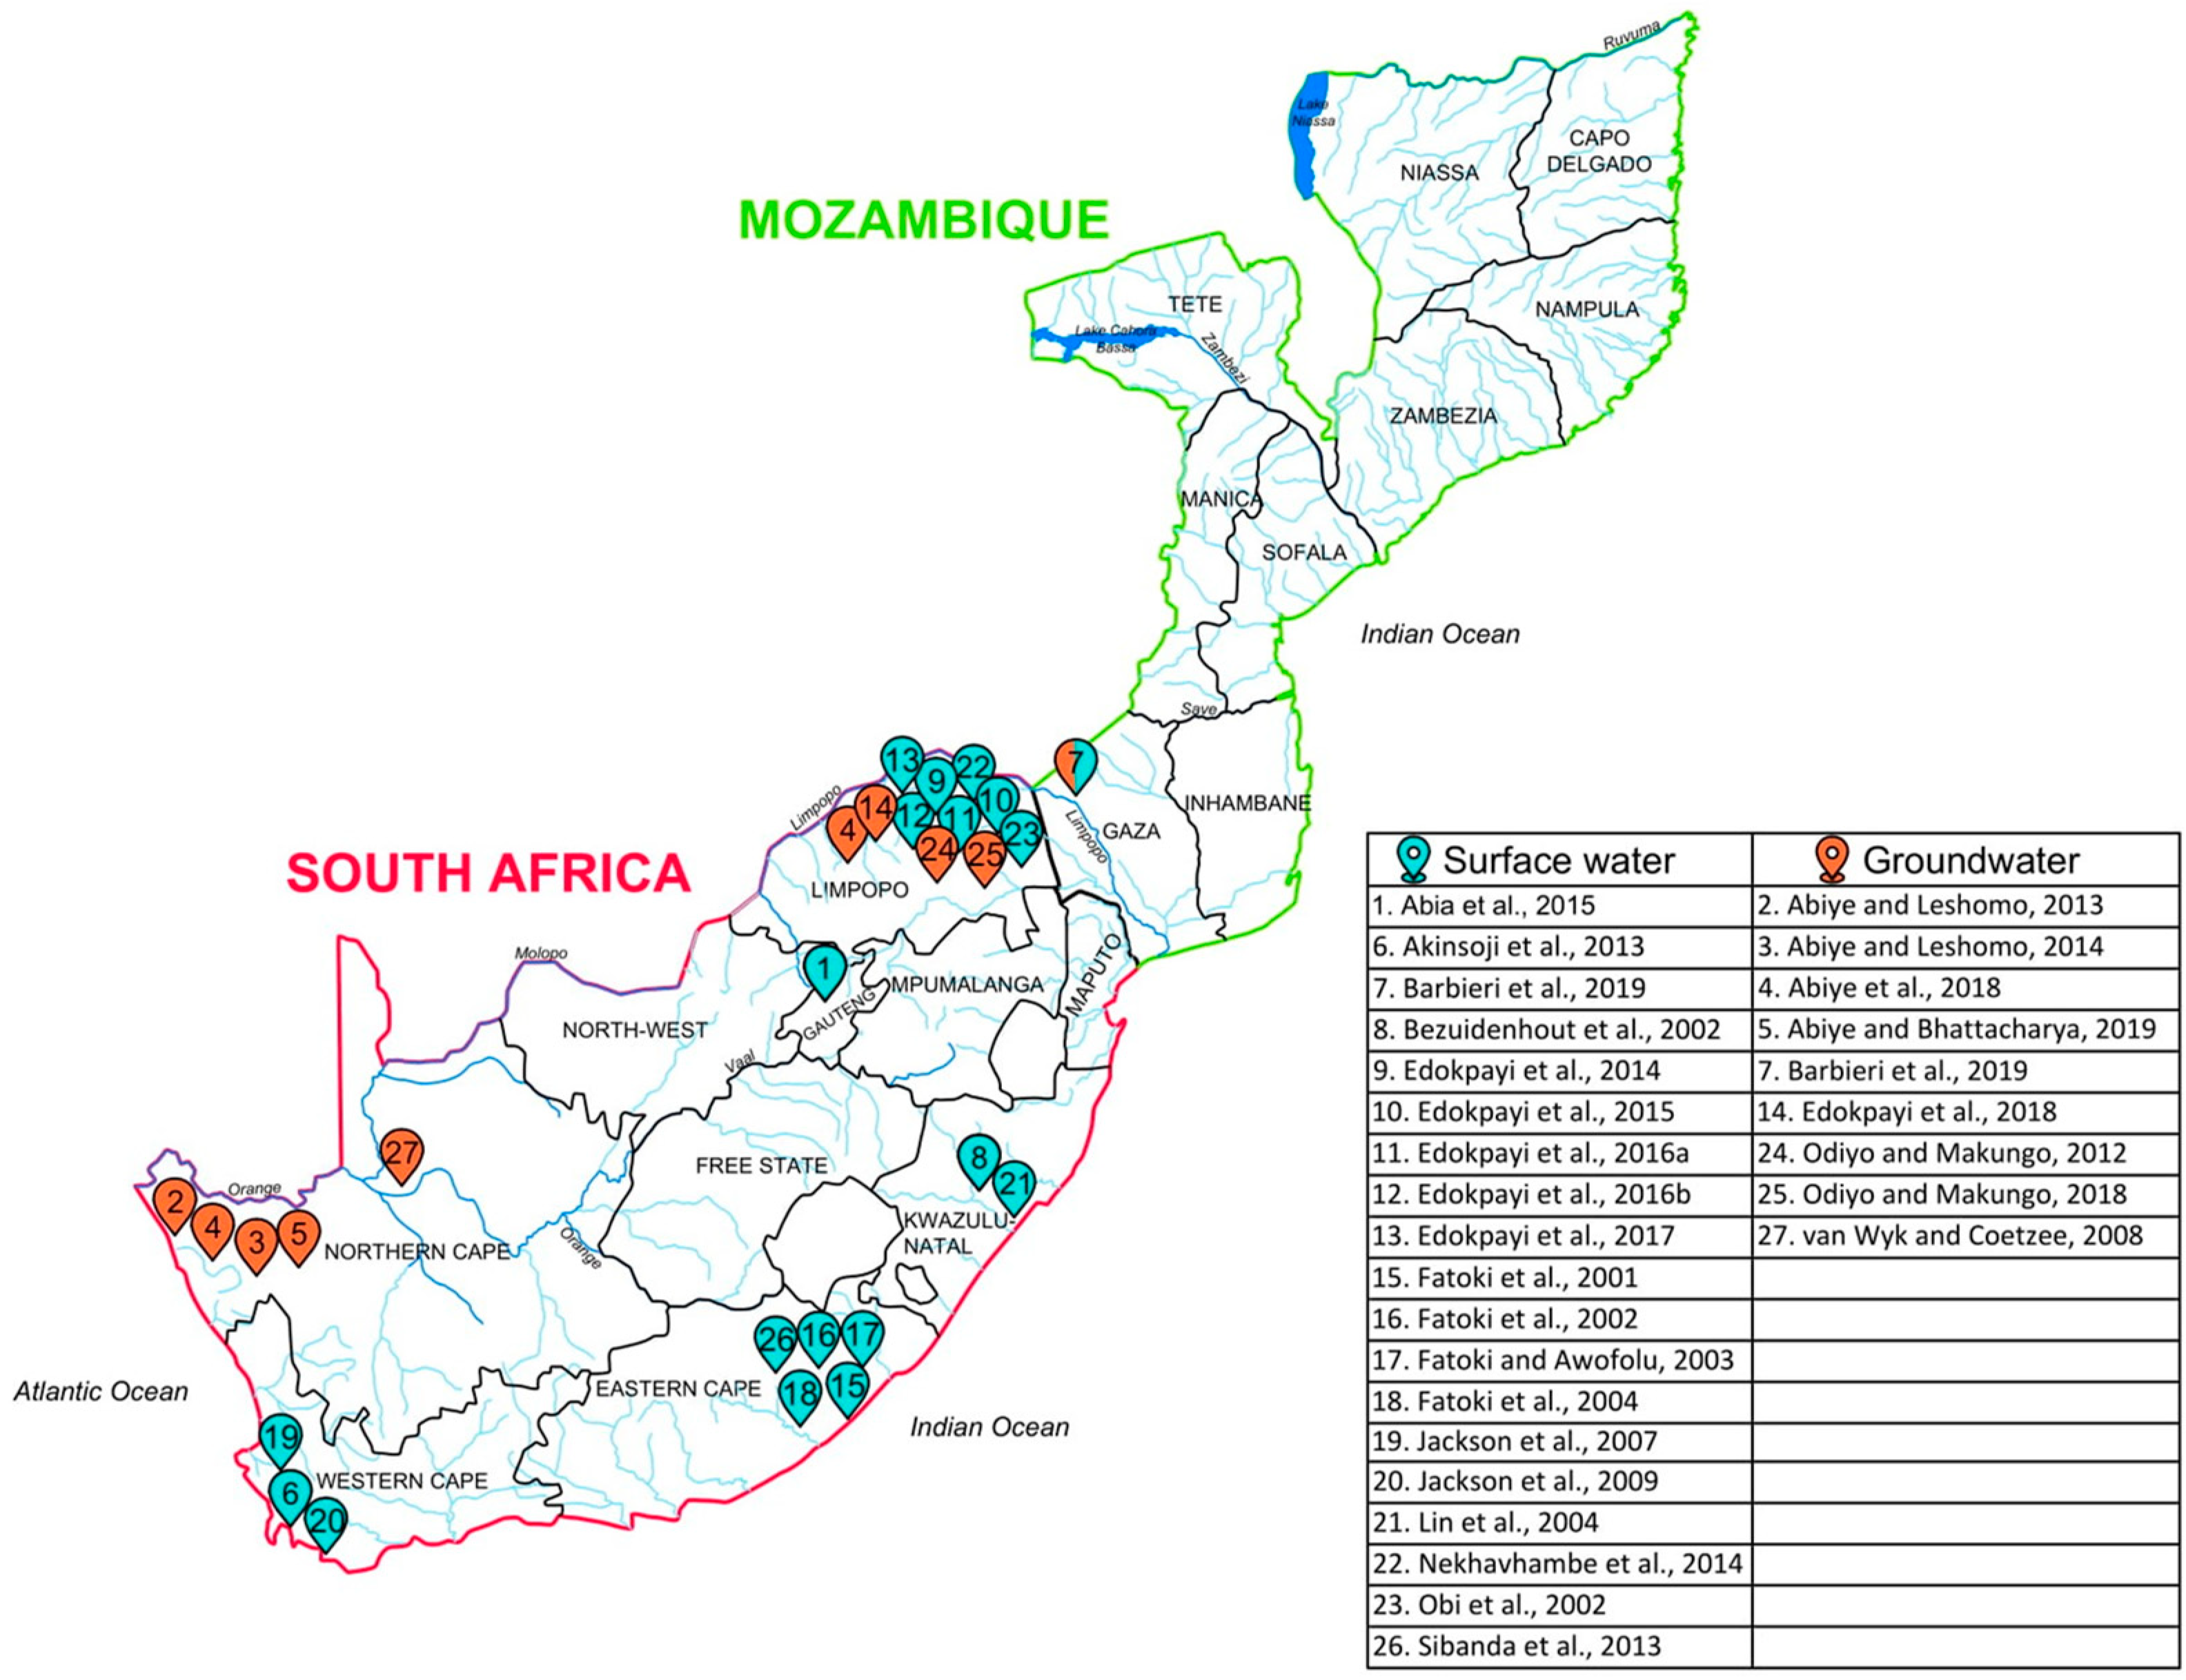
The map in Figure 2 reports the indicative place where the investigations included in this study were carried out, with the corresponding reference.

2.2. National Standards for Potable Use in South Africa and Mozambique

Table 1 reports the limits for the selected pollutants according to the Mozambique regulation (DM-180/2004 [10]) and South African law (SANS-241-1:2015 [11]). These values will be compared with the measured concentrations found in the two water sources (surface water and groundwater) in the area under study.
On the basis of the comparison, the selected parameters will be divided into six groups according to the criteria defined in Table 2 called Variability Range-Standards criteria.

3. Results

3.1. Surface Water Quality and Observed Variability of Concentrations

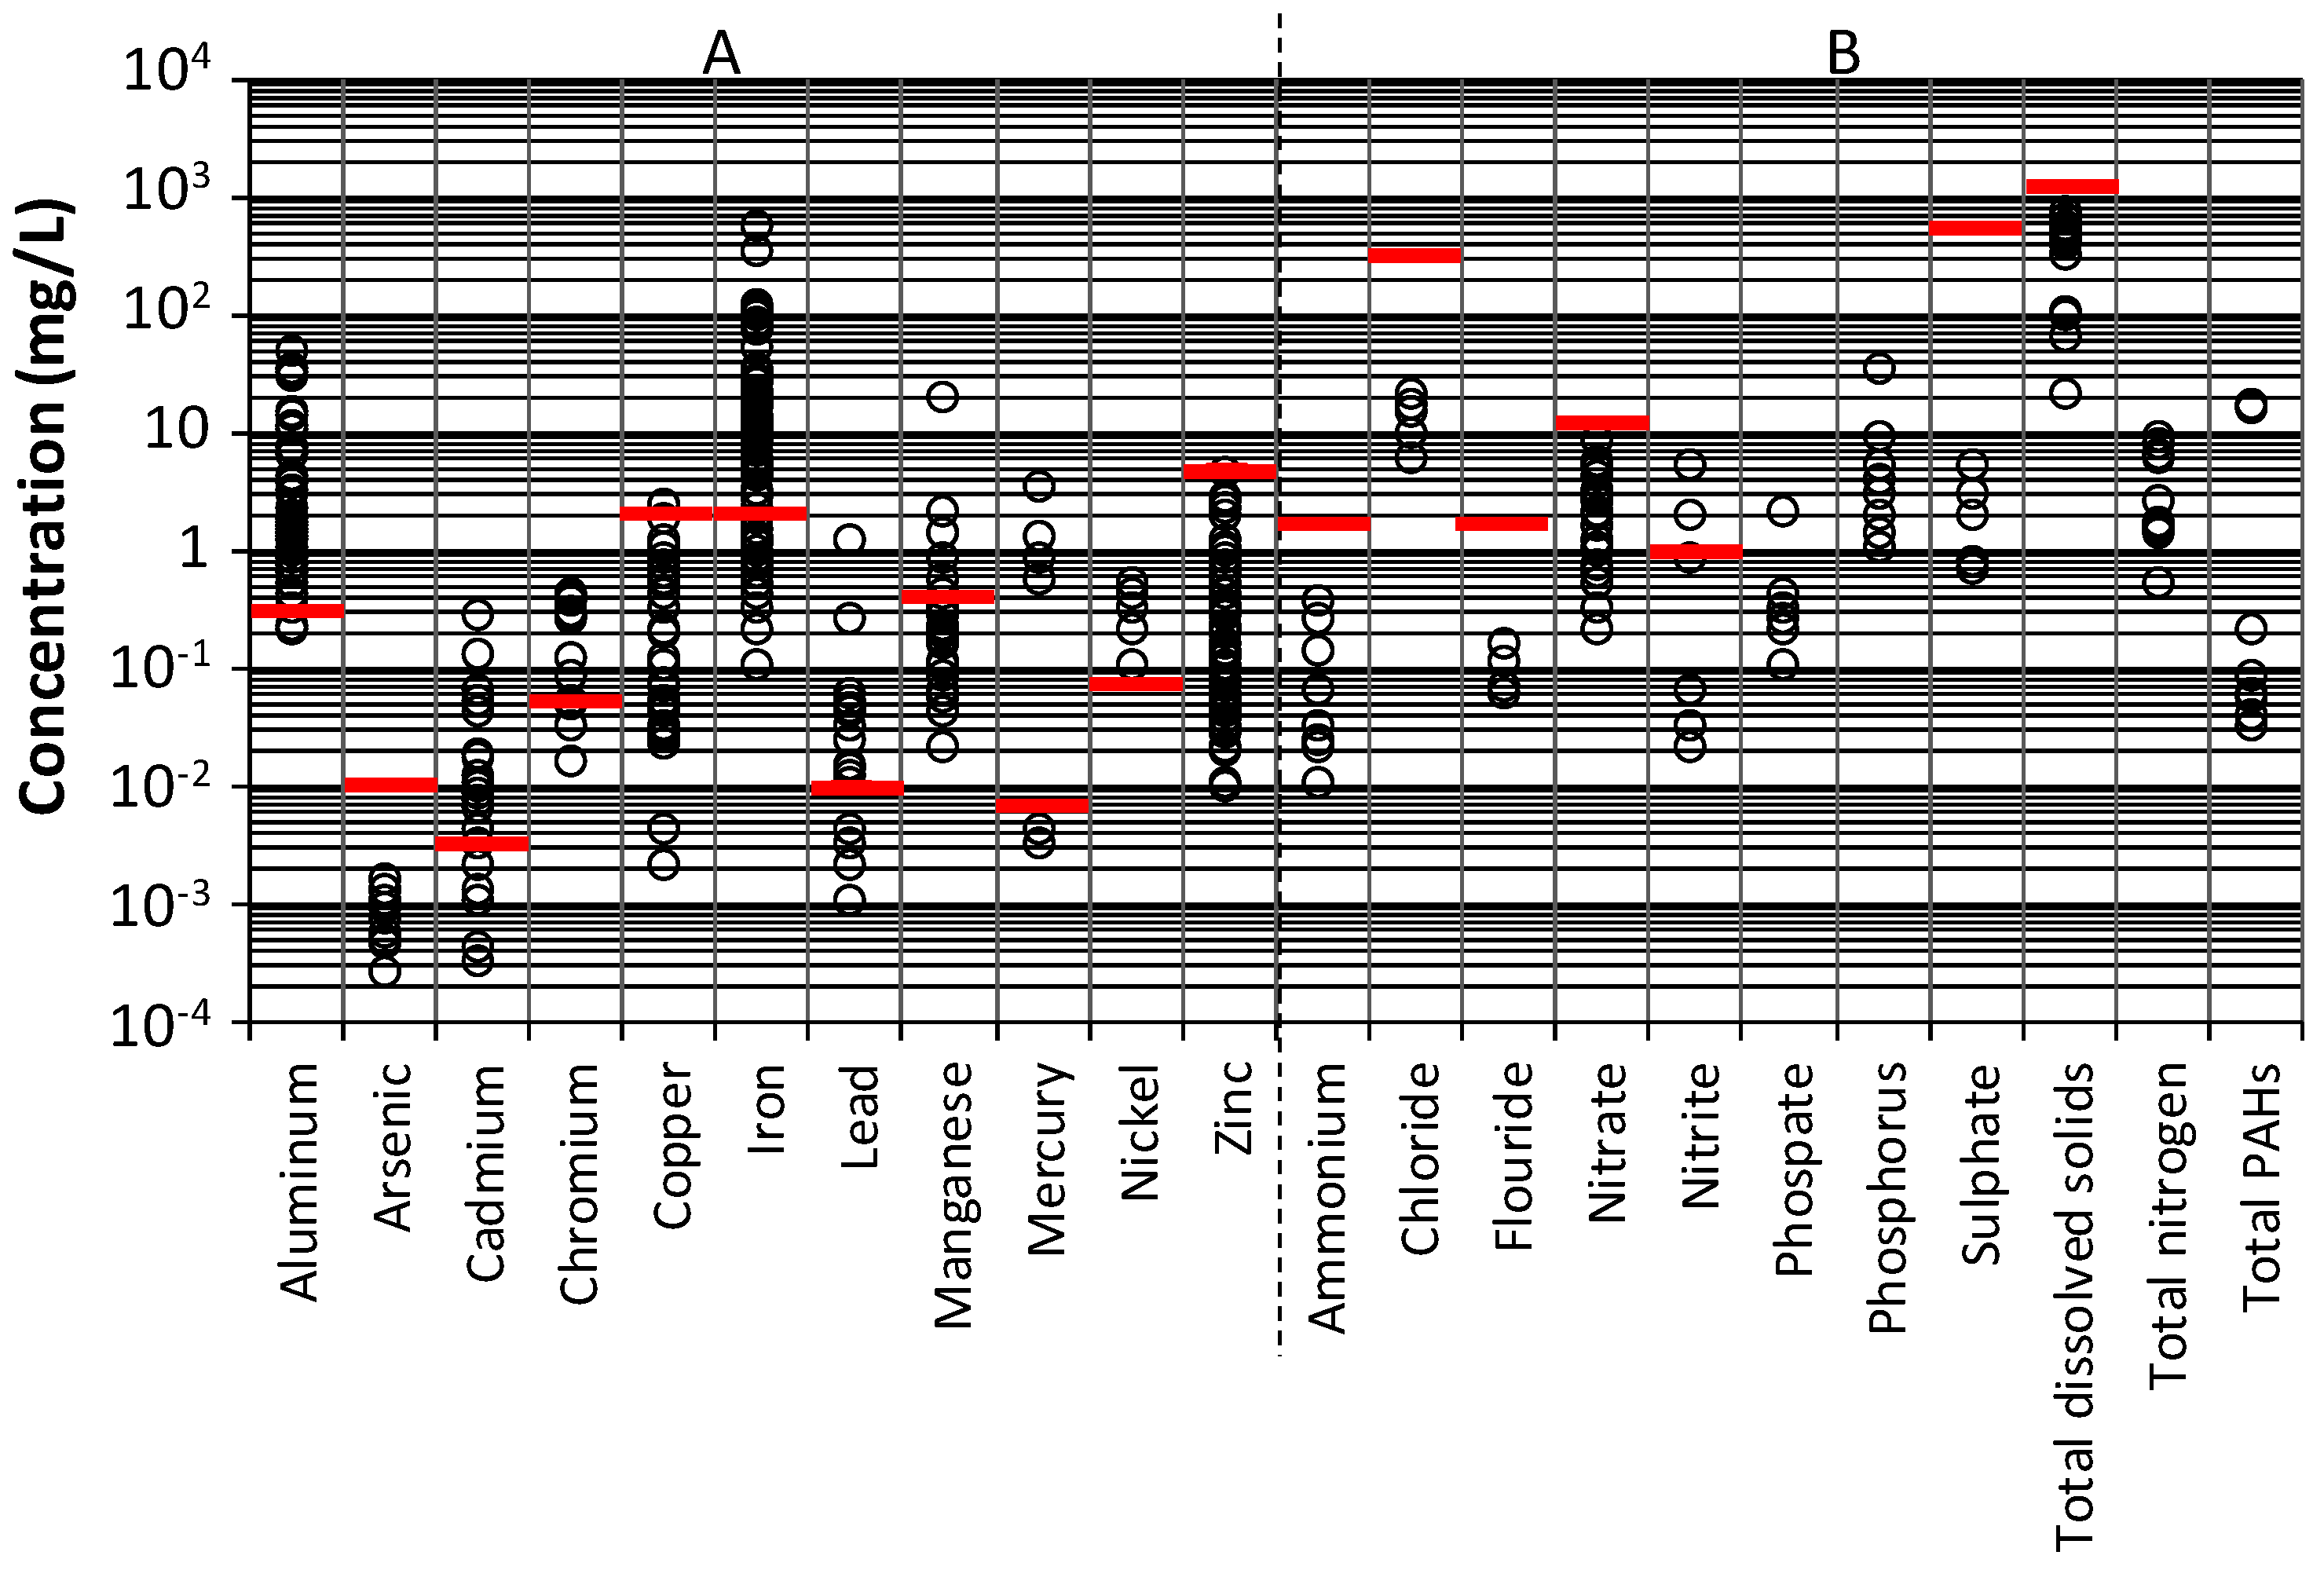
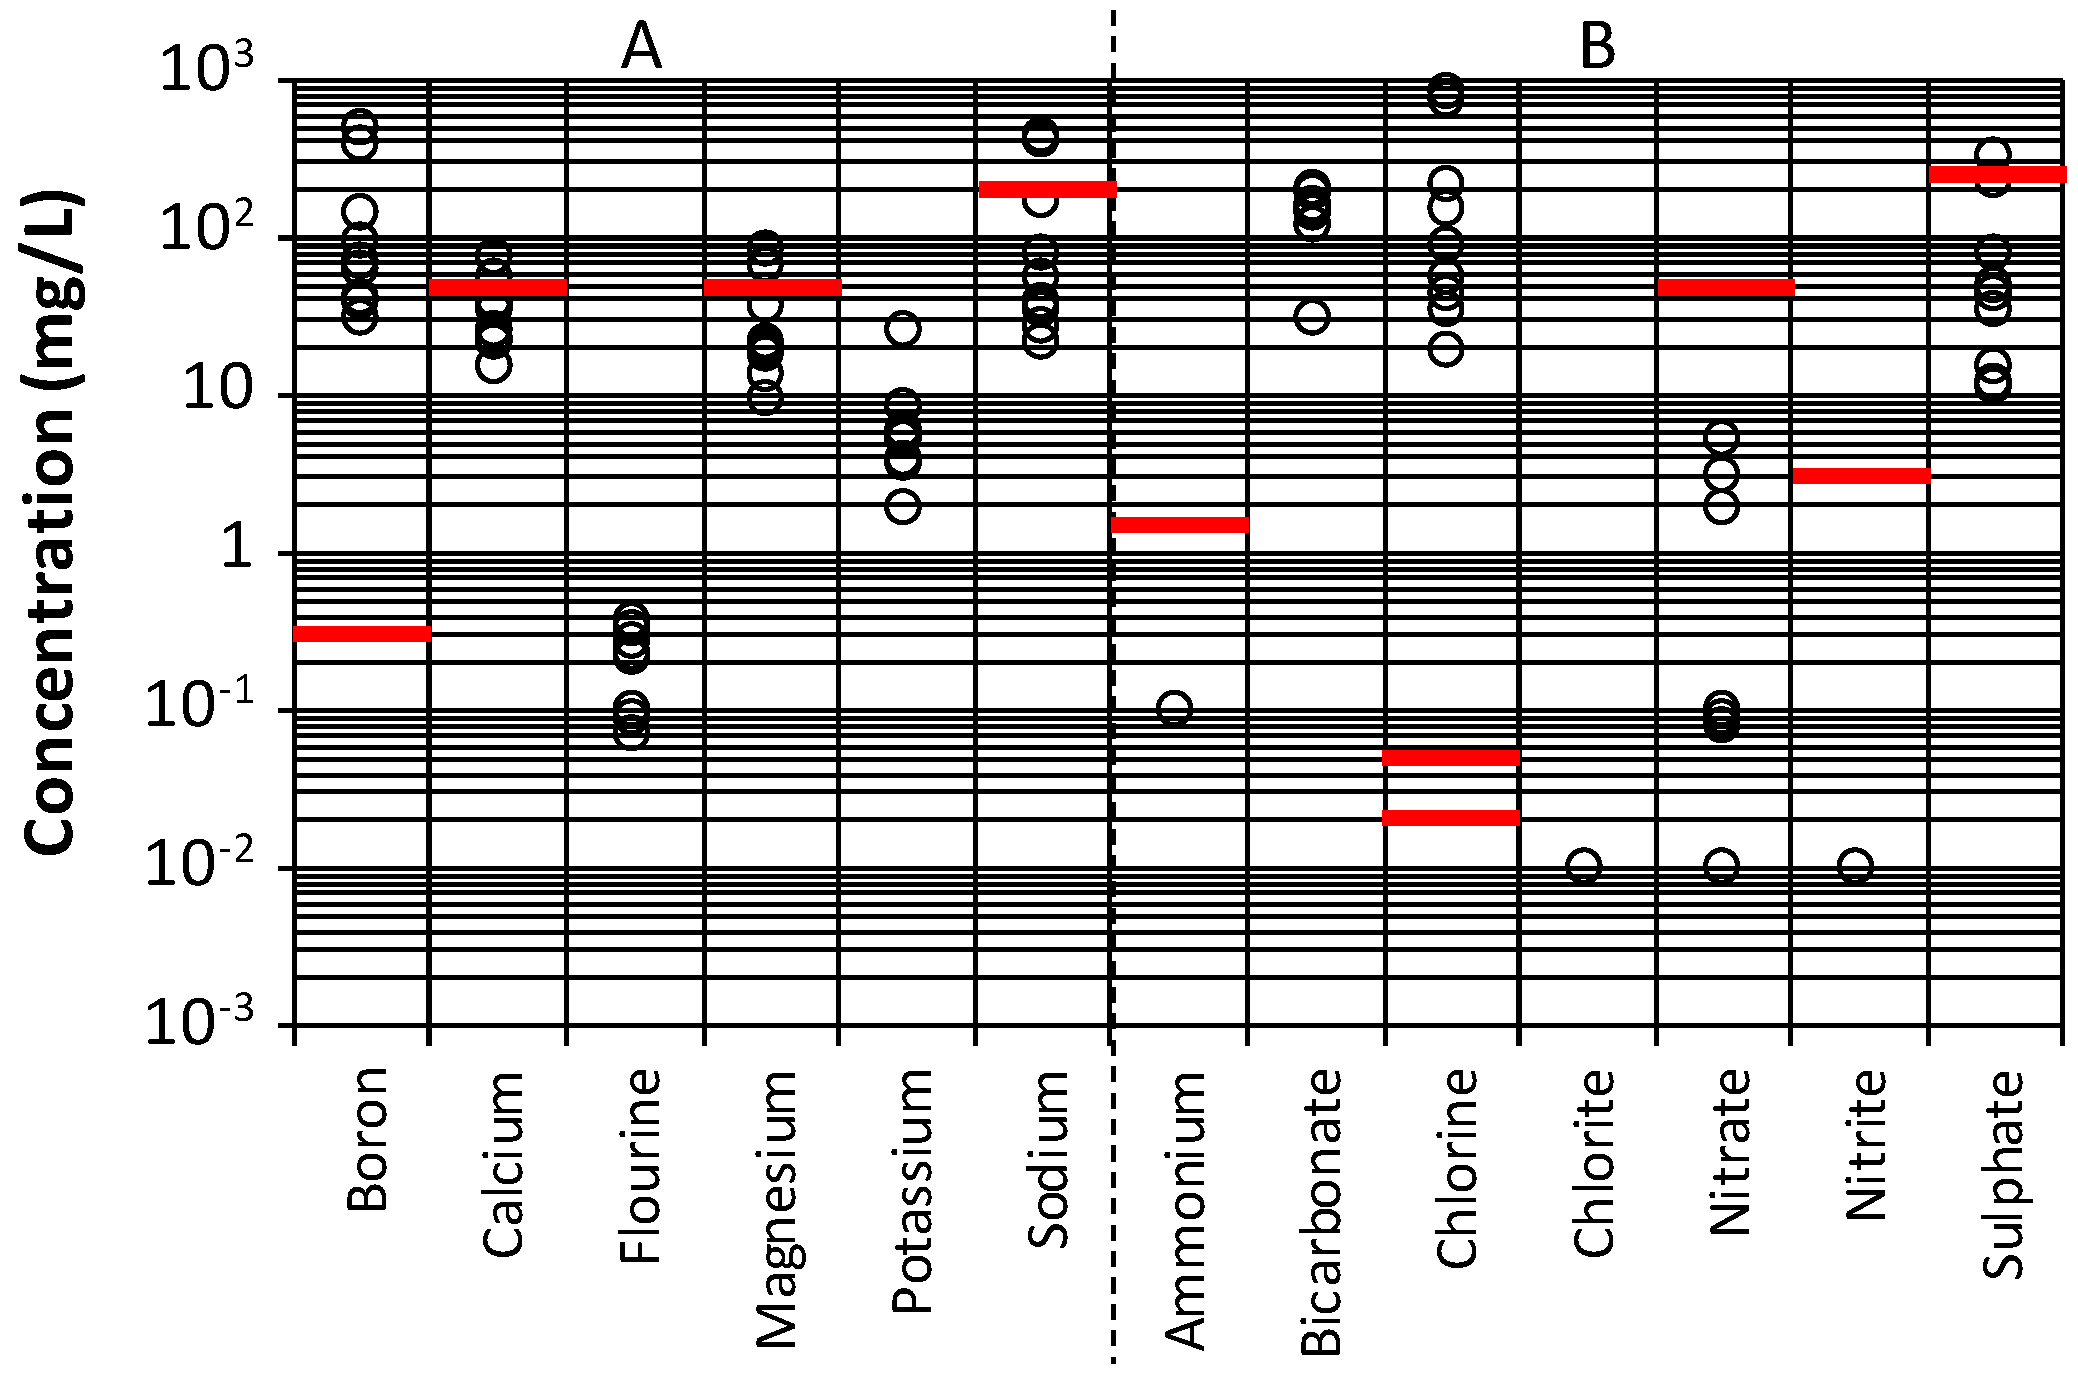
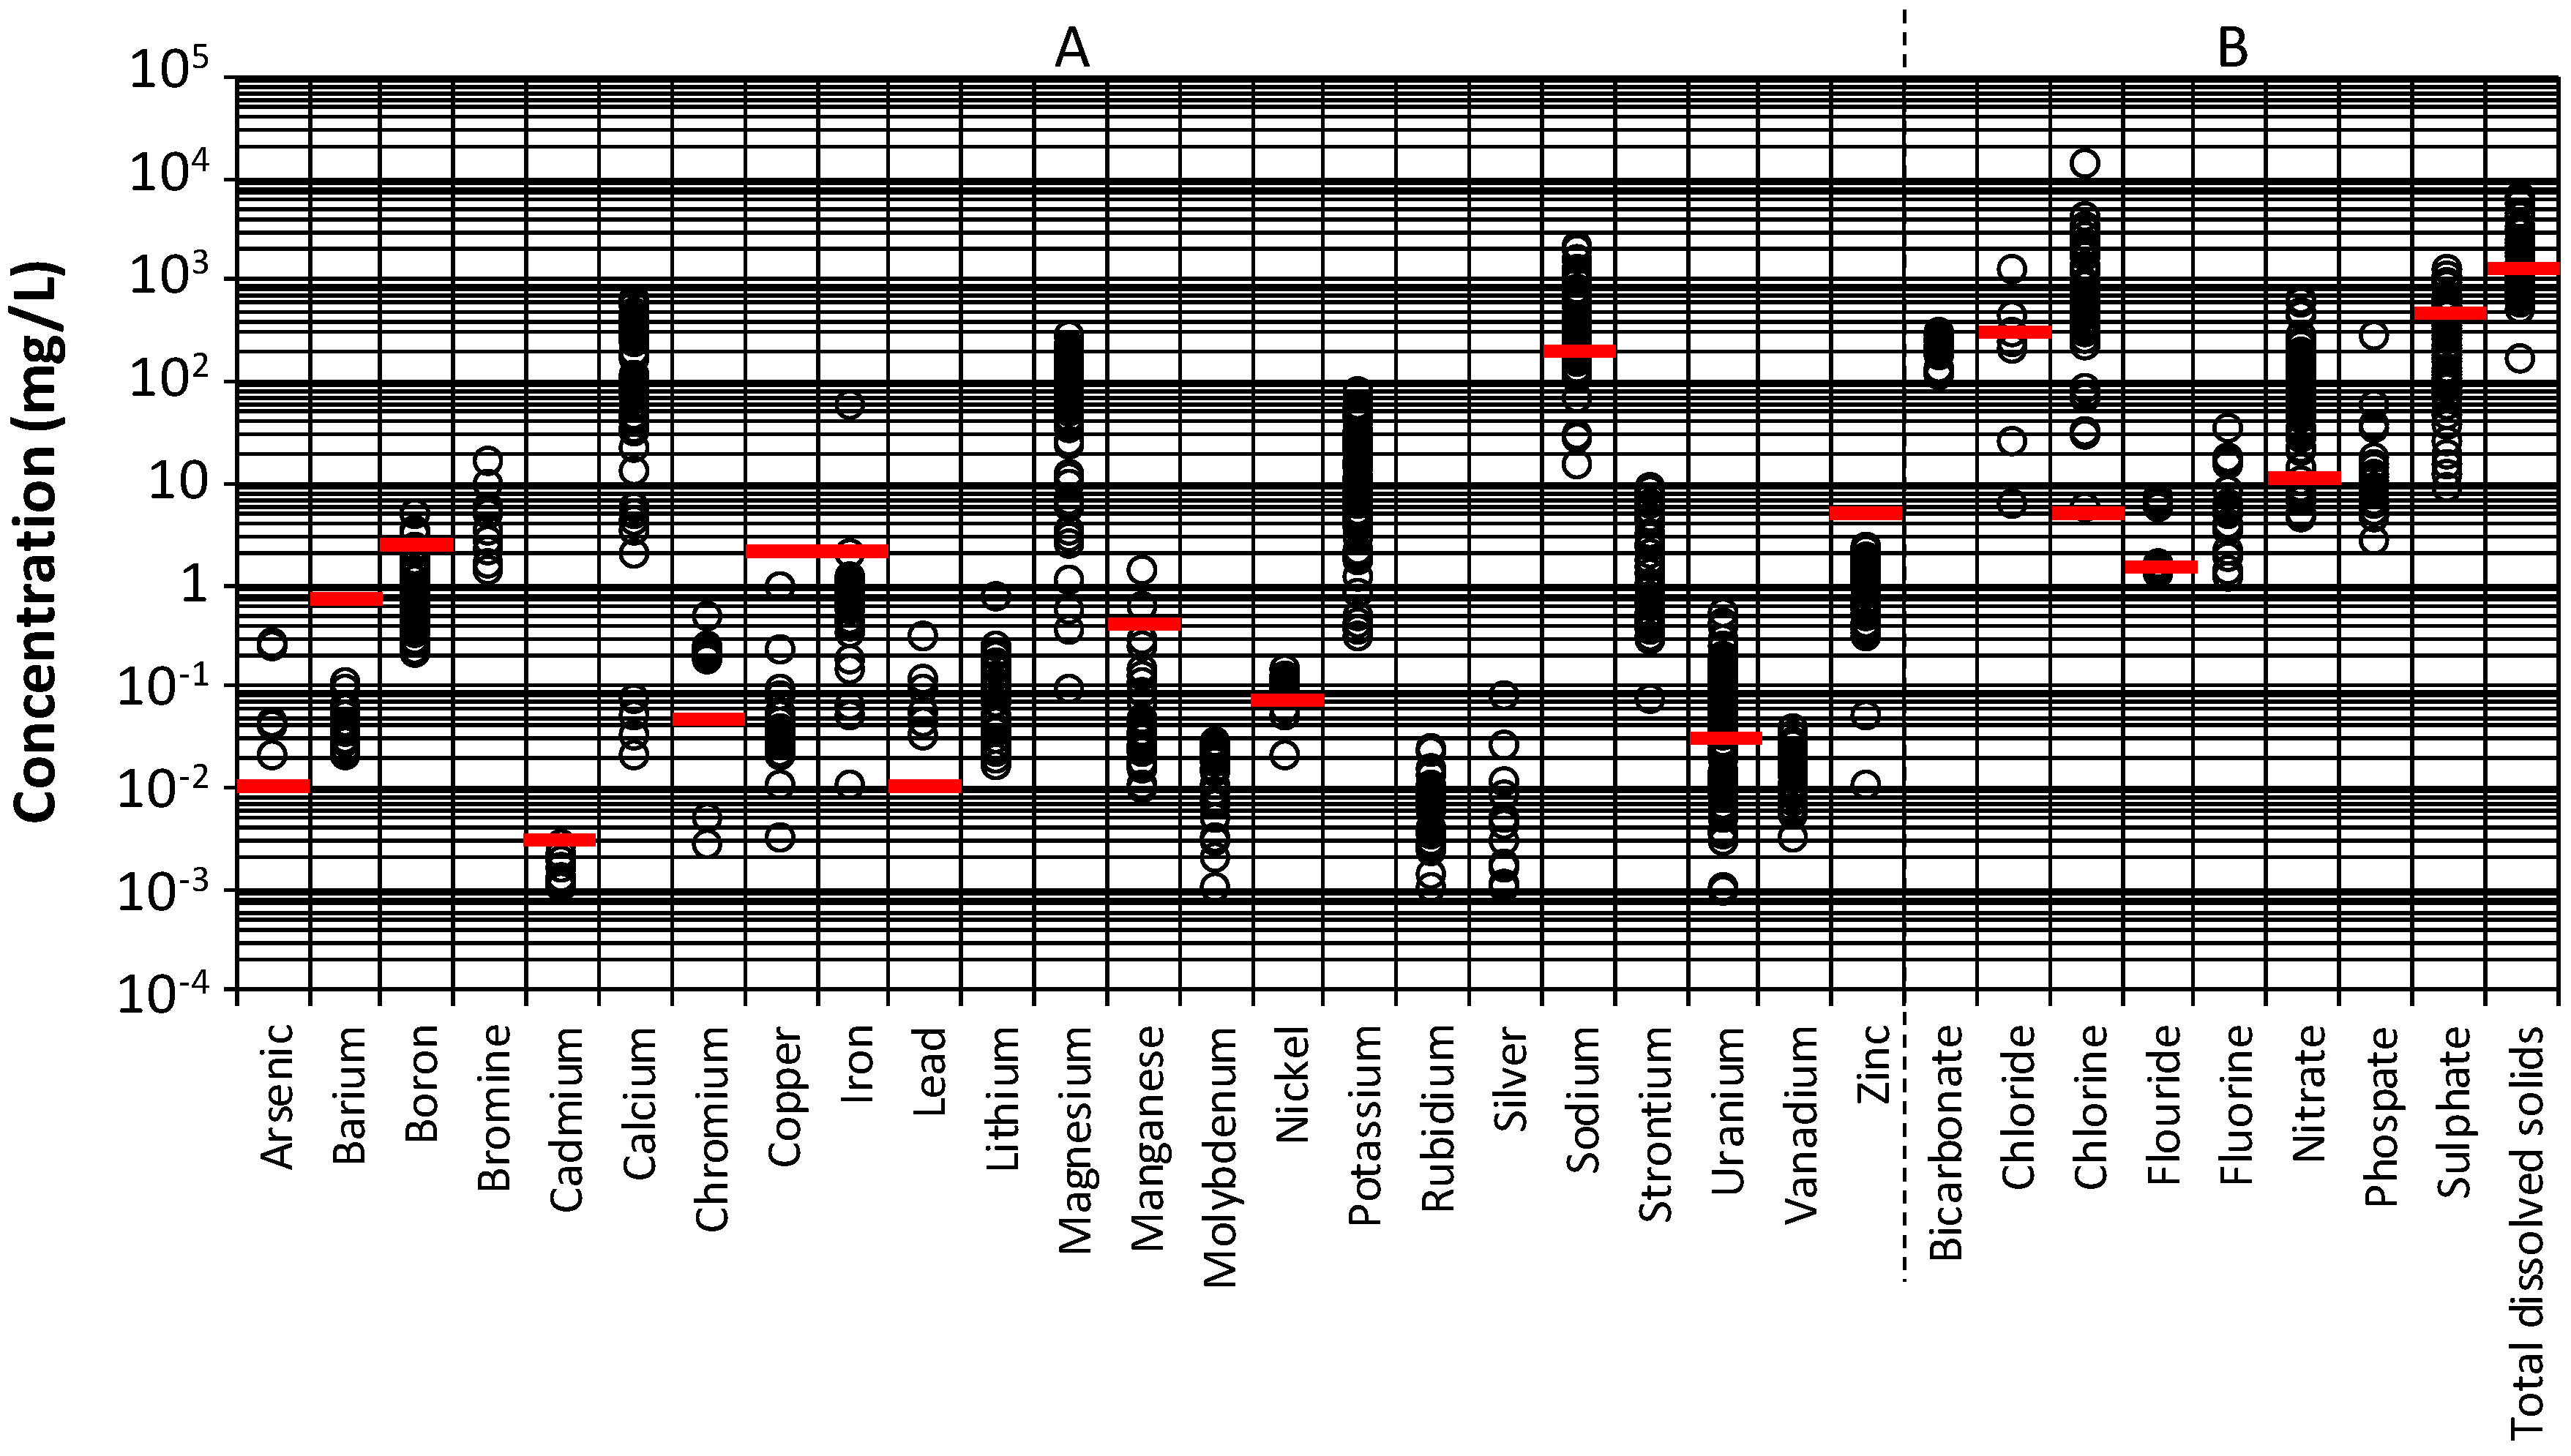
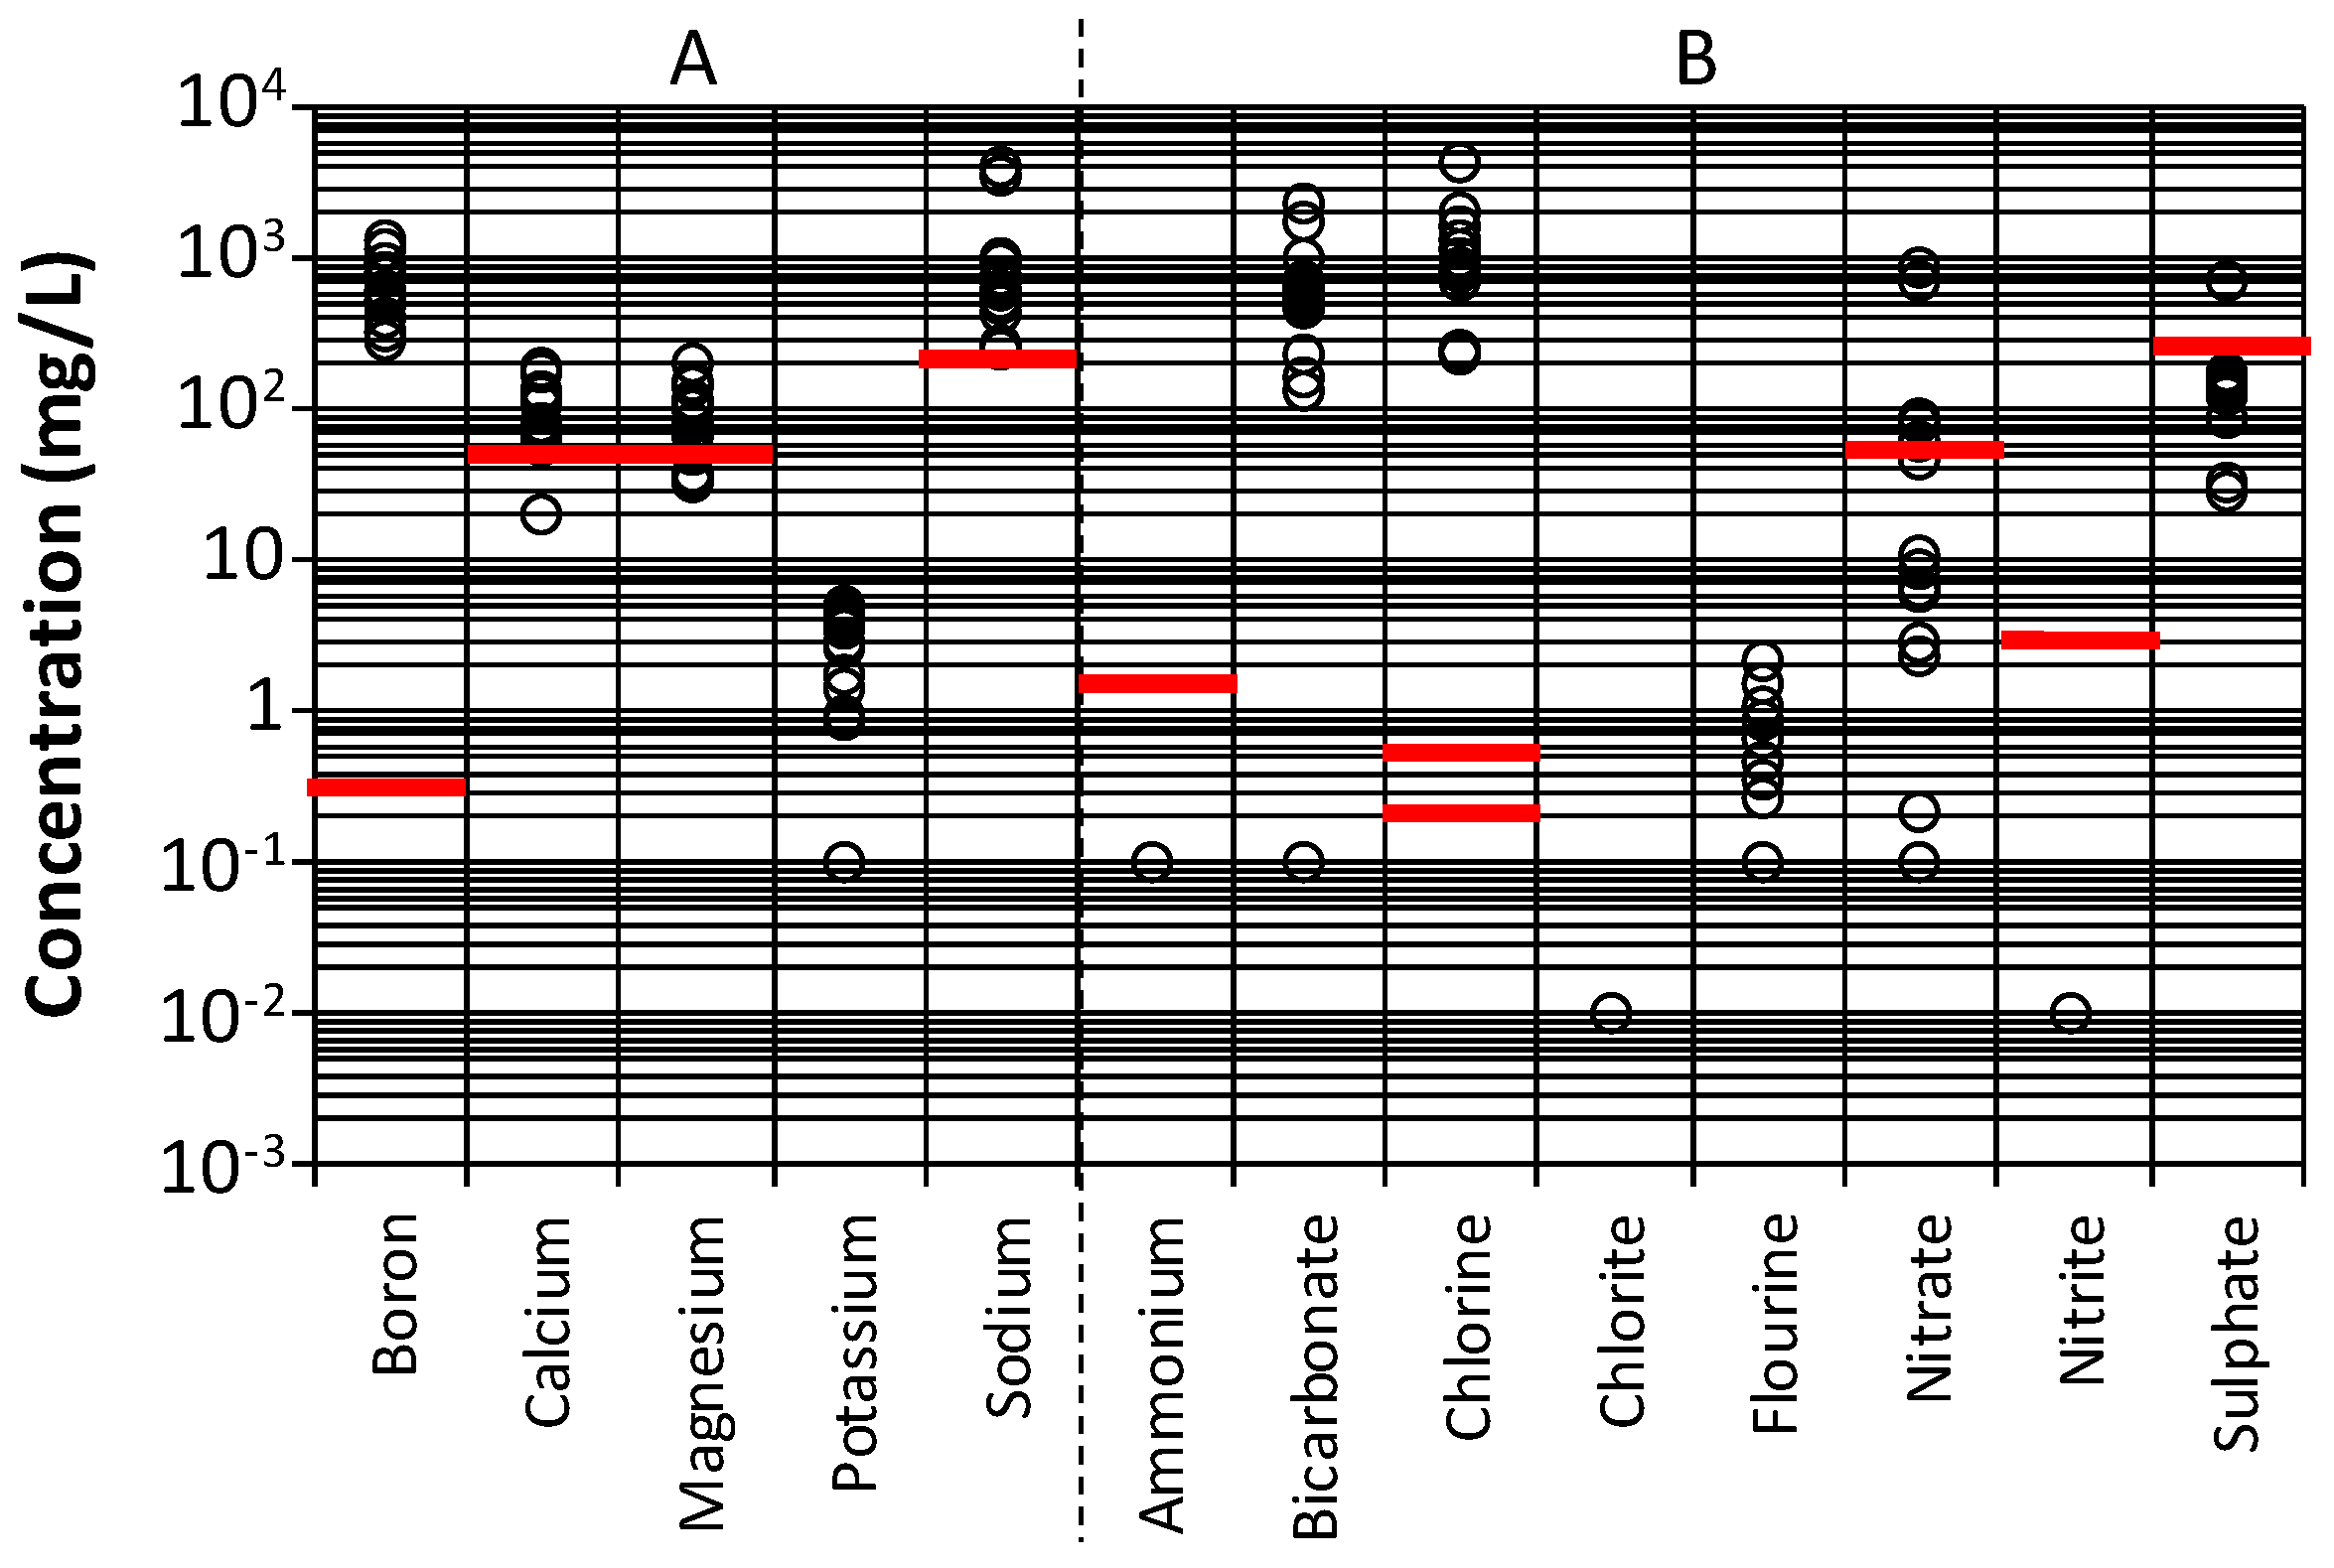
Figure 3 and Figure 4 refer to concentrations of chemical and physical parameters measured in surface water in RSA and MZ, grouped according to the classes of inorganic chemicals (A) and macropollutants (including PAHs) (B). In addition, the values of the corresponding standard maximum concentrations, set by the national law for drinking water, are reported (red dash) in order to show how far the quality of the water which could be withdrawn for drinking purposes is from the corresponding standard.
It is interesting to observe that in Figure 3, most data refer to inorganic chemicals, such as some common heavy metals. This is strictly related to the fact that in RSA, mine activities represent one of the most important economic activities for the country, and different investigations were carried out to monitor their occurrence in surface water receiving mine drainage during mine exercise. Only a few data are available for Mozambique (see Figure 4), and all of them refer to a recent investigation [26].
The analysis of the observed ranges of concentration for the different pollutants and the corresponding legal standard leads to the classification of the compounds of Table 3.
It emerges that in RSA, nickel, and in MZ, boron and chlorine, are the selected parameters whose concentrations always exceed the corresponding standards for drinking water set by the local regulations (Table 1).
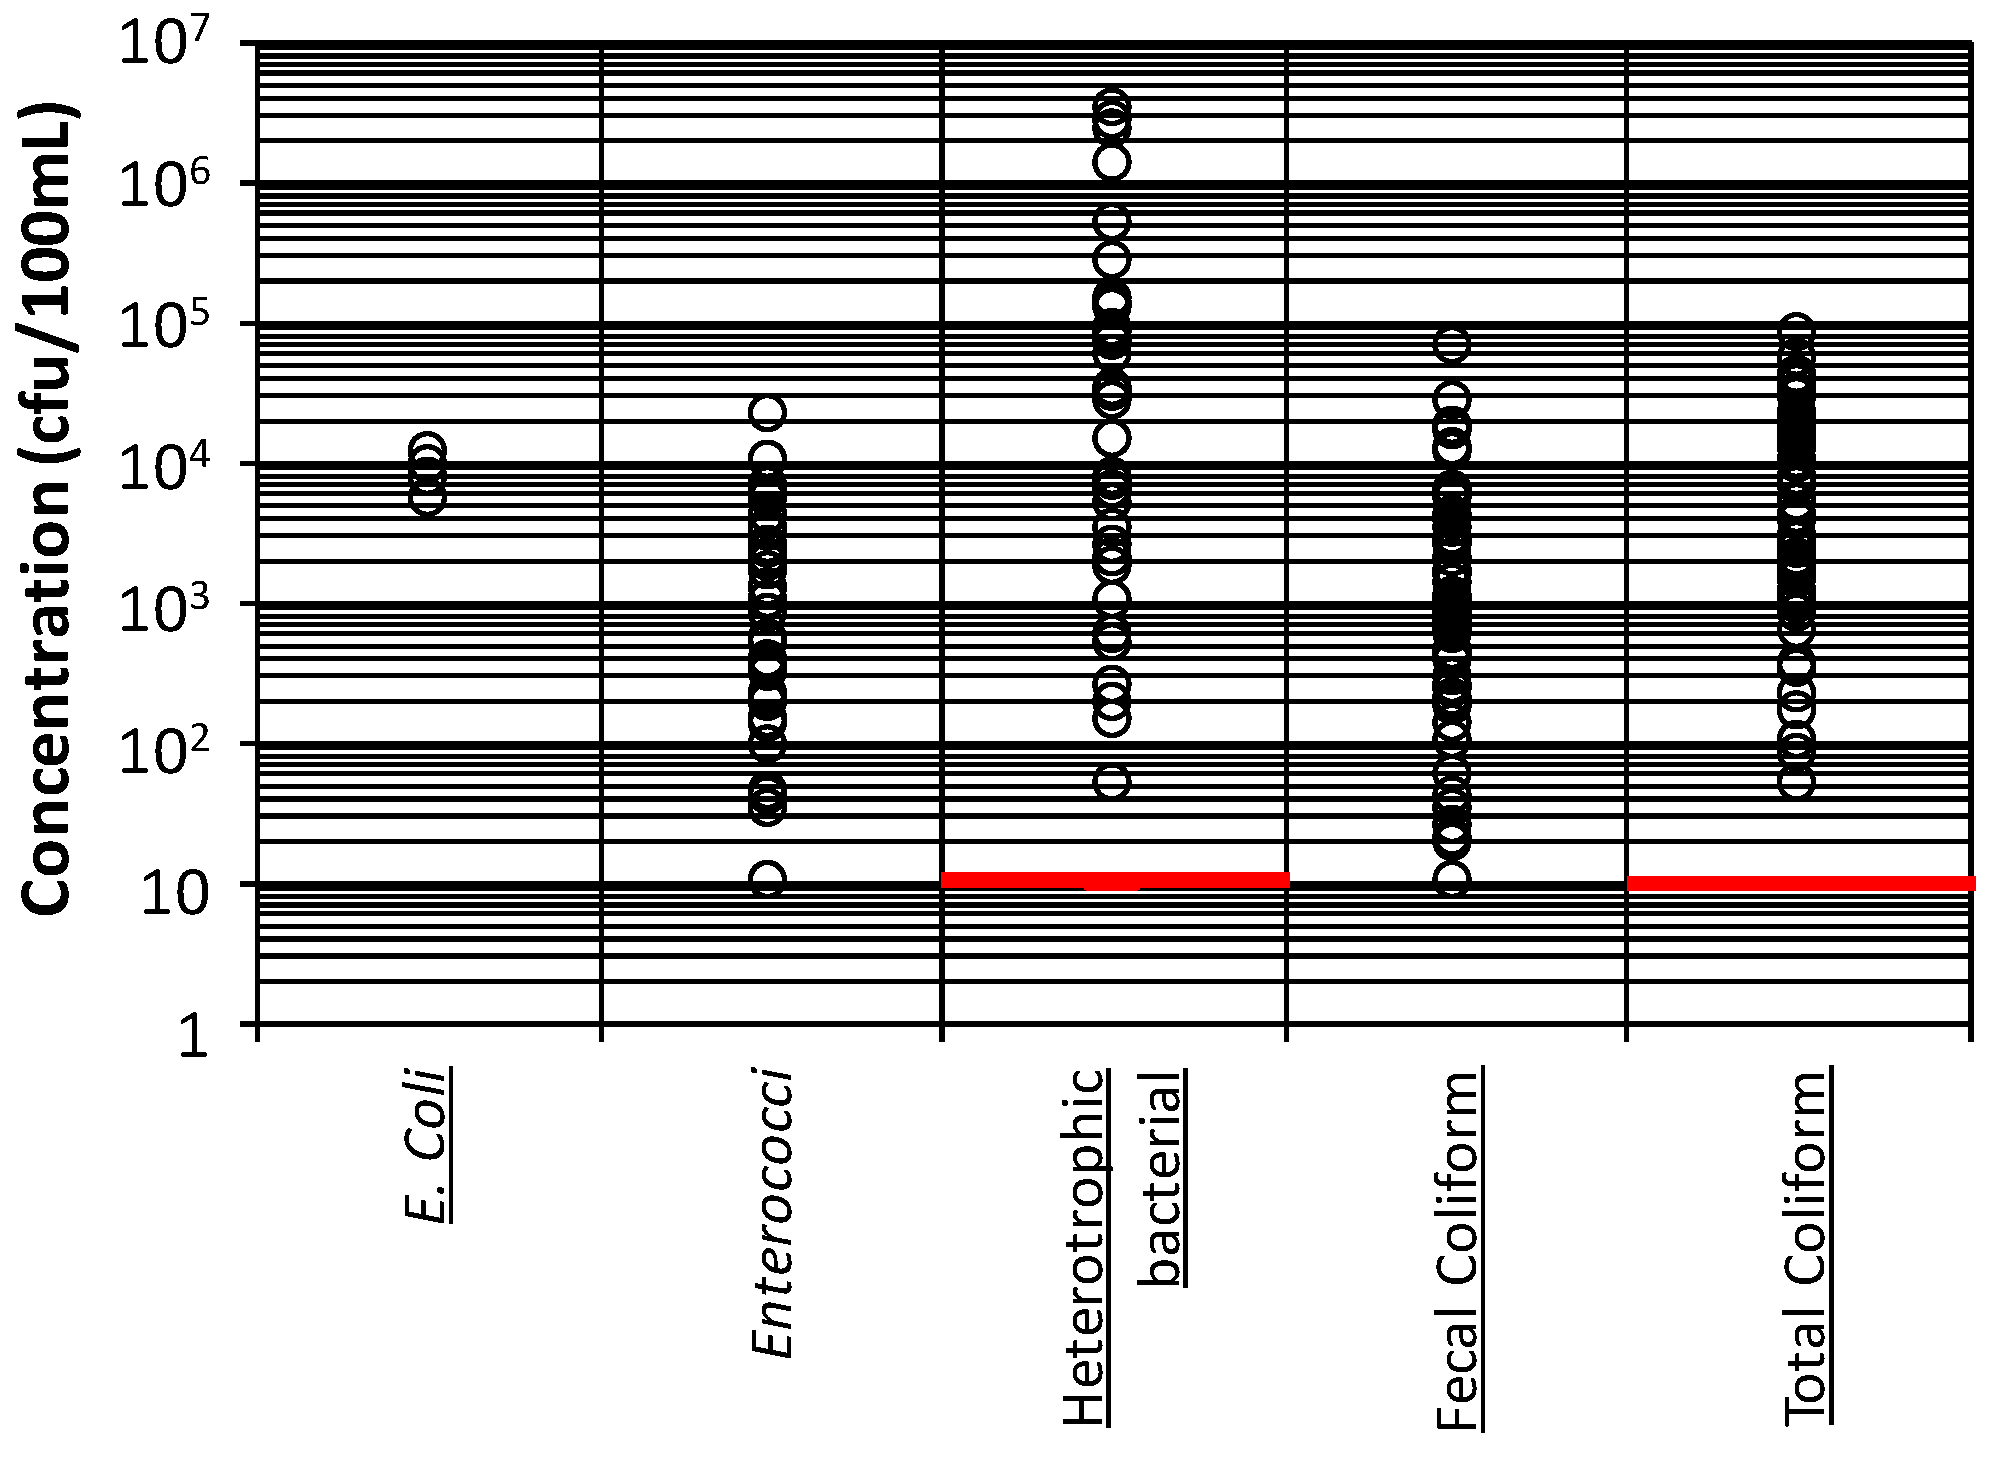
As to microorganisms, surface water contains high concentrations of all the investigated species. This consideration is not surprising as surface water bodies may receive land runoff from areas characterized by the presence of grazing animals and where manure may be applied, as well as untreated rural and zootechnic wastewater, which contribute in terms of microorganisms [27].

3.2. Groundwater Quality and Observed Variability of Concentrations of Selected Parameters

A higher number of compounds were investigated in groundwater in RSA with respect to surface water, and also, in this case, most data refer to inorganic chemicals (Figure 6 and Figure 7). On the basis of the collected data, it emerges that in RSA, only for barium, cadmium, copper and zinc, measured concentrations are always below the corresponding standard limits for drinking purposes. For arsenic, lead and chlorine the collected, values of concentrations always exceed the corresponding drinking standard. In MZ, on the basis of the limited number of collected data, it is possible to observe that measured concentrations are higher than the drinking standards, with the exception of nitrites.
Table 4 groups the compounds according to the criteria Variability Range-Standard defined above (Table 2).
A comparison between Table 3 and Table 4 shows that for Mozambique, boron and chlorine were also critical for surface water; for South Africa, nickel was the most critical one for surface water body.
Microorganisms may be present in groundwater due to percolation/infiltration of untreated wastewater. This is the case reported by [9] for the groundwater below 37 dairy farms in the central Free State, in South Africa: Escherichia coli was occasionally found up to 2.4 × 10⁴ CFU/100 mL, and its mean value in the monitoring campaign was equal to 84.5 CFU/100 mL in 2009 and 3.9 CFU/100 mL in 2013.

4. Discussion and Conclusions

The occurrence of the inorganic compounds (Cd, Hg, Pb, Al, As, Cr, Cu, Ni, Zn, Sn) in surface water was associated with the use of fertilizers and biocides in agriculture [23]. Specific investigations in different periods remarked on this correspondence.
Metal enrichment of groundwater may be due to geochemical processes involving oxidation reactions, leaching, evaporation and other interactions between host rocks and water. In addition, infiltration and percolation of acidic mine drainage may cause increment of the concentration of specific metals.
A recent study by [26] remarked that in the Limpopo National Park, Gaza Province, in the south of Mozambique, only 13.3% of the groundwater was suitable for drinking purposes, and the remaining was brackish and undrinkable due to high content of chloride and sodium naturally present. As for surface waters, it was found that 80% was suitable for drinking water.
The high content of As in groundwater was correlated to natural origins (release from minerals and host rocks), but also to the discharge of industrial activities (As used in glass manufacturing, steel melting process and as a wood preservative) and to agricultural activities (due to the use of pesticides as remarked above) [35].
Surface water quality may rapidly deteriorate due to anthropic pressures (for instance, untreated as well as accidental releases, land runoff) as well as natural ones (among them, heavy rain events, flooding).
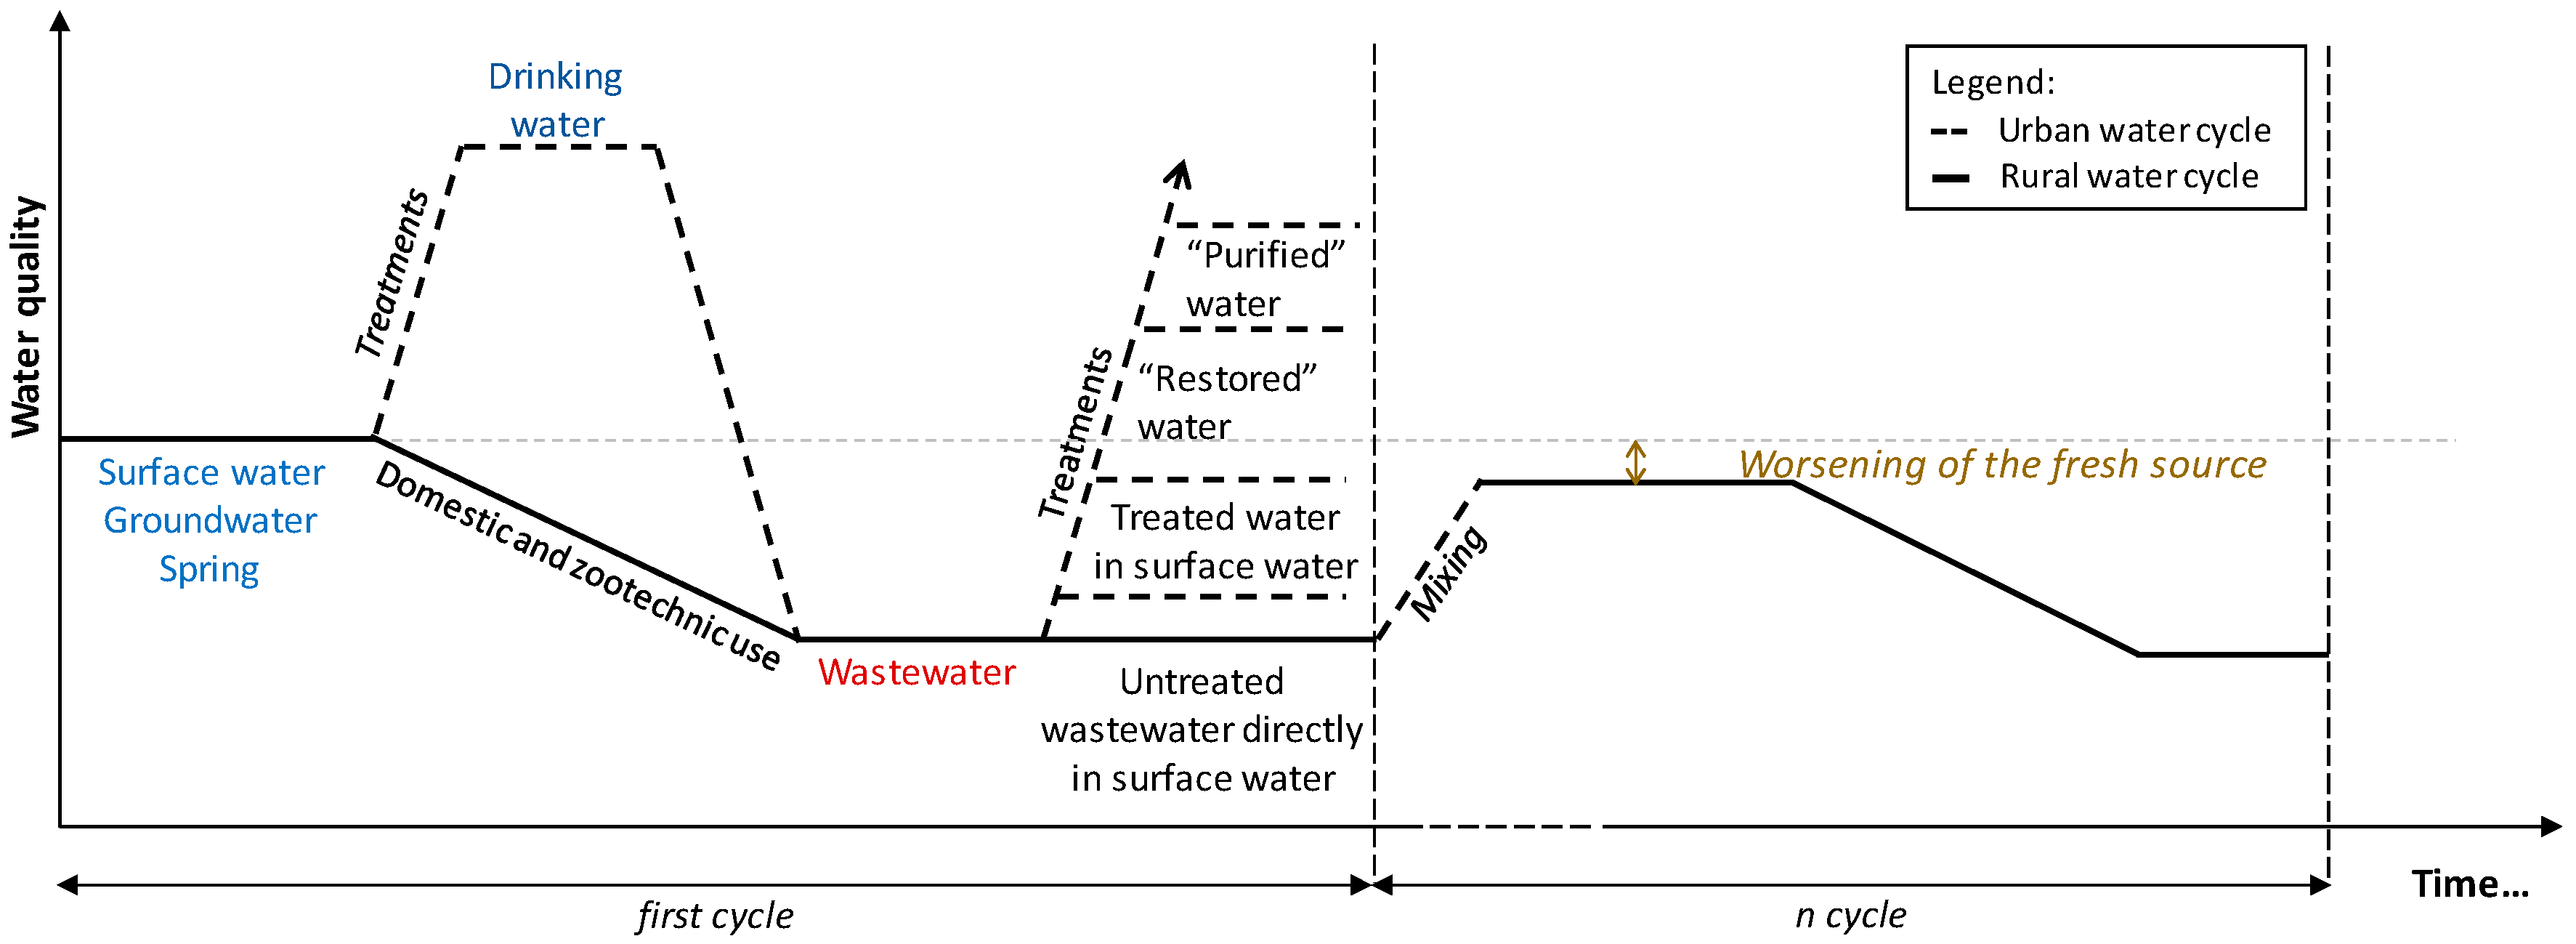
In those areas where domestic wastewater is not properly treated before its release in the aquatic environment, surface water quality is destined to get worse (Figure 8). In this context, a waterworks could have some difficulties in coping with the changes of feeding water and in guaranteeing safe water, adequate for drinking purposes if the influent water may rapidly change and become more polluted over time.
A waterworks is designed on the basis of a well-defined (expected) quality of the influent water. This may change, but any design parameter may vary within a defined variability range. It is important to underline that the waterworks consists of a multibarrier system able to remove different pollutants in the different treatment steps (mainly raw materials, turbidity, colloidal substances, inorganic compounds, microorganisms). It should work, and if well managed, it should guarantee a continuous exercise and the respect of the legal requirements for a long time. Specific treatments could be added after waterworks construction if a revision of the local regulation leads to the definition of new standards for some pollutants (of emerging concern, or introduced for the first time in the specific regulation).
With regard to the rural areas under study, it emerges that the quality of surface and groundwater could get worse over time due to untreated releases by anthropic activities (the level of treatment of existing wastewater treatment plants is characterized by moderate or limited progress, and zootechnic effluents are released untreated in most cases).
In order to guarantee that the construction of the waterworks will produce safe water for a long time in areas where the access to drinking water is still modest as those under study, it is necessary that other actions could be planned and completed. These actions refer to the whole rural water cycle (Figure 8). In particular, interventions would refer to (domestic, zootechnic and industrial) wastewater management and treatment in order to guarantee that the quality level of the fresh source remains constant over time.

Author Contributions

P.V. conceived and designed the study; V.G. collected data and processed them; P.V. and V.G. wrote the paper. All authors have read and agreed to the published version of the manuscript.

Conflicts of Interest

The authors declare no conflict of interest.

Abbreviations

The following abbreviations are used in this manuscript:
WHOWorld Health Organization
RSARepublic of South Africa
MZMozambique

References

  1. WHO. Progress on Drinking Water, Sanitation and Hygiene. 2017. Available online: https://apps.who.int/iris/bitstream/handle/10665/258617/9789241512893-eng.pdf?sequence=1 (accessed on 31 October 2019).
  2. STATS SA. Statistics South Africa. Statistical Release P0302. Mid-Year Population Estimates for 2019. Available online: http://www.statssa.gov.za/publications/P0302/P03022019.pdf (accessed on 31 October 2019).
  3. STATS SA. Statistics South Africa. Statistical Release P0318. General Household Survey for 2018. Available online: http://www.statssa.gov.za/publications/P0318/P03182018.pdf (accessed on 31 October 2019).
  4. INE. Istituto Nacional de Estatistica. Censo 2017, IV Recenseamento Geral da População e Habitação (RGPH). 2017. Available online: http://www.ine.gov.mz/operacoes-estatisticas/censos/censo-2007/censo-2017/divulgacao-de-resultados-preliminares-do-iv-rgph-2017.pdf/view (accessed on 31 October 2019). (In Portuguese)
  5. FAO. Food and Agriculture Organization of the United Nations. AQUASTAT Report 2016. Country Profile—Mozambique. Available online: http://www.fao.org/3/i9805en/I9805EN.pdf (accessed on 31 October 2019).
  6. WHO/UNICEF. World Health Organization/United Nations Children’s Fund. JMP Global Database. 2017. Available online: https://washdata.org/data/household#!/ (accessed on 31 October 2019).
  7. RSA. Republic of South Africa. GNR.509 of 8 June 2001: Regulations Relating to Compulsory National Standards and Measures to Conserve Water. Regulation Gazette 7079, Government Gazette 22355. Available online: https://cer.org.za/wp-content/uploads/2011/10/Regulations-relating-to-compulsory-national-standards-and-measures-to-conserve-water.pdf (accessed on 31 October 2019).
  8. UNDP. United Nations Development Programme. Human Development Report 2006. Beyond Scarcity: Power, Poverty and the Global Water Crisis. Available online: http://hdr.undp.org/sites/default/files/reports/267/hdr06-complete.pdf (accessed on 31 October 2019).
  9. Esterhuizen, L.; Fossey, A.; Potgieter, E. Groundwater quality on dairy farms in central south africa. Water SA 2015, 41, 194–198. [Google Scholar] [CrossRef]
  10. DM 180/2004. Diploma Ministerial n. 180/2004. Boletim da Republica de Mocambique I (Serie, No. 37). Regulamento Sobre a Qualidade da Agua para o Consumo Humano. Available online: http://extwprlegs1.fao.org/docs/pdf/moz65565.pdf (accessed on 31 October 2019).
  11. SANS 241-2015. South Africa National Standard 2015. Drinking Wate; Part 1: Microbiological, Physical, Aesthetic and Chemical Determinands; Part 2: Application of SANS 241-1. Available online: https://www.mwa.co.th/download/prd01/iDW_standard/South_African_Water_Standard_SANS_241-2015.pdf (accessed on 31 October 2019).
  12. Akinsoji, O.; Fatoki, O.S.; Ximba, B.J.; Opeolu, B.O.; Olatunji, O.S. Assessment of arsenic levels in Guguletu and Langa rivers in Cape Town, South Africa. Int. J. Phys. Sci. 2013, 8, 1334–1340. [Google Scholar]
  13. Edokpayi, J.N.; Odiyo, J.O.; Olasoji, S.O. Assessment of heavy metal contamination of Dzindi River, in Limpopo Province, South Africa. Int. J. Nat. Sci. Res. 2014, 2, 185–194. [Google Scholar]
  14. Edokpayi, J.N.; Odiyo, J.O.; Msagati, T.A.M.; Potgieter, N. Temporal variations in physico-chemical and microbiological characteristics of Mvudi river, South Africa. Int. J. Environ. Res. Public Health 2015, 12, 4128–4140. [Google Scholar] [CrossRef] [PubMed]
  15. Edokpayi, J.N.; Odiyo, J.O.; Popoola, O.E.; Msagati, T.A.M. Assessment of trace metals contamination of surface water and sediment: A case study of Mvudi river, South Africa. Sustainability 2016, 8, 135. [Google Scholar] [CrossRef]
  16. Edokpayi, J.N.; Odiyo, J.O.; Popoola, O.E.; Msagati, T.A.M. Determination and distribution of polycyclic aromatic hydrocarbons in rivers, sediments and wastewater effluents in Vhembe district, South Africa. Int. J. Environ. Res. Public Health 2016, 13, 387. [Google Scholar] [CrossRef]
  17. Edokpayi, J.N.; Odiyo, J.O.; Popoola, O.E.; Msagati, T.A.M. Evaluation of temporary seasonal variation of heavy metals and their potential ecological risk in Nzhelele river, South Africa. Open Chem. 2017, 15, 272–282. [Google Scholar] [CrossRef]
  18. Fatoki, O.S.; Awofolu, R. Levels of cd, hg and zn in some surface waters from the Eastern Cape province, South Africa. Water SA 2003, 29, 375–380. [Google Scholar] [CrossRef]
  19. Fatoki, O.S.; Muyima, N.Y.O.; Lujiza, N. Situation analysis of water quality in the Umtata river catchment. Water SA 2001, 27, 467–473. [Google Scholar] [CrossRef]
  20. Fatoki, O.S.; Lujiza, N.; Ogunfowokan, A.O. Trace metal pollution in Umtata river. Water SA 2002, 28, 183–189. [Google Scholar] [CrossRef]
  21. Fatoki, O.S.; Awofolu, O.R.; Genthe, B. Cadmium in the Umtata river and the associated health impact of on rural communities who are primary users of water from the river. Water SA 2004, 30, 507–513. [Google Scholar] [CrossRef]
  22. Jackson, V.A.; Paulse, A.N.; Van Stormbroek, T.; Odendaal, J.P.; Khan, W. Investigation into metal contamination of the Berg river, Western Cape, South Africa. Water SA 2007, 33, 175–182. [Google Scholar] [CrossRef]
  23. Jackson, V.A.; Paulse, A.N.; Odendaal, J.P.; Khan, W. Investigation into the metal contamination of the plankenburg and diep rivers, Western Cape, South Africa. Water SA 2009, 35, 289–300. [Google Scholar] [CrossRef]
  24. Lin, J.; Biyela, P.T.; Puckree, T.; Bezuidenhout, C.C. A study of the water quality of the Mhlathuze river, KwaZulu-natal (RSA): Microbial and physico-chemical factors. Water SA 2004, 30, 17–22. [Google Scholar] [CrossRef]
  25. Nekhavhambe, T.J.; van Ree, T.; Fatoki, O.S. Determination and distribution of polycyclic aromatic hydrocarbons in rivers, surface runoff, and sediments in and around Thohoyandou, Limpopo province, South Africa. Water SA 2014, 40, 415–424. [Google Scholar] [CrossRef]
  26. Barbieri, M.; Ricolfi, L.; Vitale, S.; Muteto, P.V.; Nigro, A.; Sappa, G. Assessment of groundwater quality in the buffer zone of Limpopo national park, Gaza province, Southern Mozambique. Environ. Sci. Pollut. Res. 2019, 26, 62–77. [Google Scholar] [CrossRef]
  27. Verlicchi, P.; Aviles Sacoto, E.C.; Zanni, G. Zootechnical Farm Wastewaters in Ecuador: A Treatment Proposal and Cost-benefit Analysis. Water 2019, 11, 779. [Google Scholar] [CrossRef]
  28. Abia, A.L.K.; Ubomba-Jaswa, E.; Momba, M.N.B. Impact of seasonal variation on escherichia coli concentrations in the riverbed sediments in the Apies River, South Africa. Sci. Total Environ. 2015, 537, 462–469. [Google Scholar] [CrossRef]
  29. Bezuidenhout, C.C.; Mthembu, N.; Puckree, T.; Lin, J. Microbiological evaluation of the Mhlathuze river, KwaZulu-natal (RSA). Water SA 2002, 28, 281–286. [Google Scholar] [CrossRef]
  30. Obi, C.L.; Potgieter, N.; Bessong, P.O.; Matsaung, G. Assessment of the microbial quality of river water sources in rural Venda communities in South Africa. Water SA 2002, 28, 287–292. [Google Scholar] [CrossRef]
  31. Sibanda, T.; Chigor, V.N.; Okoh, A.I. Seasonal and spatio-temporal distribution of faecal-indicator bacteria in Tyume river in the Eastern Cape province, South Africa. Environ. Monit. Assess. 2013, 185, 6579–6659. [Google Scholar] [CrossRef] [PubMed]
  32. Abiye, T.A.; Leshomo, J.T. Groundwater flow and radioactivity in Namaqualand, South Africa. Environ. Earth Sci. 2013, 70, 281–293. [Google Scholar] [CrossRef]
  33. Abiye, T.; Leshomo, J. Metal enrichment in the groundwater of the arid environment in South Africa. Environ. Earth Sci. 2014, 72, 4587–4598. [Google Scholar] [CrossRef]
  34. Abiye, T.; Bybee, G.; Leshomo, J. Fluoride concentrations in the arid Namaqualand and the Waterberg groundwater, South Africa: Understanding the controls of mobilization through hydrogeochemical and environmental isotopic approaches. Groundw. Sustain. Dev. 2018, 6, 112–120. [Google Scholar] [CrossRef]
  35. Abiye, T.A.; Bhattacharya, P. Arsenic concentration in groundwater: Archetypal study from South Africa. Groundw. Sustain. Dev. 2019, 9. [Google Scholar] [CrossRef]
  36. Edokpayi, J.N.; Enitan, A.M.; Mutileni, N.; Odiyo, J.O. Evaluation of water quality and human risk assessment due to heavy metals in groundwater around Muledane area of Vhembe district, Limpopo province, South Africa. Chem. Cent. J. 2018, 12. [Google Scholar] [CrossRef]
  37. .Odiyo, J.O.; Makungo, R. Fluoride concentrations in groundwater and impact on human health in Siloam Village, Limpopo province, South Africa. Water SA 2012, 38, 731–736. [Google Scholar] [CrossRef]
  38. Odiyo, J.O.; Makungo, R. Chemical and microbial quality of groundwater in Siloam village, implications to human health and sources of contamination. Int. J. Environ. Res. Public Health 2018, 15, 317. [Google Scholar] [CrossRef]
  39. Van Wyk, N.; Coetzee, H. The distribution of uranium in groundwater in the Bushmanland and Namaqualand areas, Northern Cape province, South Africa. In Uranium, Mining and Hydrogeology Paper; Merkel, B.J., Hasche-Berger, A., Eds.; Springer: Berlin/Heidelberg, Germany, 2008; pp. 639–644. ISBN 978-3-540-87745-5. [Google Scholar]
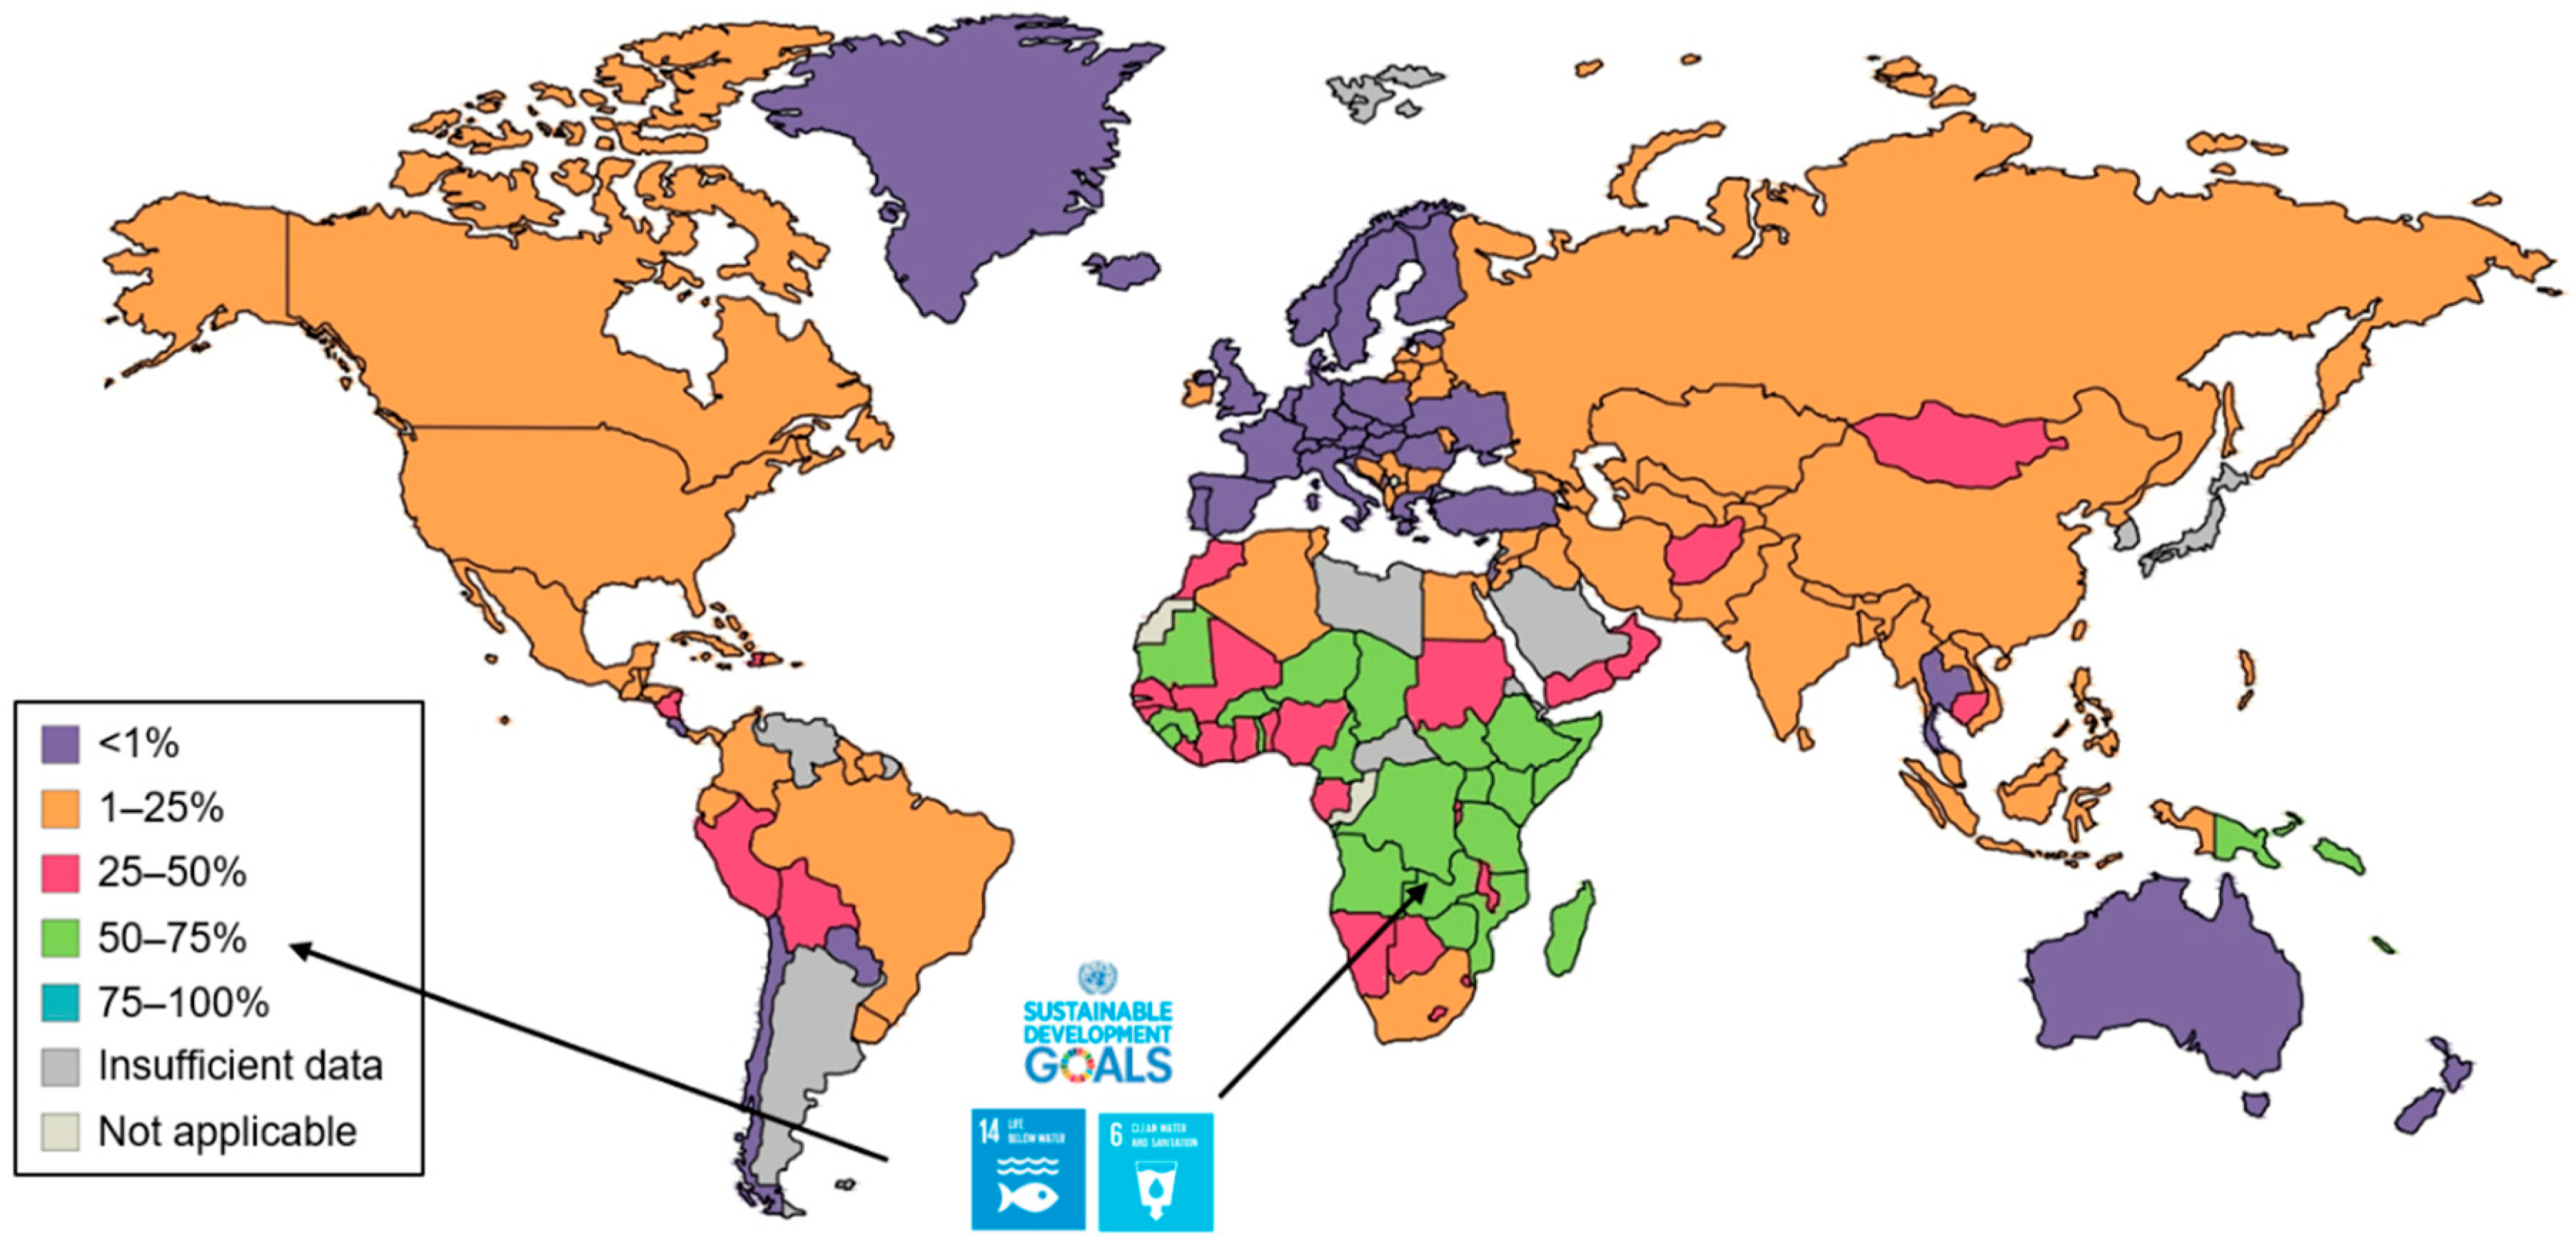
Figure 1. Percentage of rural population using surface water for drinking water or unimproved or limited drinking water. Focus on Sub-Saharan region. (Adapted from [6]).
Proceedings 48 00003 g001
Figure 2. Indicative location map of the studied papers with the corresponding references.
Proceedings 48 00003 g002
Figure 3. Observed concentrations (circle) of inorganic compounds (A) and macropollutants (B) in surface water in the reviewed studies referring to the Republic of South Africa (RSA) and the corresponding limits (red dashes) set by SANS-241 for drinking water. Data from [12,13,14,15,16,17,18,19,20,21,22,23,24,25].
Proceedings 48 00003 g003
Figure 4. Observed concentrations (circles) of inorganic compounds (A) and macropollutants (B) in surface water in the reviewed studies referring to Mozambique and the corresponding limits (red dashes) set by the national in force law (red line) for drinking water. Data from [26].
Proceedings 48 00003 g004
Figure 5. Observed concentrations of microorganisms (circles) in surface water in the reviewed studies referring to South Africa and the corresponding limits set by SANS-241 (red dashes) for drinking water. On the x axis, the underlined names refer to indicator bacteria, and those not underlined refer to pathogen bacteria. Data from [14,19,24,28,29,30,31].
Proceedings 48 00003 g005
Figure 6. Observed concentrations (circles) inorganic compounds (A) and macropollutants (B) in groundwater in the reviewed studies referring to South Africa and the corresponding limits (red dashes) set by SANS-241 (red line) for drinking water. Data from [32,33,34,35,36,37,38,39].
Proceedings 48 00003 g006
Figure 7. Observed concentrations of inorganic compounds (A) and macropollutants (B) (circle) in groundwater in the reviewed studies referring to Mozambique and the corresponding limits set by the local law (red line) for drinking water. Data from [26].
Proceedings 48 00003 g007
Figure 8. The water quality versus time in case inadequate treatments are present for wastewater produced by anthropic activities. The dashed lines refer to the case in which a treatment is present and properly works. The graph reports two “cycles”(first and n°) occurring in two periods in the same place where no treatments are present for wastewater.
Proceedings 48 00003 g008
Table 1. Drinking water quality standards Si set by Mozambique and South Africa.
ContaminantUnitSi_Mozambique
(DM-180/2004 [10])
Si_South Africa
(SANS-241-1:2015 [11])
Aluminium µg/L200≤300
Ammoniaµg/L1500≤1500
Arsenic µg/L10≤10
Barium µg/L700≤700
Boronµg/L300≤2400
Cadmium µg/L3≤3
Calciummg/L50
Chloride mg/L250≤300
Chlorine µg/L200–500 (residual)≤5000 (free)
Chromium (total)µg/L50 ≤50
Conductivity mS/m5–200≤170 (25 °C)
Copper µg/L1000≤2000
Fluoride µg/L1500≤1500
Iron µg/L300 (total)≤2000 (chronic health)
≤300 (aesthetic)
Leadµg/L10≤10
Magnesium mg/L50
Manganese µg/L100≤400 (chronic health)
≤100 (aesthetic)
Mercury µg/L1≤6
Molybdenum µg/L70
Nickel µg/L20≤70
Nitrate mg N/L50≤11
Nitrate+Nitrite mg N/L ≤1
Nitrite µg N/L3000≤900
pH (25 °C) 6.5–8.55–9.7
Phosphorusµg/L100
PAHs totalµg/L0.1
Sodium mg/L200≤200
Sulphate mg/L250≤500 (acute health)
≤250 (aesthetic)
Total dissolved solids mg/L1000≤1200 (aesthetic)
Turbidity NTU5≤1 (operation)≤5 (aesthetic)
Uranium µg/L ≤30
Zinc µg/L3000≤5000
Escherichia coli (E.coli)n/100 mL Not detected
Fecal coliforms n/100 mL 0-10 or absentNot detected
Heterotrophic plate count (HPC)n/1 mL ≤1000
Total coliformsn/100 mLAbsent≤10
Table 2. Criteria defining the level of pollution due to the concentrations ci of the compounds included in the review.
GroupVariability Range-Standards CriteriaPollution Level
1Maximum measured concentrations of the pollutant ci,max < standard Si
275th percentile < Si ≤ 100th percentile of the collected values of concentrations😐
350th percentile < Si ≤ 75th percentile of the collected values of concentrations😐😐
425th percentile < Si ≤ 50th percentile of the collected values of concentrations
5Si ≤ 25° percentile of the collected values of concentrations☹☹
6Minimum measured concentrations ci,min > Si☹☹☹
Table 3. Classification of the compounds occurring in surface water, according to the criteria “Variability Range-Standard” (Table 2) applied to specific RSA and MZ regulations for drinking water (Table 1).
GroupSouth AfricaMozambiquePollution Level
ci,max < SiArsenic, zinc, ammonium, chloride, fluoride, nitrate, sulphate, TDSAmmonium, nitrite, nitrate😊
75th perc. < Si ≤ 100th perc.Copper, manganese, nitrite Calcium, magnesium, sodium, sulphate😐
50th perc. < Si ≤ 75° perc.Mercury--😐😐
25th perc. < Si ≤ 50° perc. Cadmium, chromium, lead, manganese--
Si ≤ 25th perc.Aluminium, iron--☹☹
ci,min > SiNickelBoron, chlorine☹☹☹
Comparison not possiblePhosphate, phosphorus, total nitrogen, PAHsFluorine, potassium, bicarbonate, chlorite
Table 4. Classification of the compounds occurring in groundwater, according to the criteria “Variability Range-Standard” applied to specific South Africa and Mozambique regulations for drinking water (see Table 1).
GroupSouth AfricaMozambiquePollution Level
ci,max < SiBarium, cadmium, copper, zincNitrite, ammonium
75th perc. < Si ≤ 100° perc.Boron, iron, manganese, chloride, sulphateSulphate 😐
50th perc. < Si ≤ 75th perc.Nickel, fluoride, TDSNitrate 😐😐
25th perc. < Si ≤ 50th perc.Chromium, uraniumMagnesium
Si ≤ 25th perc. Sodium, nitrate Calcium ☹☹
ci,min > SiArsenic, lead, chlorineBoron, sodium, chlorine☹☹☹
Comparison not possibleBromine, calcium, lithium, magnesium, molybdenum, potassium, rubidium, silver, strontium, vanadium, bicarbonate, fluorine, phosphatePotassium bicarbonate, chlorite, fluorine
Publisher’s Note: MDPI stays neutral with regard to jurisdictional claims in published maps and institutional affiliations.