1. Introduction
Disinfection within the water distribution network (WDN) is necessary to prevent drinking water from being harmful to our health. As disinfectant travels through the pipes in a distribution system, it can react with a variety of materials both within the bulk water and from the pipe wall [
1]. However, in some terminal nodes of the WDN, disinfectant concentrations may become lower than the minimum values necessary to guarantee users’ protection from contaminations (as prescribed by technical guidelines) [
2]. The problem of low disinfectant concentrations occurs in areas such as dead-end nodes, in which low flow conditions lead to long residence times and to excessive decay of the disinfectant upstream from users. A solution to this problem may be to increase the concentration of disinfectant fed at the treatment plant. Although this is done in some cases, it may create excessive disinfectant residuals near the feeding point, resulting in taste and odor problems, as well as in the formation of carcinogenic disinfection by-products (DBPs) [
3]. Another possible solution to the problem lies in the use of additional disinfectant booster stations [
4,
5,
6,
7]. However, these solutions cause an increase in installation and operational costs for water utility managers. Furthermore, when critical nodes are scattered over the WDN, it may be infeasible to serve all critical dead-end nodes with a reasonable number of booster stations.
This paper presents a solution to the problem of low disinfectant residual in water systems that have numerous dead-end nodes and water circulation problems. The solution proposed is based on the slight increase in nodal outflows all day long, through the opening of a blow-off at a dead-end node, to obtain a continuous flow. This increase can be obtained by proposing incentives to users, to encourage them to store water in household tanks at remote nodes, to be used for instance for irrigation purposes. Otherwise, a tap can be slightly opened at the hydrant-site in proximity of the generic critical dead-end node. The opening degree of these devices must be modulated in such a way so as to obtain the smallest increase in pipe flow that enables meeting the minimum concentrations of disinfectant at downstream critical nodes of 0.2 mg/L as prescribed by the current regulation. Obviously, nodal pressure deficits must also be prevented when outflows are increased.
2. Methods
The plan of nodal blow-offs to prevent low disinfectant concentrations in WDN can be developed by making use of models that simulate WDN behavior in terms of both flow routing and water quality (disinfectant decay), such as EPANET [
8] or WaterGEMS
® [
9].
In these pieces of software, flow through an open hydrant is simulated as an emitter, with pressure-driven demand Q given by Equation (1):
where
Q is the flow through the hydrant (m
3 s
−1),
e is the emitter coefficient (m
3−n s
−1),
P is the pressure upstream of the hydrant (m) and
n is the emitter exponent (equal to 0.5). Using the emitter object, the flushing outflow rate in the considered node depends on the value of the pressure in each time step.
The modulation of nodal outflows can be tackled as an optimization problem, in which compromise solutions are sought for between two objective functions (f1 and f2) to be minimized.
The first objective function
f1 is to minimize the total volume of water delivered in the network
Vol (m
3), given by Equation (2):
where
qij is the flow rate delivered at the
i-th node (m
3 s
−1),
nn is the total number of nodes, Δ
t the
j-th time step(s) and
NΔt the total number of steps of the simulation. The variable
Vol includes all nodal outflows (leakage from WDN pipes + standard outflow + additional outflow considered for fixing disinfectant residuals).
The second objective function f
2 is to minimize the total mass of chlorine fed into the network
W (kg), given by Equation (3):
where
Ccl is the concentration of disinfectant imposed on supply (kg m
−3). Indeed,
f2 can be simply assessed by multiplying
f1 =
Vol by
Ccl.
The decision variables are Ccl and the values of the emitter coefficients e at the nn critical nodes of the network. These emitters can be considered as elements of a vector e = (e1, e2, …, enn).
Two constraints were considered in the methodology:
- (1)
a minimal residual pressure hmin ≥ 12 + 10 = 22 m (12 m is the height of the average building in the network while 10 m is the surplus of head pressure as prescribed by the Italian guidelines), and
- (2)
the minimum residual chlorine concentration Ccl,min = 0.2 mg/L, as prescribed by the current regulation.
A heuristic procedure was set up in this work to obtain this Pareto front, using the EPANET 2.0 solver in MATLAB environment [
10].
3. Application
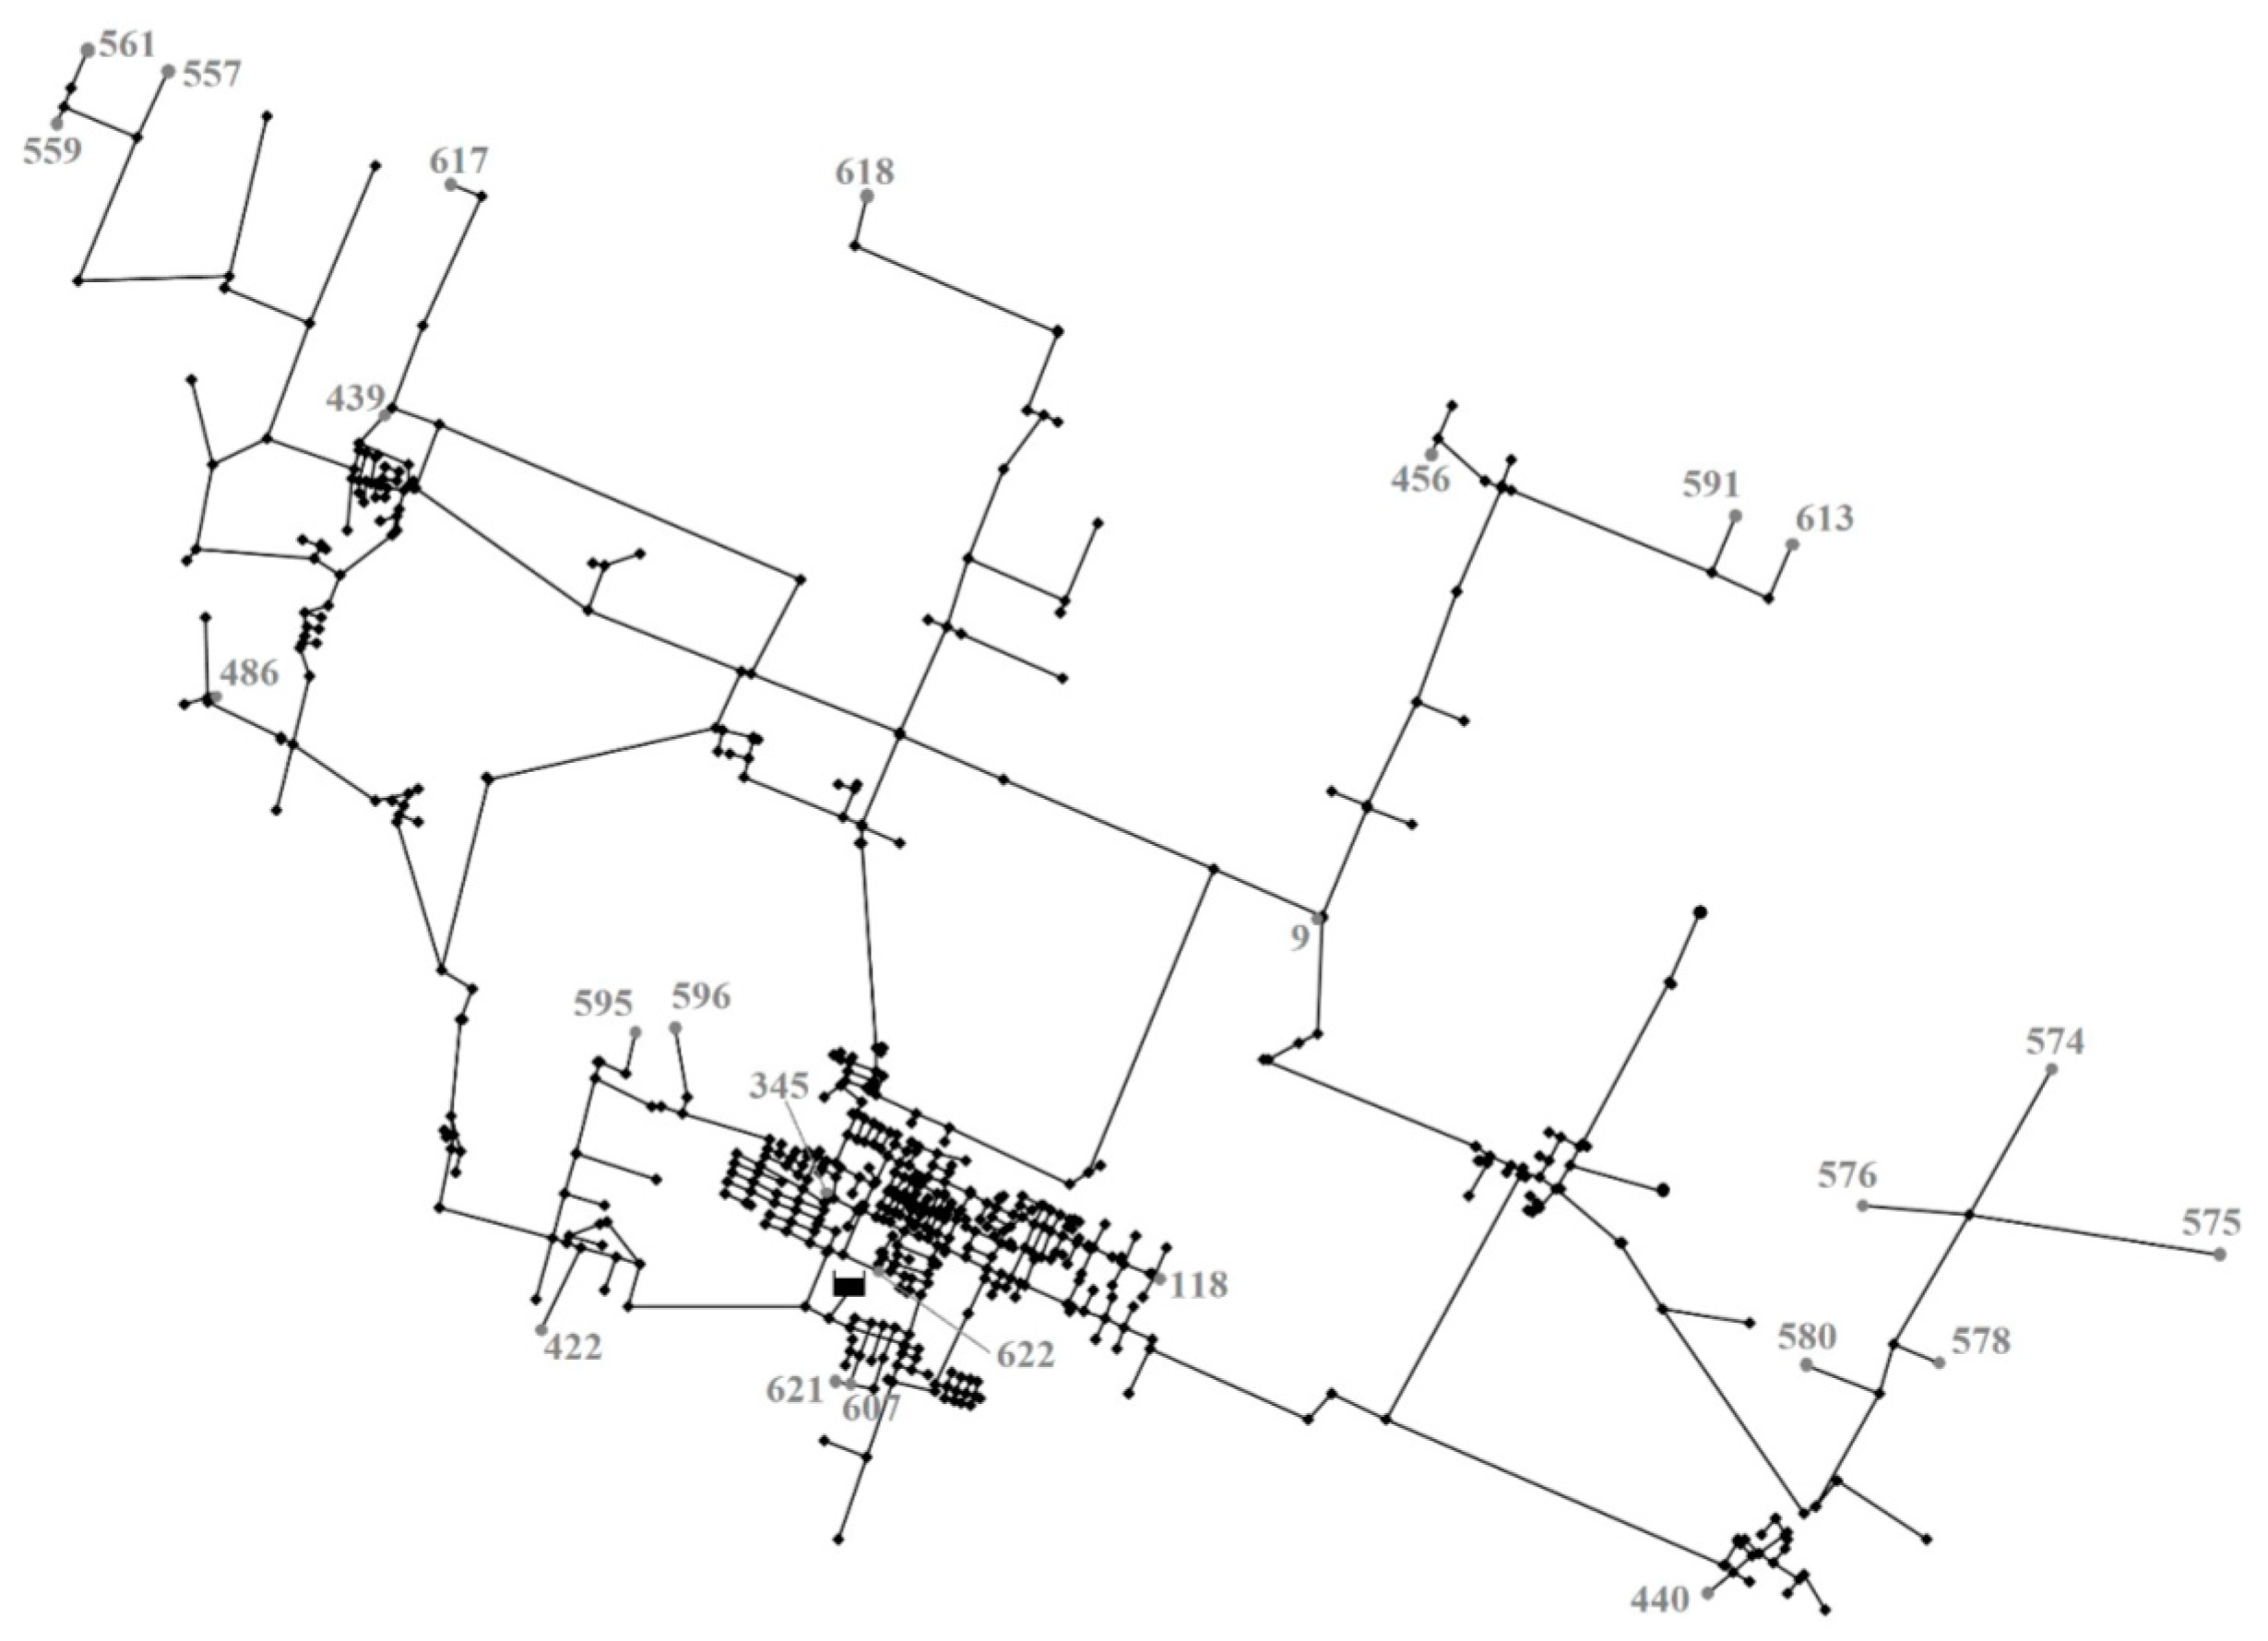
The network model considered in this work is shown in
Figure 1 [
11]. It includes 623 demand nodes, 678 pipes and 1 source node, with total head ranging from 38.00 to 42.00 m.
The network hydraulics are periodic on a 24 h cycle. To represent the daily variation in the users’ demand in the system a pattern was used for the hourly demand with multiplier values ranging from 0.500 to 1.335. The total system demand is 68.54 L/s. WDN emitters were tuned in such a way so as to obtain a percentage of leakage around 20%, consistently with the real WDN.
For water quality simulations, chlorine was chosen as disinfectant. In the chlorine decay simulation, bulk and wall reactions are both first-order. The bulk decay constant (k
b) was assumed to be 1.0 d
−1 from literature for all the links and the wall decay constant (k
w) was assumed negligible because network pipes are made of plastic material (smooth surface of pipes’ internal wall) [
1,
12,
13]. The simulations were run for 10 days of WDN operation using a time step of 1 h, to make sure that chlorine injected close to the reservoir had enough time to reach the final nodes of the network, and to reach well-established cyclical operating conditions in the last day of simulation. The initial chlorine concentration was set at 0 at all WDN nodes.
In an initial exploratory simulation with EPANET, chlorine was injected into the source node with a constant concentration of Ccl = 1.0 mg/L, typical low value used at WDN sources. The software was used to identify the critical nodes, with a residual chlorine concentration below the minimum constraint of Ccl,min = 0.2 mg/L in the last day of WDN operation.
Specifically, 24 nodes were identified with minimum chlorine concentration below 0.2 mg/L. These critical nodes are scattered in the WDN and they are located at various dead ends.
A viable option to correct violations lies in increasing flows constantly at dead-end nodes by opening blow-offs at the critical terminal nodes. To this end, the procedure presented above was applied to the WDN for the following eight values of Ccl = 1, 1.1, 1.2, 1.4, 1.6, 2, 3, 4 mg/L.
4. Results
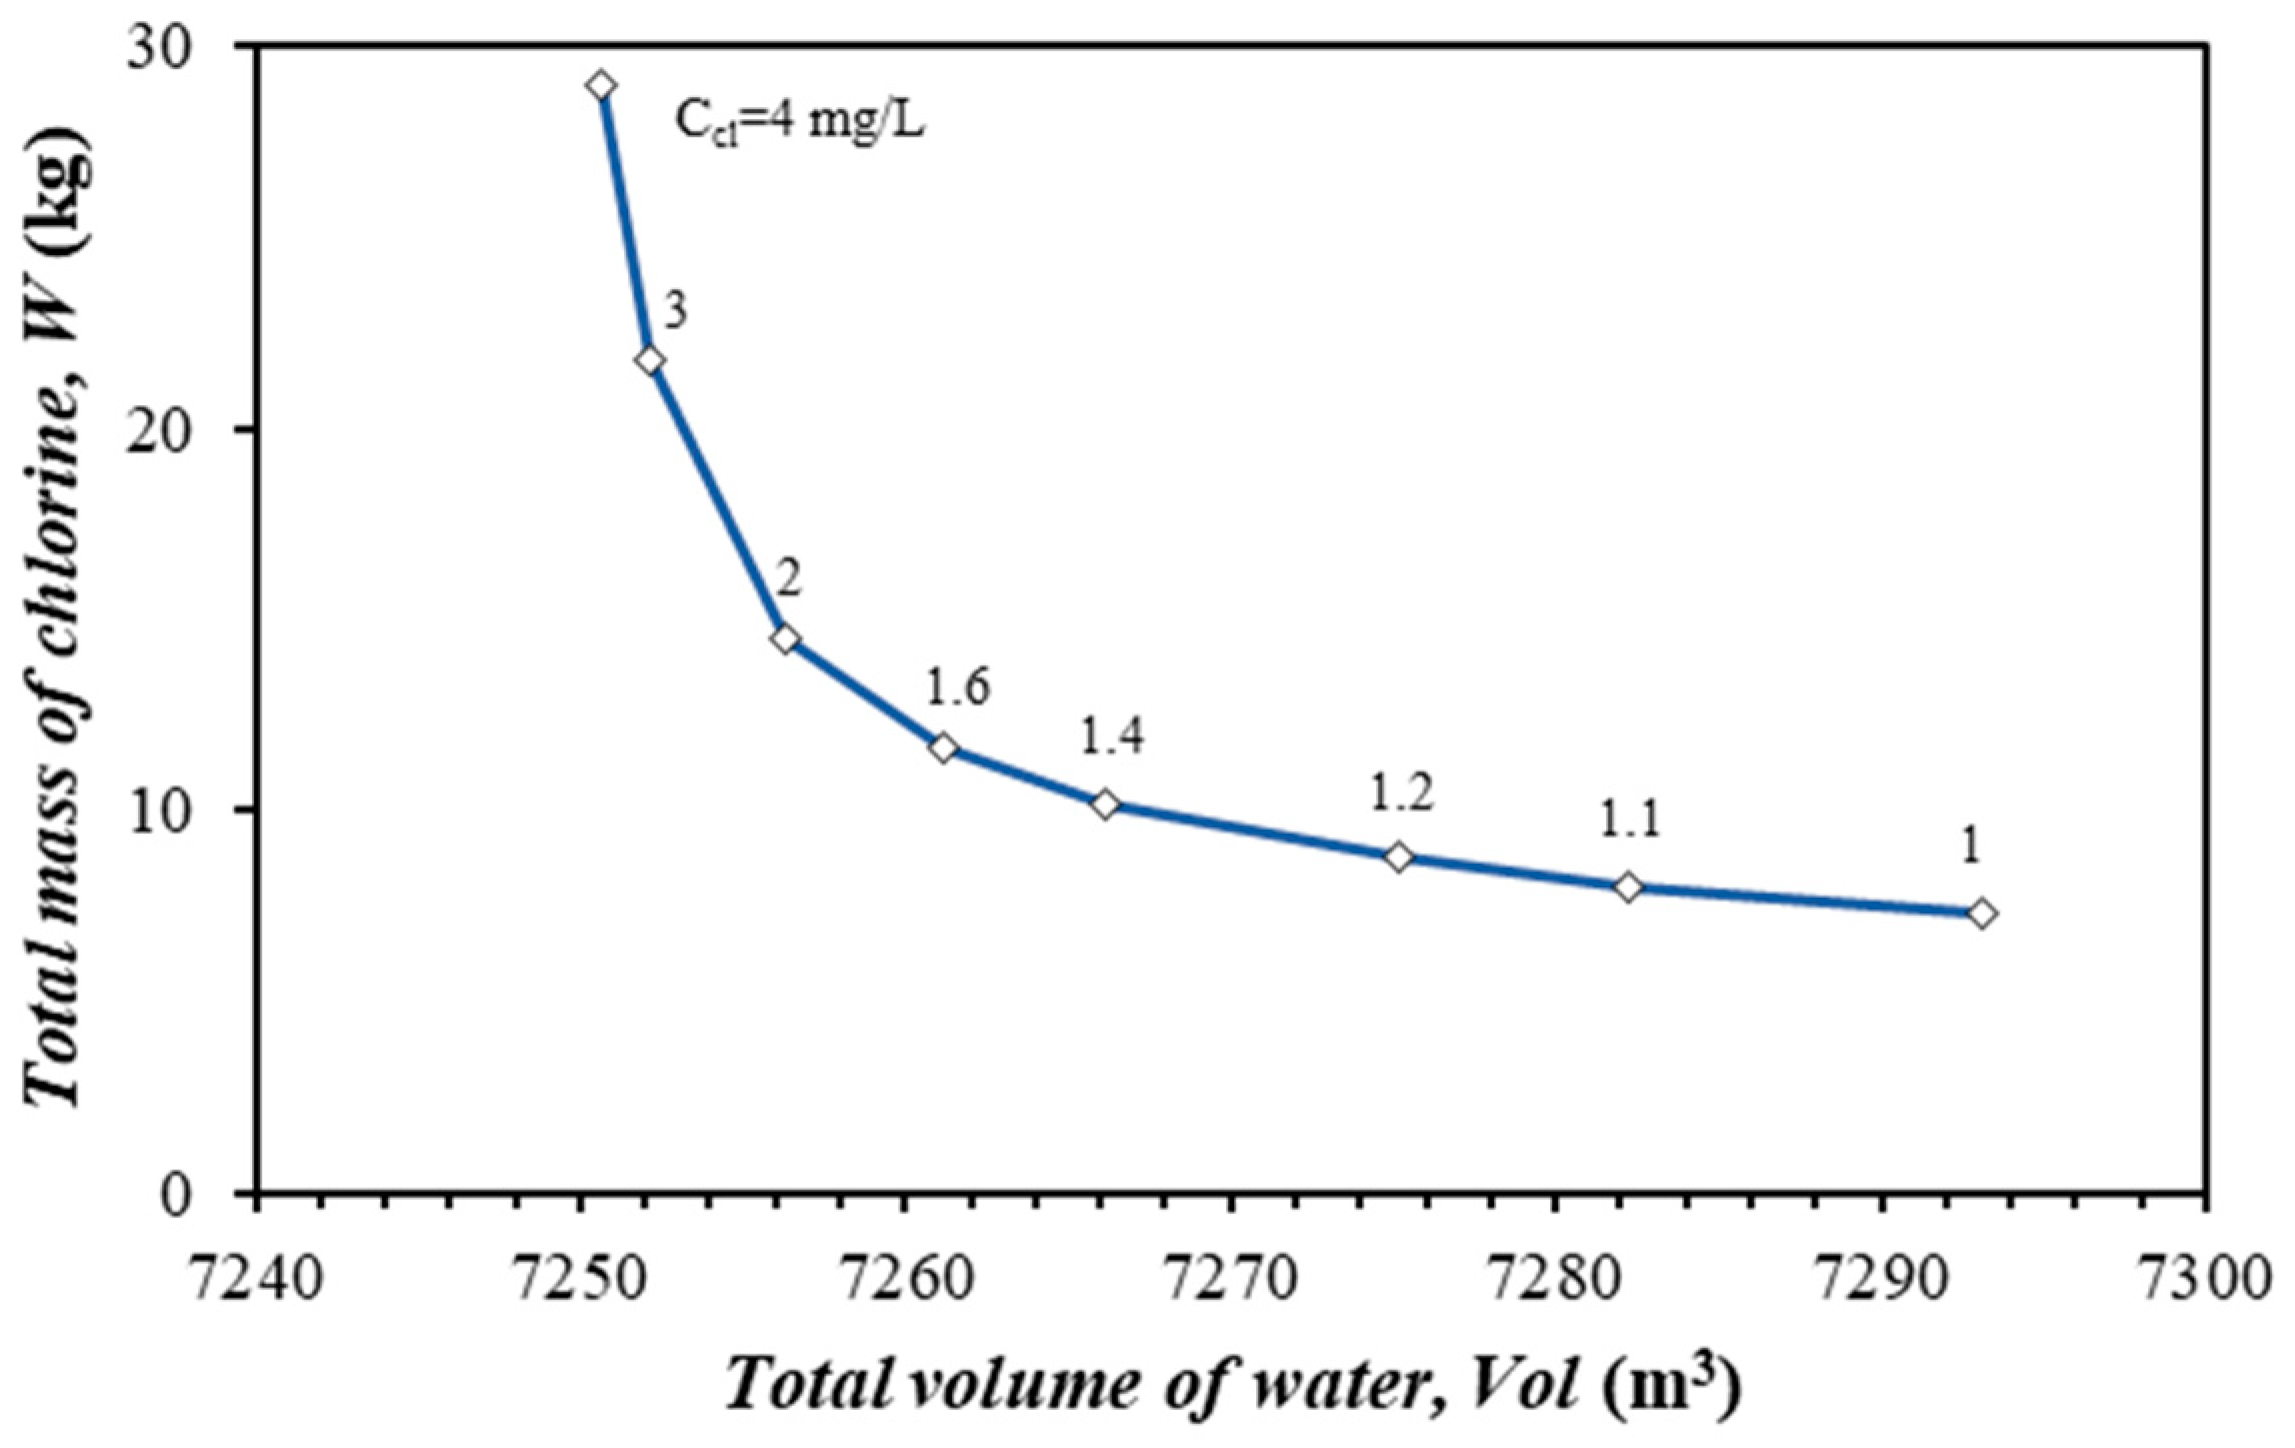
As a result of the optimization problem, the approximated Pareto front of optimal solutions is shown in
Figure 2. In the graph, the total mass
W of chlorine injected at the source is plotted against the total volume
Vol of water delivered in the network (including supply, leakage and additional outflow considered for fixing chlorine residuals).
As expected, the graph highlights that higher values of W are associated with lower values of Vol and vice versa. This contrast is because, when there is no additional outflow (minimum value of Vol), it is necessary to impose high concentrations of chlorine at the source with high W value, to meet chlorine residual requirements even at dead-end nodes. On the other hand, by imposing some additional outflows (high values of Vol) near identified critical nodes, it is possible to obtain the satisfaction of the minimum concentrations of chlorine with low values of W.
Each solution of
Figure 2, featuring certain values of
Vol and
W associated with a single value of C
cl, can be postprocessed for cost analysis, as is shown in
Table 1. The economic analysis was carried out considering a chlorine unit cost of 4.89 €/kg and various values of water unit cost c
w.
The calculations reported in
Table 1 point out that, for the various values c
w considered, the lowest values of C
tot are obtained for low values of chlorine concentration C
cl at the source (≤1.4 mg/L). This corresponds to solutions with lower values of W and slightly larger values of
Vol.
The additional nodal blow-offs can be considered as another kind of water loss, besides leakage along WDN pipes. In
Table 1, the percentage of leakage plus additional nodal blow-off, calculated with reference to the total outflow from the source, only slightly increases compared to the no-dripping scenario (20%). In fact, the maximum value of this percentage is 20.51% (see third column in
Table 1). This means that the slight opening blow-offs for improving water quality at dead-end nodes worsen water losses in the WDN only slightly. However, it must be remarked that the small value of nodal outflows may make the results of this methodology difficult to apply rigorously in the field. It is likely that the opening of hydrants or faucets in the field may cause larger outflows than those required by the methodology.
5. Discussion
Additional simulations were carried out to perform a sensitivity analysis of different parameters. In this context, a single value
Ccl = 1 mg/L was considered for the chlorine concentration at the source since the effects of this parameter were considered above. A range of variation [0.75, 1.25] was considered for both the demand multiplier and the bulk decay constant to analyze the effects of demand seasonality and chlorine decay conditions.
Table 2 shows the number of opened hydrants and the total daily additional outflow that correct chlorine deficits in five different scenarios.
As expected, the decrease in demand and the growth of the bulk decay constant cause the increase in the number of hydrants to open and in the hydrant outflows.
Finally, other simulations were performed to investigate if hydrants running with larger outflow (e.g., 5–10 L/s) can be flowed for a short period instead of dripping hydrants to fix chlorine residuals. However, these simulations proved that hydrants with larger outflow are ineffective at solving the problem of low disinfectant concentrations at some sites, besides causing larger head-losses in the WDN. Therefore, the use of dripping faucets and hydrants should be preferred.


 ,
, 


