Proceeding Paper

Water Leak Detection by Termographic Image Analysis, In Laboratory Tests †

by
Elizabeth Pauline
1,*,
Carreño-Alvarado
1 and
Gilberto Reynoso Meza
2
1
Departamento de Ingeniería Geomática e Hidráulica, División de Ingenierías, Campus Guanajuato, Universidad de Guanajuato. Av. Juárez 77, Zona Centro, C.P. 36000 Guanajuato, Gto., Mexico
2
Industrial and Systems Engineering Graduate Program (PPGEPS), Pontificia Universidade Católica do Paraná (PUCPR), 1155 Curitiba, Brazil
*
Author to whom correspondence should be addressed.
Presented at the 4th International Electronic Conference on Water Sciences, 13–29 November 2019; Available online: https://ecws-4.sciforum.net/.
Proceedings 2020, 48(1), 15; https://doi.org/10.3390/ECWS-4-06440
Published: 15 May 2020
(This article belongs to the Proceedings of The 4th International Electronic Conference on Water Sciences)

Abstract

:
One of the most undesirable failures is water loss due to leaks in the supplying system; there are mainly two types of water losses: the visible and the non-visible. Within the non-visible we have those that are detectable by acoustic methods and those that are not. Here we decide to study new techniques for leak detection, since non-visible leaks are more difficult to find (detect). This is the aim of this paper. In a previous stage we have been studying the possibility of obtaining thermographic images to develop visualization techniques on pipes as an option for leak detection. Analyzing this possibility, with previous studies we have established conditions for taking images for later analysis, which has confirmed the benefits of the use of thermography as a tool. Here we present a case study where images were taken in a controlled atmosphere in a laboratory, using a physical model that contained a buried pipe with a simulated loss of water. During the entire duration of the test, images were taken at a certain interval of time and afterwards the images were analyzed. The results show the benefits and limitations of the technique, which should continue to be studied since thermal imaging cameras and computers to process the images are becoming more powerful and accessible by the day.

1. Introduction

Thermography has shown to provide significant applications in various fields, such as medicine [1], engineering, industry and so on [2]. The laboratory tests have shown too, the benefits of knowing results of real data tested. Thermal cameras enable the investigation of some elements invisible to a simple eye at a lower cost, when compared with other current non-destructive methods [3]. Trying to identify water leaks in pipes by the use of non-destructive methods is a challenging task for utility companies, such as water supply systems. Thermographic images may produce rich information, which unfortunately, is not always visible [4], several factors can affect the visualization in infrared images, which can’t improve contrast in infrared images, such as weather, humidity, wind or elements with (high or low) unusual temperature; also with an untrained eye it might be difficult to determine whether something happens in the image. The aim of this paper is to discuss the benefits of lab test with thermographic images as a non-destructive method [5]. Thermography can be a good ally in non-destructive methods application: it has shown be useful, efficient and cheaper than others but this may make some inversions on this kind of project.

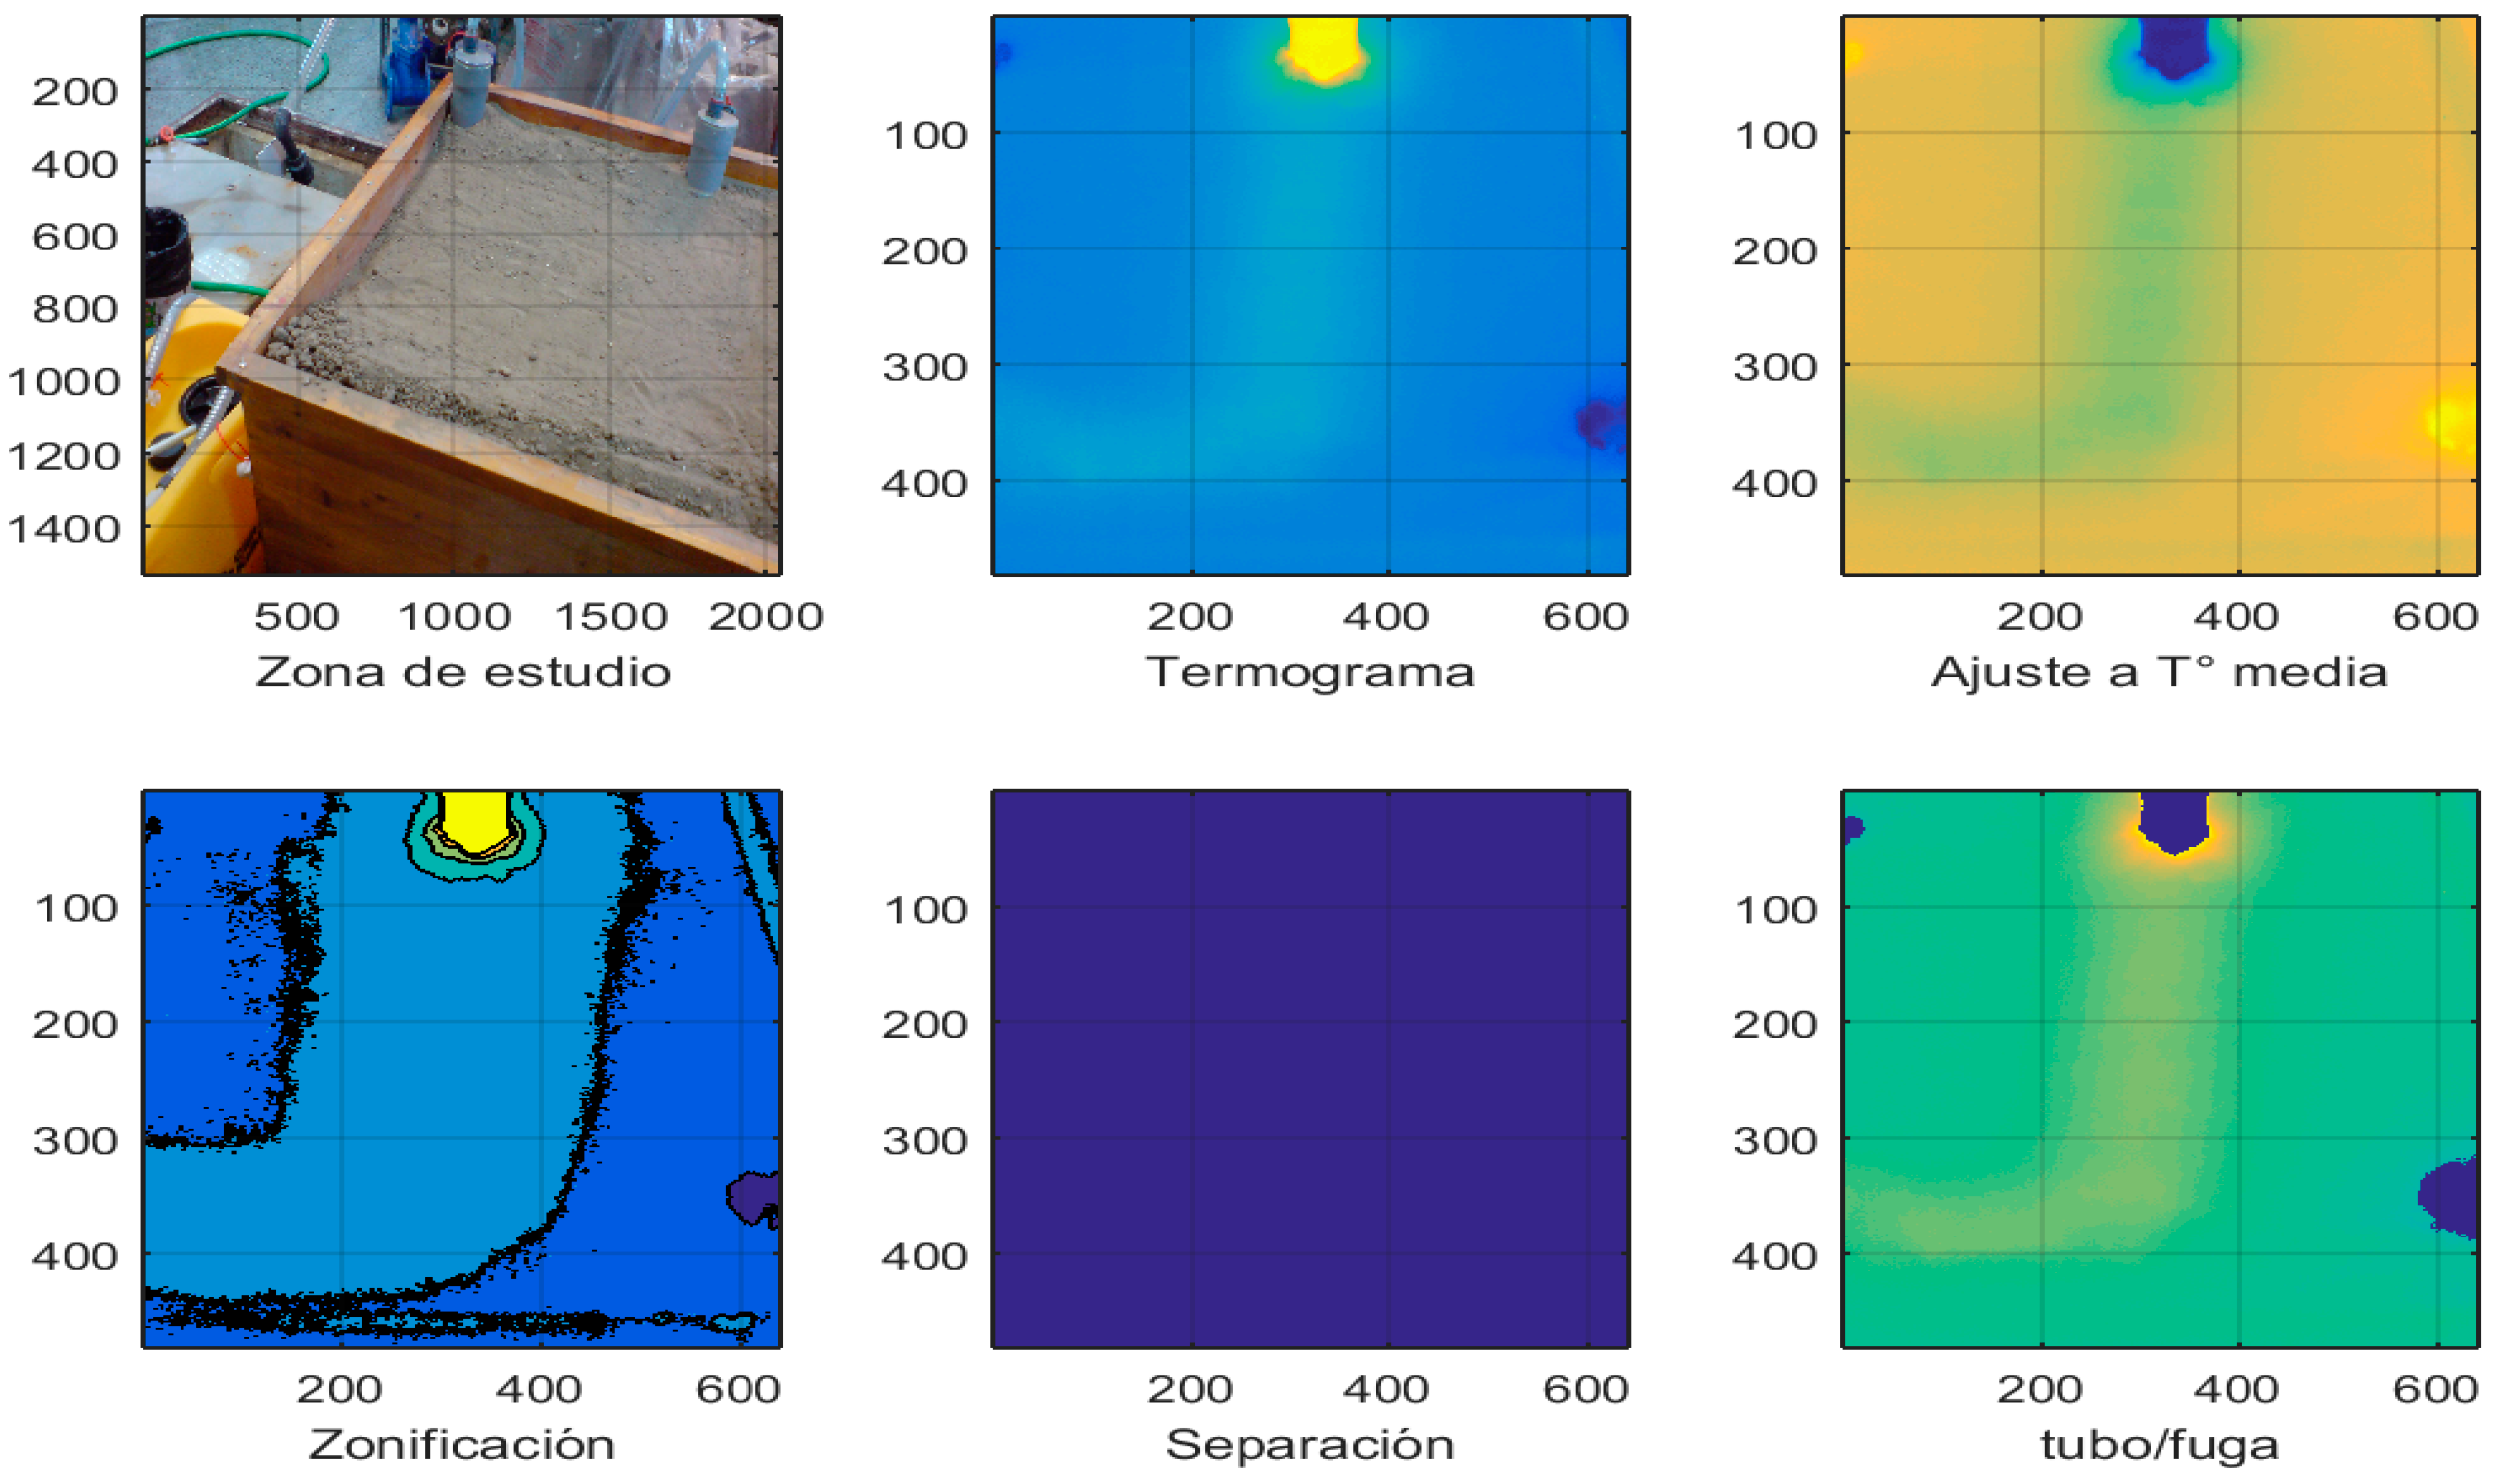
2. Results Processing Images

In general, it can be deduced that at a higher environmental temperature, the images become saturated and the visualization is poorer [6]. More particularly, from the non-variant conditions on the images such as those taken on the model in controlled laboratory conditions that generated a uniform temperature atmosphere, it can be seen in the images where the heat transfer has less changes. Of course, this does not always allow accurate work as the expected results may be skewed.
It happens, as shown in Appendix A, that under a controlled environment such as the test Mr-4; for some processes the results are quite good, but in test Mrf-2, the results weren’t enough because it was not possible to observe the pipe, just the developed leak. It must be noticed that it was necessary for at least a month to prepare another test, thus affecting the possibility of additional tests.

3. Discussion

Thermography as a Non-Destructive Test (NDT)

The thermography has a facility to capture big areas without contact [7]. It works by thermal difference and for this reason we choose it for our purposes [8]. It has three levels of measurement: relativity, differential and absolute; also, it has two principal kinds passive and active. It is a multifaceted technique for evaluation, for example: QIT (Quantitative Infrared Thermography), END (Evaluation No Destructive) or NETD (Noise Equivalent Temperature Difference), among others; QIT and END were used as part of our tests in the processes.
As an NDT, the technique has advantages and disadvantages. Nevertheless, given that its positive aspects exceed the negatives, we decided to use it an NDT tool [9] for leak detection. It can be used the IR images (.jpg) with RGB scale or Grayscale and the thermograms that contain a temperature data per pixel in the image (matrix format) generate a lot of valuable information; both were used on the different processes on our tests.

4. Materials and Methods

4.1. Laboratory Model (Case of Study)

The knowledge about the water distribution system (WDS) sometimes is limited because of different changes in the net, sectorization, and data in the net that has not been actualized, among others. When a leak appears, the time to detect it plays an important role [10]; the faster it is detected, the less water is lost. Working with IR images as a non-invasive method, is a tool that save time and money, working just with the images taken that isolate zones to study a part of the pipe. To prove this hypothesis, it was necessary to divide the work with the physical model in different tests [11,12].
The physical model as show in Figure 1, is a simple box, with dimensions 100 × 100 × 70 cm, filled with earth material similar to the filler, that let us imitate the working conditions of a pipe in a WDS. Two conditions were simulated: (1) a gravity condition and (2) a pressure condition with a closed re-circulating water circuit, both first working without leak and after with leak. Notice that the second condition was the most representative for the aim of this paper. For this reason, just the results for the second experiment are shown.

4.2. Quality Image Taken and Its Variables for Leak Analysis Detection

We work with the camera FLIR series 600, model FLIR sc620. In fact, we were working with the camera a few years ago, on different tests made with different aims; those are shown in the Table 1. After those tests, the model was defined and projected; eleven tests were designed for this. Once the model was prepared, the camera was placed following all the specifications for quality images, always at the same distance of the model. The time between images was the minimum (10 sec), the climate variables were compilated (day temperature, humidity, wind) [13], the resolution of the images chosen was 640 × 480 pixels, a size adequate for being not too big and to conserve enough of the data. The database created for climate variables with k-nime software was considered. Just 10% of the images were analyzed in order to improve the process.
Table 1 shows all the tests made before to work with the laboratory model, observe that many tests were made for the model. In Appendix A are presented the results of the representative tests for the aim of this paper.

4.3. Image Processing

The aim of the IR processing is the leak visualization [14]; because of this the technician must be the same when processing all the images in order that the criteria do not change. In the IR images we considered the following processes: Visualization, Segmentation, Binarization, Otsu’s method and thresholds. For the IR thermograms the Flir software and MATLAB algorithms were used, which involves choosing a point with a representative temperature and comparing it with the medium temperature of the annual historic database (from year 2012 to 2016) to delimitate the zone where structure lays, as showed at Figure 2.

5. Conclusions

Thermography offers a great possibility as a NDT, but it is still being developed. With its potential growing by the years, it will become a more powerful tool for NDT techniques in different fields or with different objectives, such as fire detection at the Urban-forest interface [15]. Thermography is a polyvalent tool with a lot of advantages: it can be practical, cheap and useful; it might be not a 100% perfect technique, but it can be complemented with others [16].
The image analysis is subjective with a lot of elements that must be continuously considered. Regarding the camera: focus, tuning variables, distance of the study object are important factors. About the place of study: clime, wind, humidity, choosing the appropriate environment, improving the visualization, etc. Taking clear and well oriented images is of the utmost importance, equipment and structures to place the camera would be useful to obtain better images on the study area
Working with environmental variables let us isolate a periodic phenomenon to assist on zone determination using IR images but it happens too that in developed leaks it is harder its application due to the thermal equilibrium of the materials. It is necessary to invest more time and resources in this kind of project, due the leak developed on Mrf-2, and to discover more information about the relation between the time getting images and the time of leak developed. To avoid errors about IR interpretation the capacitation is really beneficial in order to identify all the valuable information in the image [17]. This means that the person involved in this kind of process should take periodic training and must manage the camera on a regular basis.
Thermography is a punctual tool: it must be used in the moment in a specific place. For this reason, it still needs be used with other techniques, to solve problems and give us options for leak detection. It is necessary to continue working with models, or use complementary alternatives such as machine learning [18].

Abbreviations

The following abbreviations are used in this manuscript:
NDTNon-Destructive Test
WDSWater Distribution Systems
IRInfrared
QITQuantitative Infrared Thermography
ENDEvaluation No Destructive
NETDNoise Equivalent Temperature Difference

Appendix A. Test ID: Mr-4

Description: The water was on recirculation until stabilization.
Date: 17 August 2016; autumn.
Time: 13:17 h.
Environmental temperature: 29.1 °C.
Umbral: 105.
Notes: The pipe is able to observe once the image has been processed. The Otsu’s method can’t isolate the pipe region. The rest of the processes can isolate the studies’ zones and delimitate the contour of the pipe. The pipe has not leak.
Figure A1. Termogram results with MATLAB algorithms. Test ID: Mr-4.
Proceedings 48 00015 g0a1
Figure A2. Image result as QIR in (a) processed with FLIR software (Greyred scale) in (b), and the result of the Otsu’s method in (c). Test ID: Mr-4.
Proceedings 48 00015 g0a2
Figure A3. Image results with Binarization process. Test ID: Mr-4.
Proceedings 48 00015 g0a3
Figure A4. Image results with MATLAB algorithms. Test ID: Mr-4.
Proceedings 48 00015 g0a4

Appendix B. Test ID: Mrf-2

Description: The water was on recirculation, the pipe star working with a leak.
Date: 10 September 2016; autumn.
Time: 11:55 h.
Environmental temperature: 27.2 °C.
Umbral: 45.
Notes: The visual inspection shows clearly the contour of the leak. On this test was notice that the time of leak developed was faster that the take of the image, for the size of the model and the pressure of the leak is necessary a more potent infrared camera. Due the immediately leak developed was not possible to get more information, just the contours of the change of temperature of the water and the material were the pipa lays. The processes were very different; however the isolate of the study zone can be appreciated very well.
Figure A5. Image result as QIR in (a) processed with FLIR software (Yellow scale) in (b), and the result of the Otsu’s method in (c). Test ID: Mrf-2.
Proceedings 48 00015 g0a5
Figure A6. Image results with Binarization process. Test ID: Mrf-2.
Proceedings 48 00015 g0a6
Figure A7. Termogram results with MATLAB algorithms. Test ID: Mr-4.
Proceedings 48 00015 g0a7
Figure A8. Image results with MATLAB algorithms. Test ID: Mrf-2.
Proceedings 48 00015 g0a8

References

  1. Termograf, E.E.N.; Revillas, S.M.; Energ, G.; Ii, N. La Termografía Infrarroja y el deporte de alto rendimiento; Military Institute of Armament Technology: Zielonka, Poland, 2012. [Google Scholar]
  2. Santulli, C.; La, R. IR Thermography for the Detection of Buried Objects: A Short Review 1. Introduction Studied. A Large Number of Scientific Papers are Available, a List of which, Including Considerations Application-Related Factors, in Particular the State of Environ; Università di Roma: Roma, Italy, 2003. [Google Scholar]
  3. Shepard, S.M.; Wang, D.; Lhota, J.R.; Ahmed, T.; Rubadeux, B.A. Parallel processing and analysis of thermographic data. Rev. Quant. Nondestr. Eval. 2002, 21, 558–563. [Google Scholar]
  4. Carreño-Alvarado, E.P.; Ayala-Cabrera, D.; Pérez-García, R.; Izquierdo, J. Identification of buried pipes using thermal images and data mining. In Proceedings of the 16th Conference on Water Distribution System Analysis, Bari, Italy, 14–17 July 2014. [Google Scholar]
  5. Dudić, S.; Ignjatović, I.; Šešlija, D.; Blagojević, V.; Stojiljković, M. Leakage quantification of compressed air using ultrasound and infrared thermography. Measurement 2012, 45, 1689–1694. [Google Scholar] [CrossRef]
  6. Mollmann, M.; Vollmer, K. Infrared Thermal Imaging: Fundamentals, Research and Applications; Wiley: Hoboken, NJ, USA, 2014; Volume 1. [Google Scholar]
  7. Holst, G.C. Common Sense Approach to Thermal Imaging; SPIE Optical Engineering Press: Bellingham, WA, USA, 2000. [Google Scholar]
  8. Yin, Z.; Collins, R. Augmented Vision Perception in Infrared; Springer: Berlin, Germany, 2009. [Google Scholar]
  9. Balageas, D.L. Termografía Infrarroja: Una Técnica Multifacética para la Evaluación No Destructiva (END); ONERA (The French Aerospace Lab): Châtillon, France, 2007. [Google Scholar]
  10. Izquierdo, J.; López, P.A.; Martínez, F.J.; Pérez, R. Fault detection in water supply systems using hybrid (theory and data-driven) modelling. Math. Comput. Model. 2007, 46, 341–350. [Google Scholar] [CrossRef]
  11. Swiderski, W.; Hlosta, P.; Miszczak, M. IR Thermography methods in detection of buried mines. Proc. SPIE Int. Soc. Opt. Eng. 2012. [Google Scholar] [CrossRef]
  12. Carreño-Alvarado, E.P.; Ayala-Cabrera, D.; Pérez-García, R.; Izquierdo, J. Identificación de tuberías enterradas mediante termografía. In Proceedings of the XXV Congreso Latinoamericano de Hidráulica, Santiago, Chile, 25–29 August 2014. [Google Scholar]
  13. UPV Data. Available online: http://dataupv.webs.upv.es/datos-historicos-de-la-observacion-meteorologica-en-valencia/ (accessed on 11 March 2017).
  14. Atef, A.; Zayed, T.; Hawari, A.; Khader, M.; Moselhi, O. Multi-tier method using infrared photography and GPR to detect and locate water leaks. Autom. Constr. 2016, 61, 162–170. [Google Scholar] [CrossRef]
  15. Metola, D.R.; Martínez, F.; Valencia, A. Departamento de Ingeniería Hidráulica y Medio Ambiente; Universitat Politècnica de València: Valencia, Spain, 2009. [Google Scholar]
  16. Astarita, T.; Carlomango, G.M. Infrared Thermography for Thermo-Fluid-Dynamics; Springer: Berlin, Germany, 2015; Volume 1. [Google Scholar]
  17. Minkina, W.; Dudzik, S. Infrared Thermography, Errors and Uncertainties; Wiley: Hoboken, NJ, USA, 2009. [Google Scholar]
  18. Živčák, J.; Hudák, R.; Madarász, L.; Rudas, I.J. Methodology, Models and Algorithms in Thermographic Diagnostics; Springer: Berlin, Germany, 2013; Volume 5. [Google Scholar]
Figure 1. The laboratory model working with the Thermographic camera.
Proceedings 48 00015 g001
Figure 2. Process followed for taking images on the laboratory model.
Proceedings 48 00015 g002
Table 1. All the tests performed during the investigation.
IDImages TakenDate
(day/month/year)
Study PlaceObjective
T-11815/10/2013Different places in the UPVCamera control
St-35901/10/2014 a 17/02/2014Site 3 previously chosenIdentify buried structure
St-45210/01/2014Site 4 previously chosenIdentify buried structure
St-267218/10/2013 a 17/02/2014Site 2 previously chosenIdentify buried structure
Exp-1817/01/2014Esplanade UPVIdentify buried structure
Mg-12402/07/2015Laboratory model: Gravity pipeIdentify buried structure
Mp-12416/07/2015Laboratory model: Buried thermic objectsDeterminate the buried colocation distance
Mgf-19807/10/2015Laboratory model: Gravity pipe with leakIdentify buried structure and leak
Mgf-21008/10/2015Laboratory model: Gravity pipe day afterIdentify buried structure and leak
Mr-15113/06/2016Laboratory model: Recirculating pipe, cover surfaceVariable study
Mr-23930/06/2016Laboratory model: Recirculating pipeVisualize behavior
Mr-38303/08/2016Laboratory model: Recirculating pipe, thermic contrastVariable study
Mr-42504/08/2016Laboratory model: Recirculating pipeVisualize behavior
Mr-46016/08/2016Laboratory model: Recirculating pipe, thermic contrastVisualize behavior
Mrf-11523/09/2016Laboratory model: Recirculating pipe with leakIdentify buried structure and leak
Mrf-21510/09/2016Laboratory model: Recirculating pipe with leakIdentify buried structure and leak
Publisher’s Note: MDPI stays neutral with regard to jurisdictional claims in published maps and institutional affiliations.

