Abstract
The success of the analysis and design of a Water Network (WN) is strongly dependent on the veracity of the data and a priori knowledge used in the model calibration of the network. This fact motivates this paper in which an off-line approach to verify data-sets acquired from WN is proposed. This approach allows the data separation of abnormal and normal events without requiring high expertise for a large raw database. The core of the approach is an unsupervised classification tool that does not requires the features of the different events to be identified. The proposal is applied to data-sets acquired from a Mexican water management utility located in the center part of Mexico. The data-sets were pre-processed to be synchronized since they were recorded and sent with different and irregular sampling times to a web platform. The pressures and flow-rate conforming the data-sets correspond to dates between 25 June 2019 @ 00:00 and 25 September 2019 @ 00:00. The district metered area (DMA) is formed by 90 nodes and 78 pipes and it provides service to approximately 2000 consumers. The raw data identified as generated by abnormal events were validated with the reports of the DMA managers. The abnormal events identified were communication problems, sensor failures, and draining of the network reservoir.
1. Introduction
Data acquisition systems in WNs collect measurements from the in-situ sensors and transform them into mathematical values that represent a physical quantity. This value set -known as raw data- must be validated before being used for network operation purposes or statistics studies to assure the reliability of the captured information. Some common problems caused by sensors malfunctions are offset, drift, and freezing of the measured variable [1]. Moreover, data from abnormal events that occur in the network must be identified to avoid incorrect studies and the construction of false models.
In general, WN operating data are required to build mathematical and data- driven models which are significantly affected by the uncertain demand patterns and the quality of the data used in the model calibration [2]. Thus, if raw data are not validated before they are used for diverse purposes, the resulting studies and models could not be representative of the real behavior of the network in normal operating conditions. Previous contributions have proposed data validation techniques for on-line applications [3,4]. These proposals, however, require large data sets of nominal operating conditions to identify a validation model. Therefore, from practical point of view, it makes more sense to validate, as a first step, the raw data in any study of WNs.
In view of the forgoing arguments, this paper presents a semi-automatic procedure for off-line validation of raw data acquired from WNs. The procedure, based on Artifical Intelligence tools, consists of four steps that require minimal setup and it allows to classify the data associated with the nominal behavior of the network from the data which are generated from abnormal events. The procedure is applied to validate data acquired from a real DMA called El Charro which is located in a small city in Mexico. It is demonstrated hereafter that it is possible to identify different anomalous events which do not correspond to the behavior of the normal consumers.
2. Case Study: El Charro DMA
The proposed procedure is applied to a raw database coming from a district metered area (DMA) located in a small city in the center part of Mexico. El Charro comprises a middle-class neighborhood, a public hospital and a bus station. The EPANET layout of the DMA an their main characteristics are presented in Figure 1.
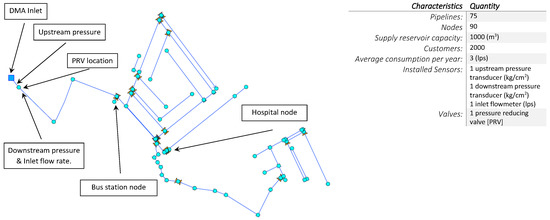
Figure 1.
EPANET layout of the DMA El Charro.
The raw database or sample set denoted is composed of upstream and downstream pressure as well as flow-rate data, which were recorded and sent to a website platform from an IoT (Internet of Things) station that is located at the inlet of the DMA. The corresponds to dates between 25 June 2019 @ 00:00 and 25 September 2019 @ 00:00. The pressures and flow-rate records were sent to the website platform by different non-synchronized telemetry devices with irregular intervals between 10 and 11 minutes. Thus, the database was pre-processed to have the same dimension with a regular (uniform) time separation for the three variables of .
The pre-processing is achieved in two steps. Firstly, the set of samples for each month were linearly interpolated considering that the estimated values are separated by a regular (uniform) period of time [5]. Secondly, a univariate test was performed to remove values of the data that lies far from the means. This step is designed according to the expert knowledge about the physical variables from the Mexican DMA. Here the univariate estimation for the flow rate lower than the minimum night flow is applied. Thus, were replaced by the interpolated value from the previous and after values and respectively. Thus, these preprocessing steps generate the new array it is the input array of the validation process with three rows for the three months of register data of the DMA.
3. Clustering Procedure
The unsupervised clustering algorithms can be considered as systematic computational processes used to handle huge of data which can be classified according to their similarities and differences without a priori knowledge of the classes of groups [6]. Thus, a clustering process can be used in a WN to reveal the organization of patterns into groups and to separate normal data from abnormal data.
The proposed procedure is described in Figure 2. The first step, as usual, involves data pre-processing methods to perform the following tasks: normalization, noise filtering, missing data recovering and so on [5]. For the El Charro DMA the pre-processing task was explained in the previous section. Feature selection, which is the second step, consists of determining the features of the pre-processing data set to be analyzed. In our case, we only considered the straightforward values of the variables. Thus, the feature array is given by .
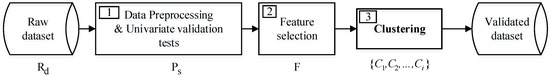
Figure 2.
Off-line raw data validation procedure.
Step 3, which is the main contribution of this paper, consists in the use of unsupervised machine learning techniques to do anomaly detection. The goal of the anomaly detection task is to isolate the events in the data-set which do not correspond to the normal consumption of the users. This is a fundamental problem because if the data-set is not validated then it cannot be used for water modeling tasks, i.e., demand modeling, WN model calibration, etc. Finally, in step 4, the resulting clusters that represent the normal consumption patterns are integrated into a single data set.
Clustering Patterns with DBSCAN
DBSCAN (Density-Based Spatial Clustering of Applications with Noise) is a non-parametric, density-based clustering technique [7]. Namely, the goal of the algorithm is to partition the data set formed by the feature array F into sub-sets. In this work, an object is understood as a feature observation for all . This method in particular identifies regions in the data space with a high density of objects.
To define a cluster by considering the n observation set with , the concept of Neighborhood and Density reachable objects are required [7]
Definition 1
(Neighborhood of ). The neighborhood of object denoted is defined by the set of objects such that a proximity measure between and is satisfied. This means that where is a user-defined threshold that characterizes the size of the neighborhood. In this context, all are called neighbors of .
An object is called core-object if the number of objects in its neighborhood is larger than a user-defined number . The rest of objects inside the neighborhood of a core-object are called border objects.
Definition 2
(Density reachable objects). If there exist a set of core-objects which are neighbors then any object of their respective neighborhoods is density reachable by any of the core-objects.
Definition 3
(Cluster). In the framework of DBSCAN, a cluster is defined by the set of density reachable objects .
In general, if after processing all objects in F an object is not density reachable it is considered as an outlier or unstructured data. From the above definitions one can see that two parameters define a cluster: and . The former one defines the minimum number of objects required to consider the existence of a cluster, and the latter characterizes how close must be these objects in the data space. The DBSCAN algorithm is shown in 1.
| Algorithm 1: DBSCAN Algorithm |
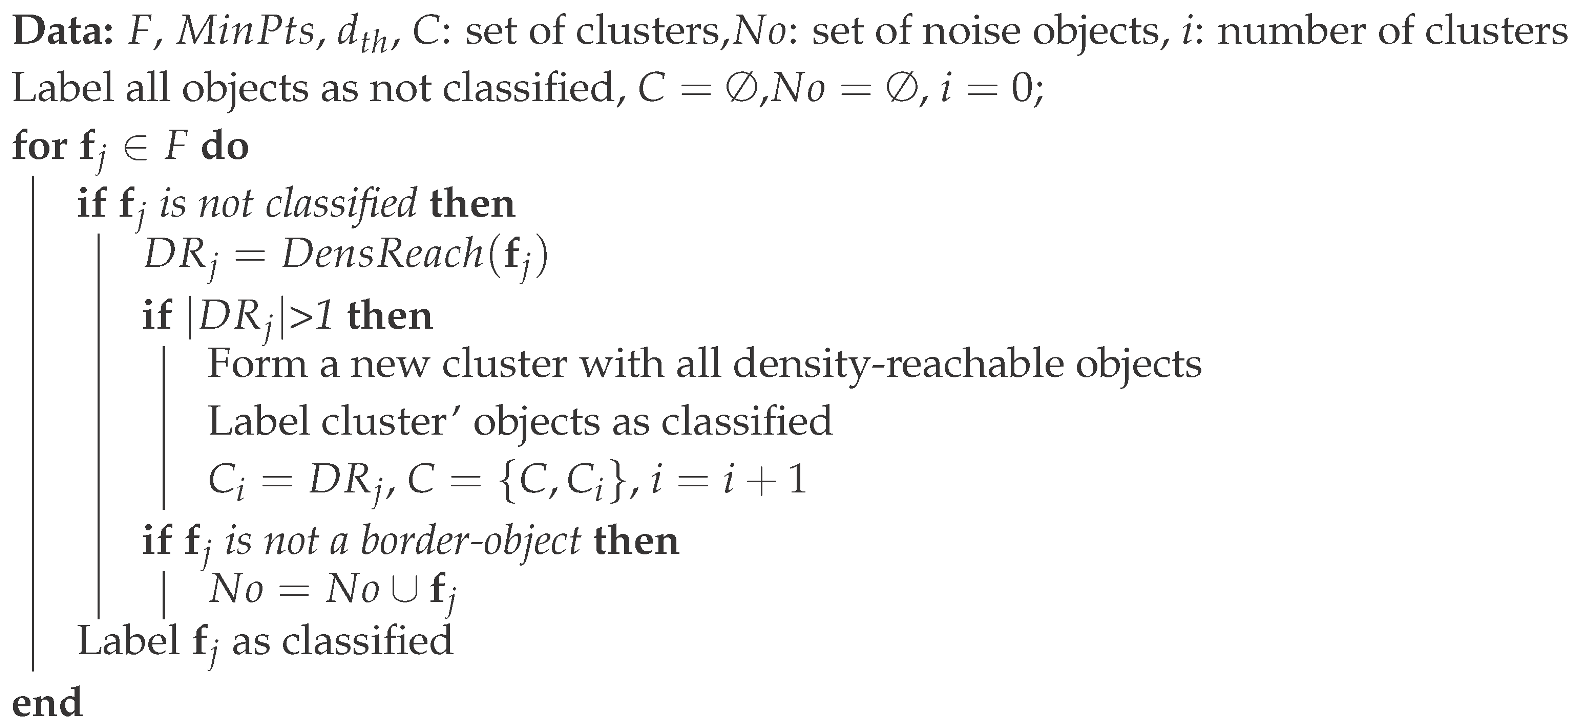 |
For the application of DBSCAN to data from a DMA we considered that the minimum number of observations that form a pattern are defined by the duration of the minimum night flow (MNF) regime corresponding to the time period from 3 am to 6 am. Given that the sampling time of our system is approximately 10 min a minimum of observations is selected such that any cluster satisfies the condition .
The applied steps for the search of the threshold are summarized as follows and the specific graphic for the El Charro is shown in the left plot of Figure 3.
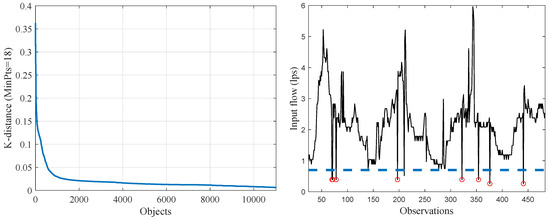
Figure 3.
Partial results of parameters and data of the DMA: (a) Sorted objects vs K proximity metric with a minimum cluster of 18 objects; (b) Preprocessing flow rate considering the MNF for a time window of 450.
- Compute the distances of each object with respect to its nearest neighbors and sort them in ascending order, for all objects.
- Define the distance that corresponds to the position of the classification, for all objects.
- Sort all the measures according to the magnitudes in descending order and plot them according to it respective magnitude.
- Choose -metric where the sorted object and the K-metric is given by the first valley.
4. Results and Discussion
This section describes the main results of the validation process for the data and discuss the performance of the proposition by considering the study case. To clearly visualize the effects of data management, only short time windows are shown in the figures.
A time series of 450 interpolated and synchronized values is shown in the right side of Figure 3. The blue line corresponds to the value of the MNF regime and data below this value were replaced by interpolated data and marked with the symbol ∘ in the graphic. One can see that the circles are isolated points and without any dynamic. Thus, these do not correspond to abnormal event.
By applying the DBSCAN algorithm to all the array F, two clusters were obtained in the data space. To clarify the interpretation of the results the projection of the two identified clusters in each plane of F are shown in Figure 4. The ∘ symbol in red color denotes an object in the normal cluster and the × symbol in blue color means abnormal event. Thus, the cluster that represents the normal consumption is identified and the other cluster is separated with unstructured data that represents anomalies. The classified data shown in the three projections indicates the relationship between three features of the measured variables: the upstream pressure, which is measured before a pressure reducing valve (PRV) installed at the DMA inlet, the downstream pressure, which is measured after the PRV, and the flow rate, which is measured after the PRV and whose behavior depends on the demand for water by the DMA users.
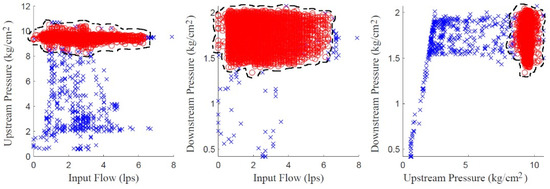
Figure 4.
Data space projections of the features: Normal condition red ∘, Anomalies conditions blue ×.
The three projections shown in Figure 4, respectively, the following relations: upstream pressure-flow rate, downstream pressure-flow rate and downstream pressure-upstream pressure. In the left plane it can be noted that there are many data that indicate that the behavior of the flow rate is not related with the upstream-pressure normal behavior since it is not feasible a low pressure with a relative high flow. This situation is not perceived in the center graph plane, since the number of data showing a disassociation between the flow-rate behavior and the downstream-pressure behavior is smaller. This is an indicator that an abnormal event is out of the network. Finally, in the right graph plane a large amount of data can be seen that highlights an anomalous condition between the upstream pressure and the downstream pressure. Thus, it is concluded that the abnormal event is associated with a low upstream pressure.
To analyze the data results in the time domain, windows from the samples 1700 to 2400 identified as abnormal data are shown in Figure 5. The abnormal event produced a sharp upstream pressure drop and deviations in both directions of the flow rate. On the contrary, the downstream pressure is only reduced drastically in a small sample interval. These behaviors of the variables can be diagnosed as a reservoir draining. This analysis is coherent with the cluster remarks made by analyzing Figure 4. This conclusion was verified with the operator register. Therefore, the tank draining behavior has been isolated from the normal events. This subset of data cannot be used to model the nominal behavior of the network. Thus the data corresponding to these time periods should not be used for any study of the DMA, except for fault diagnosis purpose.
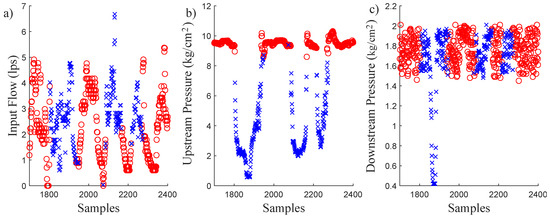
Figure 5.
Classified raw data produced by reservoir draining.
Since downstream pressure and flow are measured after a PRV, and since the relationship between both variables seems to have only one pattern, one can infer that an anomaly exists before the PRV. An explanation for this inference can be found in Figure 5b that shows the behavior of the upstream pressure. In particular, it is observed that the upstream pressure drops three times. According to the DMA managers, these drops were due to problems to supply the reservoir. More precisely, the pumps used to feed the reservoir failed. Figure 5c shows that only one of these three drops affected the downstream pressure, what it was thanks to the PRV, which works as long as the upstream pressure is greater than the downstream pressure. As can be seen in Figure 5b,c, the upstream pressure was lower than the downstream pressure only once around the 1800th observation.
5. Conclusions
This paper presented an off-line approach to data validation in WN for modeling studies. The core of the proposal is the application of an unsupervised classification tool which does not requires the features of the different events to be identified. The advantages of the proposal were illustrated with a data-sets acquired from a Mexican water management utility. The abnormal events identified in the data were validated with the reports of the DMA managers. In particular, the unsupervised method allowed the identification of a systematic anomaly: the draining of the reservoir. On the base of these results, the network operators concluded the convenience of the pressure reducing valve.
Funding
This research was funded by IT100519-DGAPA-UNAM and CONACYT Convocatoria de Proyectos de desarrollo científico para atender problemas nacionales 2017, Proyecto 4730.
Conflicts of Interest
The authors declare no conflict of interest.
References
- Kanakoudis, V.; Tsitsifli, S. Water pipe network reliability assessment using the DAC method. Desalin. Water Treat. 2011, 33, 97–106. [Google Scholar] [CrossRef]
- Bartkiewicz, E.; Zimoch, I. Impact of Water Demand Pattern on Calibration Process. Proceedings 2017, 2, 191. [Google Scholar] [CrossRef]
- Quevedo, J.; Puig, V.; Cembrano, G.; Blanch, J.; Aguilar, J.; Saporta, D.; Benito, G.; Hedo, M.; Molina, A. Validation and reconstruction of flow meter data in the Barcelona water distribution network. Control Eng. Pract. 2010, 18, 640–651. [Google Scholar] [CrossRef]
- Cugueró-escofet, M.À.; García, D.; Quevedo, J.; Puig, V.; Espin, S.; Roquet, J. A methodology and a software tool for sensor data validation/reconstruction: Application to the Catalonia regional water network. Control Eng. Pract. 2016, 49, 159–172. [Google Scholar] [CrossRef]
- Han, J.; Kamber, M.; Pei, J. Data Mining Concepts and Techniques; Elsevier: Amsterdam, The Netherlands, 2012; p. 703. [Google Scholar]
- Theodoridis, S. Koutroumbas, K. Pattern Recognition; Elsevier: Amsterdam, The Netherlands, 2009. [Google Scholar]
- Ester, M.; Kriegel, H.P.; Sander, J.; Xu, X. A Density-Based Algorithm for Discovering Clusters in Large Spatial Databases with Noise. In KDD’96: Proceedings of the Second International Conference on Knowledge Discovery and Data Mining, Portland, OR, USA, 2–4 August 1996; AAAI Press: Palo Alto, CA, USA, 1996; pp. 226–231. [Google Scholar]
Publisher’s Note: MDPI stays neutral with regard to jurisdictional claims in published maps and institutional affiliations. |
© 2019 by the authors. Licensee MDPI, Basel, Switzerland. This article is an open access article distributed under the terms and conditions of the Creative Commons Attribution (CC BY) license (https://creativecommons.org/licenses/by/4.0/).