Abstract
The spatial organization and the topological organization of cities have a great influence on the lives of their inhabitants, including mobility efficiency. Entropy has been often adopted for the characterization of diverse natural and human-made systems and structures. In this work, we apply the exponential of entropy (evenness) to characterize the uniformity of city blocks. It is suggested that this measurement is related to several properties of real cities, such as mobility. We consider several real-world cities, from which the logarithm of the average shortest path length is also calculated and compared with the evenness of the city blocks. Several interesting results have been found, as discussed in the article.
1. Introduction
A great part of the human population is currently concentrated in cities. While in the past focus was placed on security from invaders, implying minimal walled city areas, nowadays cities are organized around other priorities, such as mobility. Even as the internet becomes inexorable, allowing many activities to be performed at home, there will always be a demand for convenient displacement among several points of interest, such as parks, restaurants, health centers, entertainment, etc. So, the structure of cities, as defined by their organization in streets, avenues, and blocks, needs to be so as to cater for effective mobility toward all directions.
Given the uneven topography of our planet, the structure of cities is influenced by several factors, such as the presence of mountains, lakes, shore, etc. Besides, older cities can have large portions dating back to more remote times and considering other demands. In other words, the organization of cities can be a consequence of both topography and history. As a consequence, an interesting question arises regarding the relationship between city structure and mobility (e.g., [1,2,3]).
Because of its intrinsic nature, entropy provides a natural candidate for quantifying properties of cities. For instance, in [4], the author uses entropy to study problems of urban decomposition and aggregation. In a different approach, [5], the authors apply entropy and other concepts of information theory as indicators or the dynamics of the urban ecosystem. The usage of entropy and other information theory concepts spans several other fields, including transport models, location models and social physics [6].
Entropy is often applied to probabilities obtained by some binning procedure, such as when estimating probability distributions. Often, this implies a problem of finding a suitable bin size, as the estimation of the entropy value can depend substantially on that parameter. An interesting alternative approach is to apply the entropy on probabilities defined by relative fractions of the parts of a whole entity. For instance, when we divide a pie into N slices, it is possible to define the probabilities as the ratio between the angle of each slice and . Since this corresponds to a well-defined probabilistic system, it is possible to obtain the respective entropy, which will reflect the uniformity of the division. This type of entropy will henceforth be called divisional entropy. The evenness, henceforth adopted as a measurement of uniformity, has been defined as a normalized version of the exponential of the divisional entropy [7].
It is known that the maximum evenness value will be achieved when all parts have the same size (uniform distribution). Any other partitioning will imply smaller values of evenness. Observe that this measurement can be understood as a quantification of the uniformity of the partitioning, achieving unit as maximum value.
In the present work, we propose that the evenness of the areas of the blocks of a given city is related to important urban characteristics such as mobility. More specifically, we suggest that cities with large block evenness will allow shorter displacements in the average, as well as less dispersion of these shortest paths. In case such a relationship exists, even if partially, it would constitute an interesting insight about which aspects of a city ultimately influence mobility. To investigate this hypothesis, we consider the structures of cities from California, USA.
This article starts by presenting the adopted data and methodology, including estimation of the areas of the blocks of real cities from OpenStreetMap [8] by using image processing and analysis, the representation of cities as complex networks, and respective shortest path calculation. The obtained results are then presented and discussed.
2. Materials and Methods
This section describes the methodology proposed and the data utilized to analyze the correlation of block sizes evenness with the shortest path lengths. Figure 1 illustrates these steps. Given the graph of streets of a region, the shortest path between every two nodes (corresponding to intersections or endpoint of streets) is computed. Statistics from the set of obtained lengths are calculated. From the same graph, an image is generated in the form of a raster graphic, the blocks of the region are identified, and their areas are obtained. The evenness is considered as a measure of the uniformity of the block areas. These values are compared with the shortest path lengths statistics previously obtained. Each subsection that follows explains in detail the aforementioned steps.
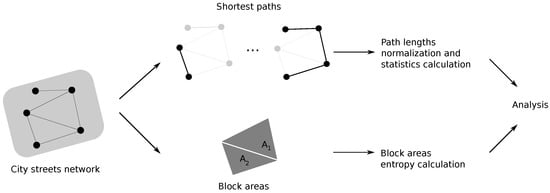
Figure 1.
Diagram illustrating the main stages of the proposed method.
2.1. The Cities Dataset
The dataset used in this work [9] consists of most municipalities of the state of California, U.S., which contemplates regions with a high variation of block geometries and sizes. Figure 2 depicts three cities with different homogeneity of blocks.
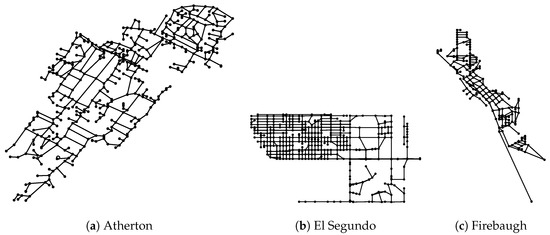
Figure 2.
Graphs of the streets of three different cities in California, Atherton, El Segundo and Firebaugh, respectively. (a) High variation of block shapes and sizes; (b) block formats, sizes are more even; (c) another type of city structure. Not drawn to scale.
The considered cities were transformed into graphs, with nodes representing the intersections and end of streets, while the links correspond to street segments. Additionally, each node carries its geographical location. First, the largest connected component is obtained from each city, which is implemented to avoid disconnected paths. Then, weights are attributed to edges, corresponding to the distance between the location of the two extreme nodes (see below). Therefore, all the obtained graphs are connected and weighted.
2.2. Shortest Paths
From each graph obtained, the shortest paths between every pair of nodes is be computed. The length of the segments are computed considering the distance in the geodesic sphere. The shortest paths between two nodes in this context represents a path from u to v such that its total length is minimal among all paths between u and v. The Dijkstra [10] algorithm was used for calculating the shortest paths.
2.3. Area Calculation
To study the block areas variability, the blocks must first be uniquely identified. To identify the blocks from the original graph, the approach utilized in this work consists in generating a graphical representation of the graph (an example is shown in Figure 3) and then finding the connected components in each region (e.g., [11,12]).
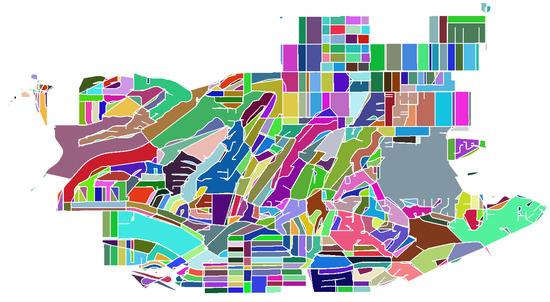
Figure 3.
Identification of the blocks of the graphs of Monterey Park, CA. Blocks randomly colored for visualization purposes.
2.4. Variability in the Block Areas
The study of entropy dates back to Clausius in the study of irreversible processes. Since then, this concept has been studied and applied in rather different fields. In Information Theory, given a random variable X that represent the outcome of an event with n possible outcomes and corresponding probabilities, with , the Shannon entropy [13] states that the entropy, as defined by Equation (1) represents an important measure of uncertainty of information.
In this work, the concept of entropy is expanded to study the dispersion of block areas, as previously studied in [7]. Instead of directly applying Equation (1), the relative areas are considered as probabilities. Given the original areas , , normalized values are obtained, where . The divisional entropy can then be calculated as:
For an equal-sized partitioning, we get the maximum possible value .
The evenness of the areas can be defined as the exponential of the divisional entropy ([7]) divided by the original number of blocks. It can be verified that evenness achieves its maximum value of one when all the areas are identical.
Figure 4 illustrates the concept of divisional entropy concerning the partitioning of a segment L into intervals. When these intervals have an identical length (Figure 4a), maximum entropy is obtained corresponding to . Observe that, in this particular case, , and the respective evenness achieves its maximum value of one. However, when the intervals are different (Figure 4b), the obtained divisional entropy will always be smaller than and the respective evenness smaller than one.
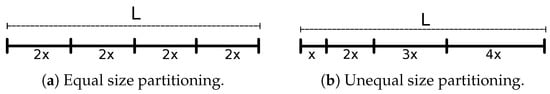
Figure 4.
Illustrative example to explain the concept of entropy of areas in one dimension. In (a), partitions have the same size, and the entropy assumes its maximum value of 1.39, for the same number of partitions, with maximum evenness of one. In (b), the same segment is partitioned in a regular one but with uneven sizes and the same measure has value 1.28.
3. Results and Discussion
In this section, the main results are presented and discussed. The methodology from Figure 1 is applied to networks representing the 482 cities analyzed, with 1610 nodes (on average) and 2079 edges (on average). Information about the blocks and the average shortest paths inside the cities is obtained from the considered city networks.
In Figure 5, the relative frequency histogram of the block areas evenness is presented for all considered cities. The histogram shows a skewed distribution far from uniform.
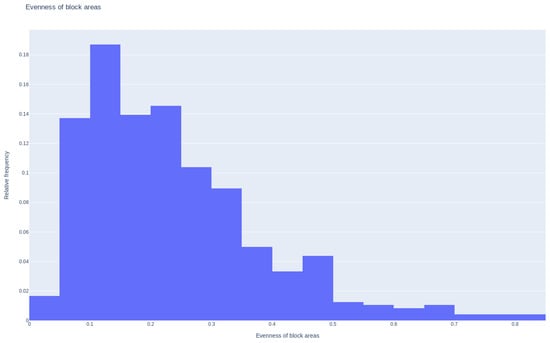
Figure 5.
Histogram of the evenness of the block areas for all the considered cities.
Figure 6 depicts a scatterplot defined by the logarithm of the normalized average shortest paths and the block areas evenness obtained for all the considered cities. The normalized paths were obtained by dividing the shortest path lengths by the average length of the blocks in each city, therefore yielding a non-dimensional, normalized value.
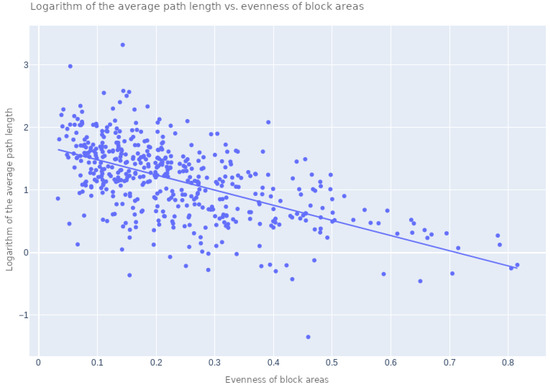
Figure 6.
Evenness of the block sizes by the average shortest path length. Higher values of the evenness of block areas correspond to lower values of shortest path lengths.
This result reveals a well-defined correlation between the two respective measurements, with a Pearson correlation coefficient of . This interesting result indicates that the logarithm of the average shortest path (mobility) of a city is positively related to the uniformity of the block areas. So, a city with more uniform block areas will tend to have largest paths. An interesting implication of this result is that a relatively intricate property such as minimum path lengths can be inferred with some limited precision from the more immediate, simple measurement corresponding to the evenness of the city block areas.
Figure 7 illustrates the scatterplot respective to the coefficient of variation (standard deviation divided by the area) of the normalized shortest path length and evenness of block areas obtained for each considered city. Again, a well-defined positive correlation can be observed, with Pearson correlation coefficient value equal to . This result suggests that a city with less regular blocks tend to have a larger variation of the average shortest path lengths.
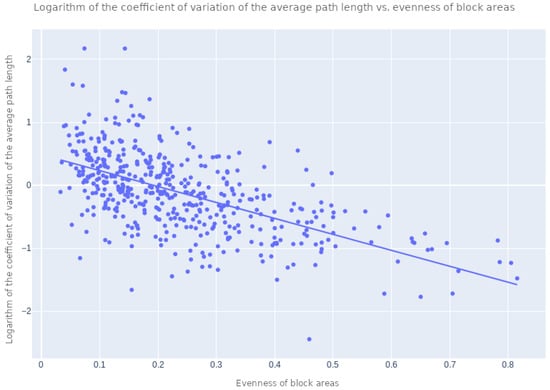
Figure 7.
Coefficient of variation of the shortest path lengths in terms of the evenness of the block areas. The higher the evenness of the block areas, the smaller the variation of the shortest path lengths.
4. Conclusions
A number of factors influence the geometrical disposition of the streets of a city, including historical and topographical constraints. As a result, the blocks of a city can have different shapes and sizes. At the same time, people need to navigate throughout street networks, which should be somehow catered by the cities structure. In this work, the relationship between the block uniformity and the shortest path lengths are explored and the evenness is used as a key measure of the uniformity of the blocks.
The average shortest path, as well as the block areas evenness, are obtained for most cities of California, USA. The results reveal a well-defined correlation between these measurements, indicating that more uniform block areas tend to imply a reduction of the shortest path lengths among locations of the same city. This result not only provides insights about important factors influencing city mobility, but also indicate that the evenness of the block areas can be used to estimate other, more intricate properties of cities.
The obtained results pave the way to several subsequent investigations, including the effect of the uniformity of block areas on other city characteristics such as modular structure, resilience to failures, electricity distribution, etc.
Author Contributions
Conceptualization, E.K.T., C.H.C., R.M.C.J. and L.d.F.C.; methodology, L.d.F.C.; software, E.K.T.; validation, E.K.T. and L.d.F.C.; formal analysis, E.K.T., C.H.C., R.M.C.J. and L.d.F.C.; investigation, E.K.T., C.H.C., R.M.C.J. and L.d.F.C.; resources, E.K.T. and C.H.C.; data curation, E.K.T.; writing—original draft preparation, E.K.T., C.H.C., R.M.C.J. and L.d.F.C.; writing—review and editing, E.K.T., C.H.C., R.M.C.J. and L.d.F.C.; visualization, E.K.T. and L.d.F.C.; supervision, L.d.F.C.; project administration, R.M.C.J. and L.d.F.C.; funding acquisition, R.M.C.-J. and L.d.F.C. All authors have read and agreed to the published version of the manuscript.
Funding
E.K.T. was funded by FAPESP grants 2019/01077-3 and 2015/22308-2, CNPq and CAPES. L.d.F.C. thanks CNPq (grant no. 307085/2018-0) for sponsorship. CHC thanks FAPESP (grant no. 18/09125-4) for the financial support. This work has benefited from FAPESP grant 15/22308-2.
Conflicts of Interest
The authors declare no conflict of interest.
References
- Batty, M. Cities and Complexity: Understanding Cities with Cellular Automata, Agent-Based Models, And Fractals; MIT Press: Cambridge, MA, UK, 2007. [Google Scholar]
- Meurs, H.; Haaijer, R. Spatial structure and mobility. Transp. Res. Part D Transp. Environ. 2001, 6, 429–446. [Google Scholar] [CrossRef]
- Silva, C.T.; Freire, J.; Miranda, F.; Lage, M.; Doraiswamy, H.; Hosseini, M.; Tokuda, E.K.; Ferreira, G.; Cesar, R.M., Jr. Integrated Analytics and Visualization for Multi-Modality Transportation Data; Connected Cities for Smart Mobility toward Accessible and Resilient Transportation Center (C2SMART): Washington, DC, USA, 2019. [Google Scholar]
- Batty, M. Entropy in spatial aggregation. Geogr. Anal. 1976, 8, 1–21. [Google Scholar] [CrossRef]
- Zhang, Y.; Yang, Z.; Li, W. Analyses of urban ecosystem based on information entropy. Ecol. Model. 2006, 197, 1–12. [Google Scholar] [CrossRef]
- Wilson, A. Entropy in Urban and Regional Modelling (Routledge Revivals); Routledge: Abingdon-on-Thames, UK, 2013. [Google Scholar]
- Comin, C.H.; Silva, F.N.; Costa, L.d.F. A framework for evaluating complex networks measurements. EPL 2015, 110, 68002. [Google Scholar] [CrossRef]
- OpenStreetMap. Planet Dump. 2017. Available online: https://www.openstreetmap.org (accessed on 1 August 2019).
- Boeing, G. U.S. Street Network Shapefiles, Node/Edge Lists, and GraphML Files. Comput. Environ. Urban Syst. 2017, 65, 126–139. [Google Scholar] [CrossRef]
- Dijkstra, E.W. A note on two problems in connexion with graphs. Numer. Math. 1959, 1, 269–271. [Google Scholar] [CrossRef]
- Wu, K.; Otoo, E.; Suzuki, K. Optimizing two-pass connected-component labeling algorithms. Pattern Anal. Appl. 2009, 12, 117–135. [Google Scholar] [CrossRef]
- Costa, L.d.F.D.; Cesar, R.M., Jr. Shape Analysis and Classification: Theory and Practice; CRC Press, Inc.: Boca Raton, FL, USA, 2000. [Google Scholar]
- Shannon, C.E.; Weaver, W. The Mathematical Theory of Communication; University of Illinois Press: Champaign, IL, USA, 1998. [Google Scholar]
Publisher’s Note: MDPI stays neutral with regard to jurisdictional claims in published maps and institutional affiliations. |
© 2019 by the authors. Licensee MDPI, Basel, Switzerland. This article is an open access article distributed under the terms and conditions of the Creative Commons Attribution (CC BY) license (https://creativecommons.org/licenses/by/4.0/).