1. Introduction
El Niño, the warm phase of El Niño–Southern Oscillation (ENSO), is a climatic cycle originating in the tropical Pacific Ocean that impacts regional patterns of weather and climate, particularly in countries across Latin America. It is often associated with water-based infectious disease epidemics, many of which are also poverty-related, such as diarrheal diseases, malaria, and arboviruses, including dengue and chikungunya.
El Niño’s impact on infectious disease transmission occurs through climatic and oceanic changes at regional and local scales, which in turn affect local weather, e.g., rainfall, air and sea temperatures, humidity, and subsequent effects on environments and ecologies of various water-related pathogens and vectors [
1]. Furthermore, El Niño and climate-related environmental changes spawn hydrometeorological hazards, such as floods, droughts, and temperature extremes, which can impact built environments and infrastructures (e.g., damage and breakdowns), including water, sanitation, and energy systems. El-Niño-related hazards can also lead to population movements and displacement. Such impacts, in turn, can increase a population’s exposure and vulnerability to a multitude of infectious disease agents, as well as generate other adverse health effects on health [
2].
In this study we explored ecosyndemic risk and social vulnerability in Guatemala during the 2014–2016 El Niño. Unlike an epidemic, which is centered on one disease, an ecosyndemic is a cluster of diseases, associated with environmental changes, set within a wider context of socioeconomic inequities [
3,
4], which dually increase a population’s exposure to hazardous conditions. Guatemala represents an important region for El Niño impacts in Central America, but is less explored compared to northwest South America, a well-known El Niño hotspot [
5]. From 2014 to 2016, there were close to 1.4 million cases of food- and waterborne-related illnesses and 8.4 million cases of acute respiratory infections reported in Guatemala [
6]. There were also several endemic and emergent mosquito-borne diseases, including malaria, dengue, chikungunya, and Zika, as well as neglected tropical diseases, such as Chagas, Leishmaniasis, and Onchocerciasis. In many instances, El Niño can exacerbate patterns of pre-existing health problems. Using GIS, in this exploratory study we examined the spatial overlap of six infectious diseases reported in Guatemala from 2014 to 2016 to understand population risk to ecosyndemics and associations with social and health factors of vulnerability at the department level. Preliminary results and policy implications are discussed.
2. Methodology
2.1. Study Area
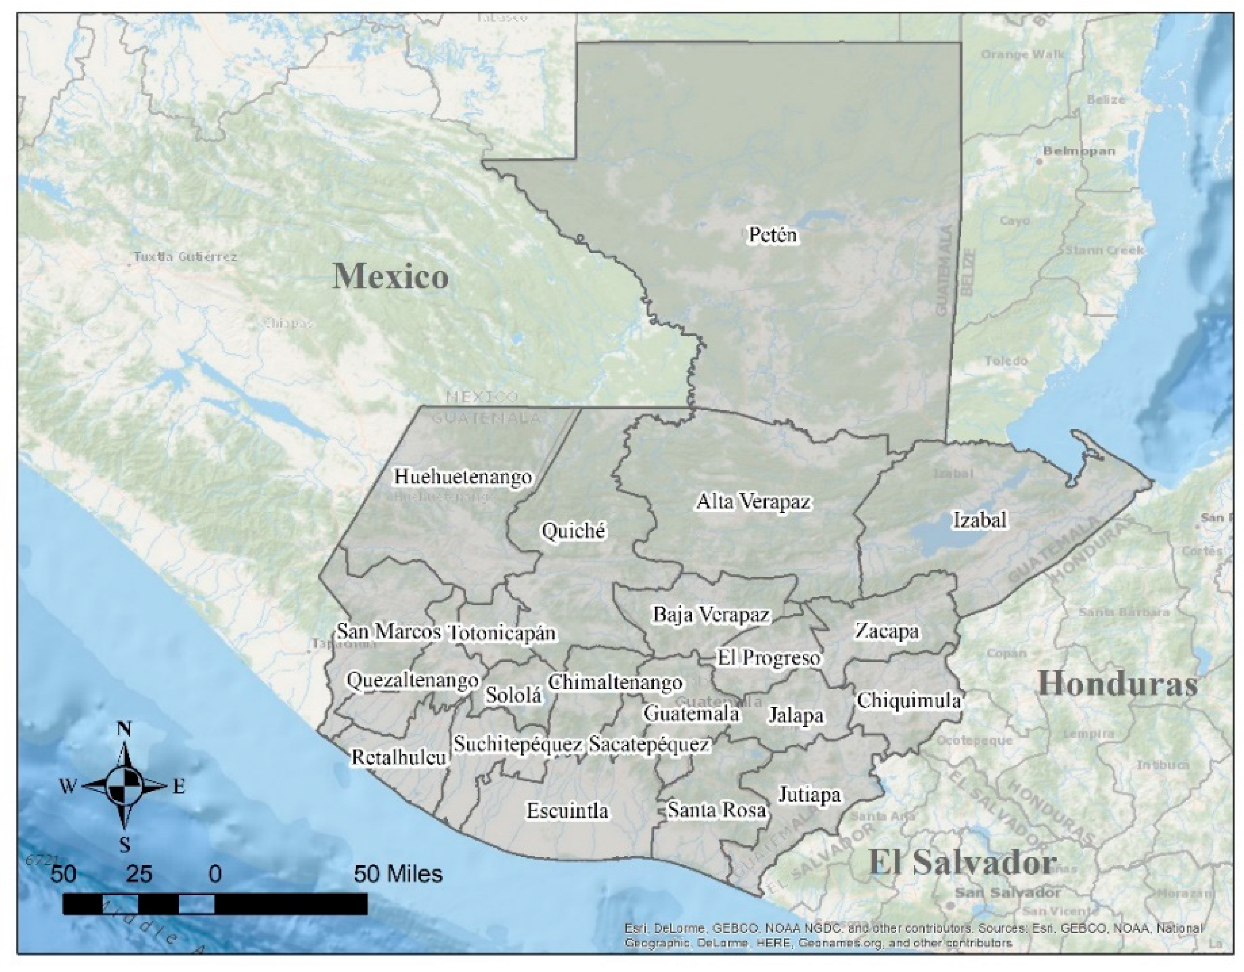
Guatemala comprises 22 departments bordering Mexico, Belize, Honduras, and El Salvador and outlets to the Pacific Ocean and the Caribbean Sea. In 2015, the estimated population was 16.1 million people.
Figure 1.
Map of Political Boundaries of Departments (N = 22) in Guatemala.
Figure 1.
Map of Political Boundaries of Departments (N = 22) in Guatemala.
2.2. El Niño Index
Data from the Oceanic Niño Index comprising of a three-month running mean (season) of sea surface temperature (SST) anomalies in the Central and Eastern Pacific Ocean were retrieved from the National Oceanic and Atmospheric Administration (NOAA) Climate Prediction Center (CPC) webpage (
https://origin.cpc.ncep.noaa.gov/products/analysis_monitoring/ensostuff/ONI_v5.php). This El Niño index identifies El Niño, La Nina, and Neutral conditions.
2.3. Health Data
Infectious disease incidence data were collected from various health and epidemiological reports from the Ministry of Public Health and Social Assistance (MSPAS) in Guatemala [
6]. Datasets include incidence of malaria, dengue, food- and waterborne-related illnesses (ETAs), acute respiratory infections (IRAs), pneumonia, and chikungunya for 2014, 2015, and 2016. Rates per 100,000 persons were calculated using population estimates for the corresponding years retrieved from Guatemala’s Institute for Statistics [
7]. In addition, infant mortality rate and maternal mortality ratio datasets were obtained [
8]. Such health variables are important indicators of development that may reflect the condition of health infrastructure and services in countries.
2.4. Social Vulnerability Data
Variables that serve as proxies for social vulnerability were obtained from Guatemala’s National Survey on social wellbeing [
9]. These data, measured as percent of population, included urban illiteracy, no electricity, varying types of poverty (e.g., total, extreme, urban), GINI index as a measure of inequality, no water, and no sewer. With the exception of urban poverty (2011) and rural poverty (2011), variables represent conditions in 2014.
2.5. Methods
2.5.1. Calculating Disparity
Descriptive statistics, including average, maximum, minimum, and standard deviation values, were generated for all disease incidence variables. From these data, z-scores were calculated for disease variables for each year by subtracting the disease incidence average from the disease incidence value for each department and then dividing by the standard deviation for disease incidence. A disease incidence disparity was defined as a z-score equal to or greater than 0.5.
2.5.2. Disease Burden Ratio Index
A disease burden index was generated based on rate ratios calculated by dividing the incidence rate for each infectious disease of a department by the national average for that disease each year. The ratio represents the number of times higher or lower the incidence rate is compared to the national average. All disease ratios were then summed by department to create an index for each year and all years (sum of 2014 to 2016). The all-years ratio was then ranked. Rate ratios were used to compare potential disease burden across years.
2.5.3. Counts Index
A counts index of ecosyndemic risk for 2014, 2015, and 2016 was constructed using methods from Ramirez et al. [
4] and Lee and Ramirez [
10]. For each year, the number of disease incidence disparities was identified by department, with a possible range of 0 to 6 disparities that overlapped.
2.5.4. Composite Index
A composite index of ecosyndemic risk for 2014, 2015, and 2016 was constructed using methods from Ramirez et al. [
4]. Using Principal Component Analysis (PCA), z-scores of the six infectious disease variables were analyzed and reduced to a set of noncorrelated dimensions with factor scores that represent how influential a variable is in the data structure derived from the PCA output. Scores were summed and then divided by the number of dimensions to produce an index. The index value was then scaled from 0 to 1 to represent low to high ecosyndemic risk. Unlike the counts index, the composite index accounts for magnitude of each disease per department and the combination of all diseases.
2.5.5. Social Vulnerability Analysis
To estimate the effect of social vulnerability variables on ecosyndemic risk, the mean differences in ecosyndemic composite indices for 2014, 2015, and 2016 were assessed between groups or levels of risk using a general linear model (one-way Analysis of Covariance, ANCOVA) in SPSS (IBM, Version 25.0). Departments in Guatemala were grouped by high, medium, and low risk using a quantile classification. A covariate of social vulnerability was added to the model in order to generate an adjusted means, controlling for confounding variables and compounding effects of social and infrastructure context (e.g., poverty and access to basic needs, such as water and electricity).
3. Results and Discussion
3.1. El Niño Context
Table 1 displays the ONI-based SST anomalies from 2014 to 2016. In late 2014, as the austral summer approached, the onset of El Niño conditions was observed in the central and eastern tropical Pacific Ocean, beginning in the October-November-December season (OND) and lasting approximately 19 consecutive months, ending in the April-May-June season (AMJ) of 2016. According to the United Nations Office for the Coordination of Humanitarian Affairs (UNOCHA) [
11], El Niño enhanced drought conditions in northern, eastern, and western Guatemala. A state of emergency was declared in early 2015, and impacts were reported in agriculture (50% crop losses), food and water security, and people’s livelihoods [
11].
3.2. Disease Burden Ratio Index
In
Table 2, a disease burden index based on rate ratios by individual years and for all years (2014–2016), along with the ranks by department, is shown. Eighteen departments (80%) experienced an increase in infectious diseases compared to the national average. Of these, eight departments (36%) experienced increasing burdens of infectious diseases for three consecutive years. In addition, there were four departments where the disease burden increased from 2014 to 2015, and six where the disease burden increased from 2015 to 2016. Overall, the departments which exhibited the greatest total disease burden based on ratio (2014–2016) were Escuintla, Santa Rosa, Zacapa, and Chiquimula, concentrated in southern and eastern Guatemala. Interestingly, although Escuintla and Zacapa had the first and third highest disease burden indices (64.4 and 34.2), these departments’ burden ratios decreased from 2014 to 2016, in contrast to increasing disease burden ratios in Santa Rosa and Chiquimula.
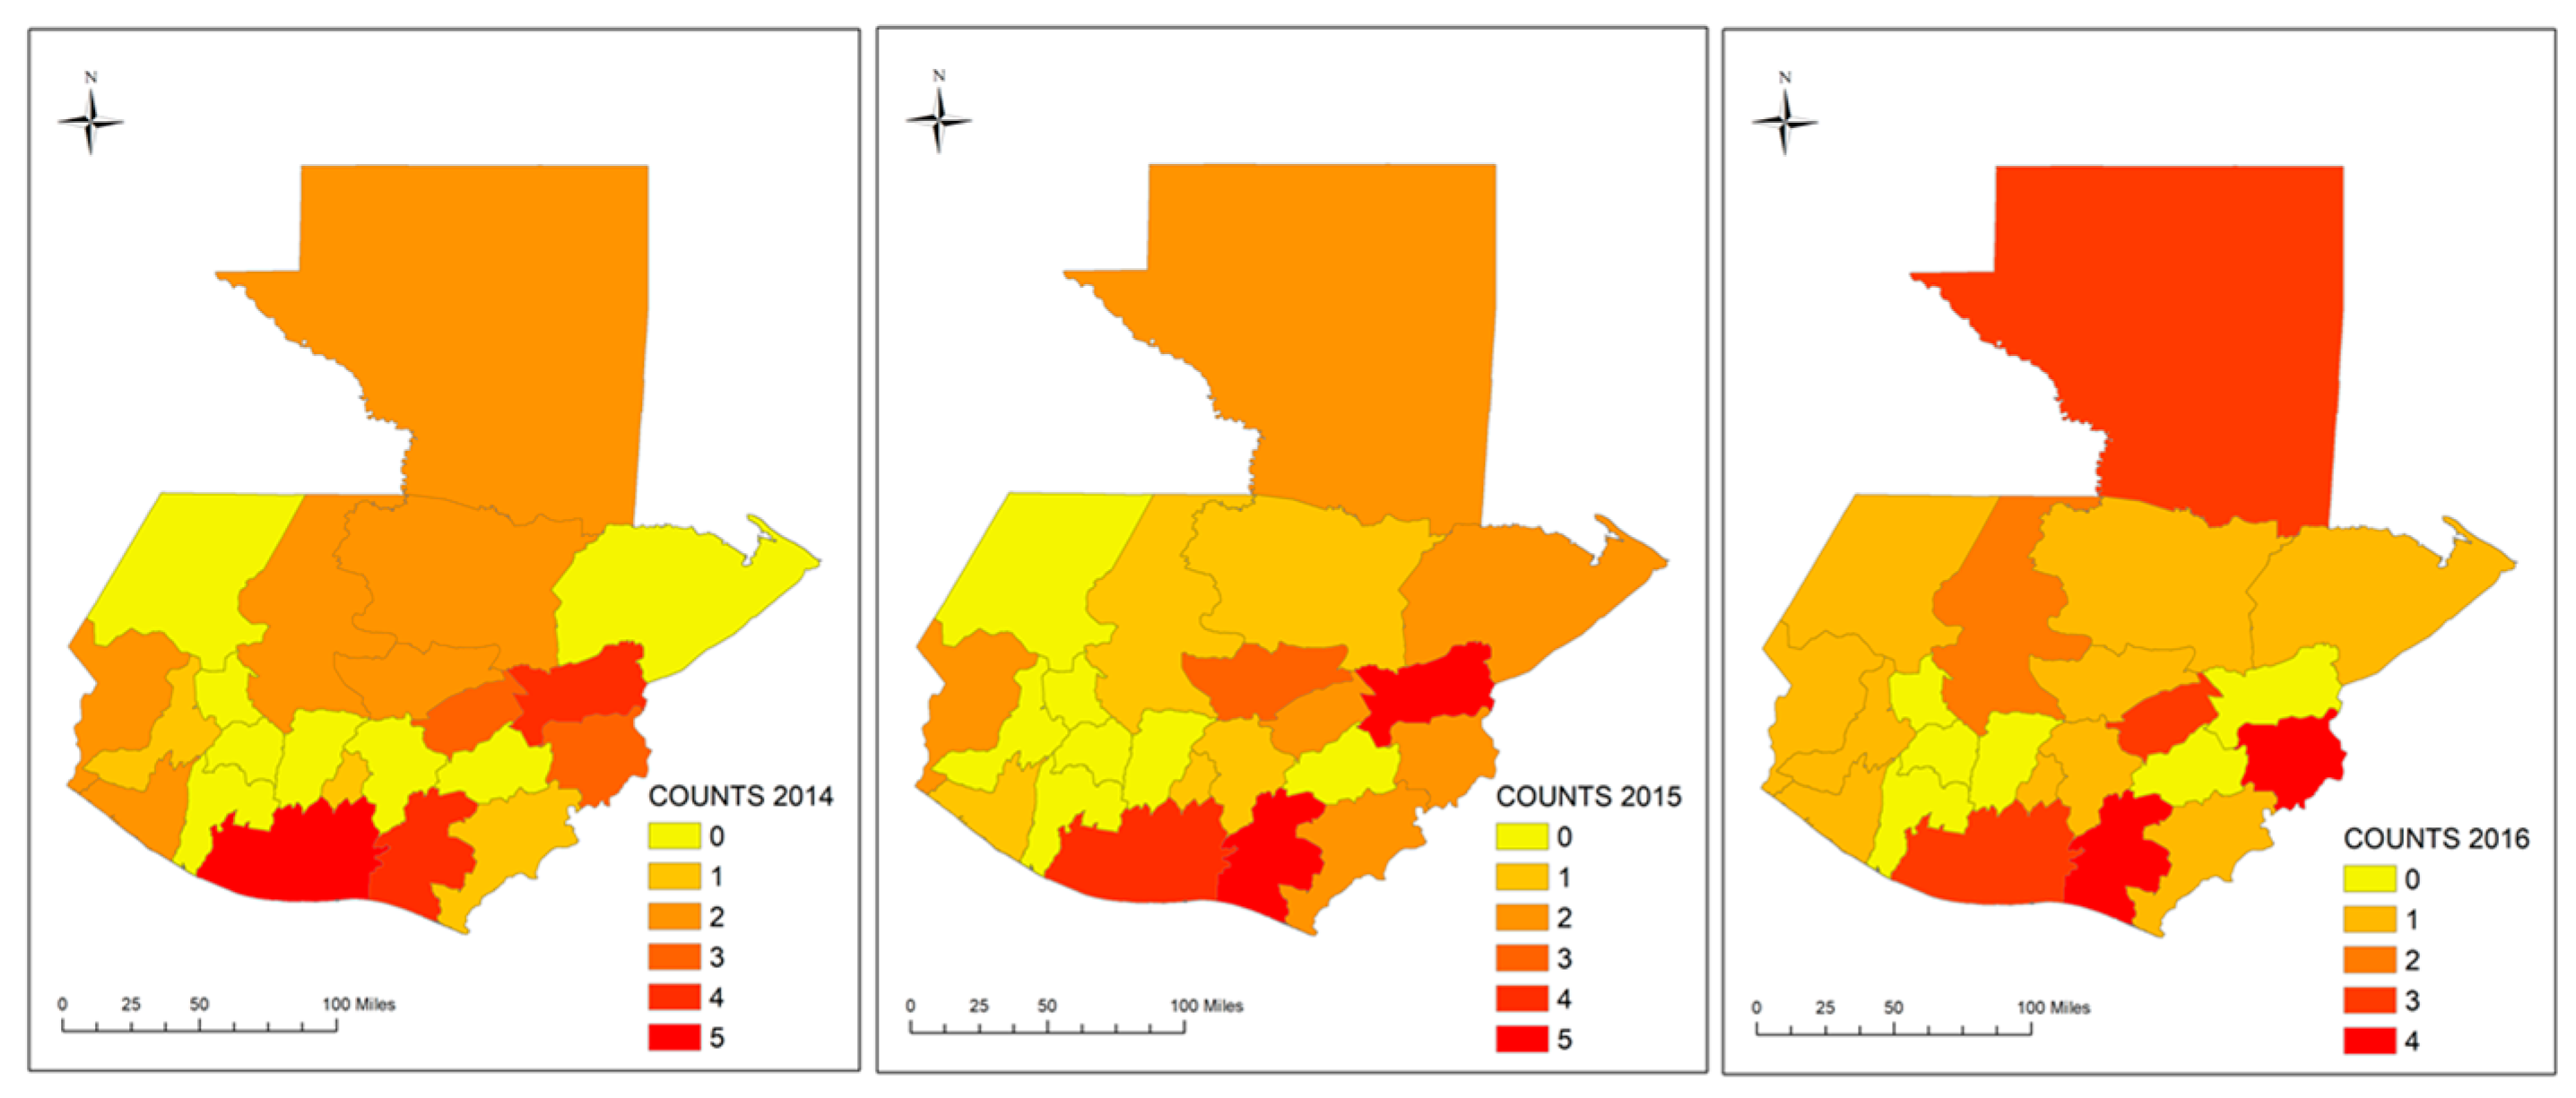
3.2.1. Ecosyndemic Risk by Counts Index
Figure 2 shows the number of infectious diseases with above-average values compared to the state present in Guatemala, 2014 to 2016. Generally, from 2014 to 2016, the spatial overlap of diseases was most concentrated in the south and east (at least five diseases), although it appears that the number of diseases decreased to a maximum of four in 2016. Zacapa, for example, increased from four to five diseases (2014 to 2015), and then decreased significantly to zero diseases above the state average in 2016. There is also an increase observed in the northern department of Petén.
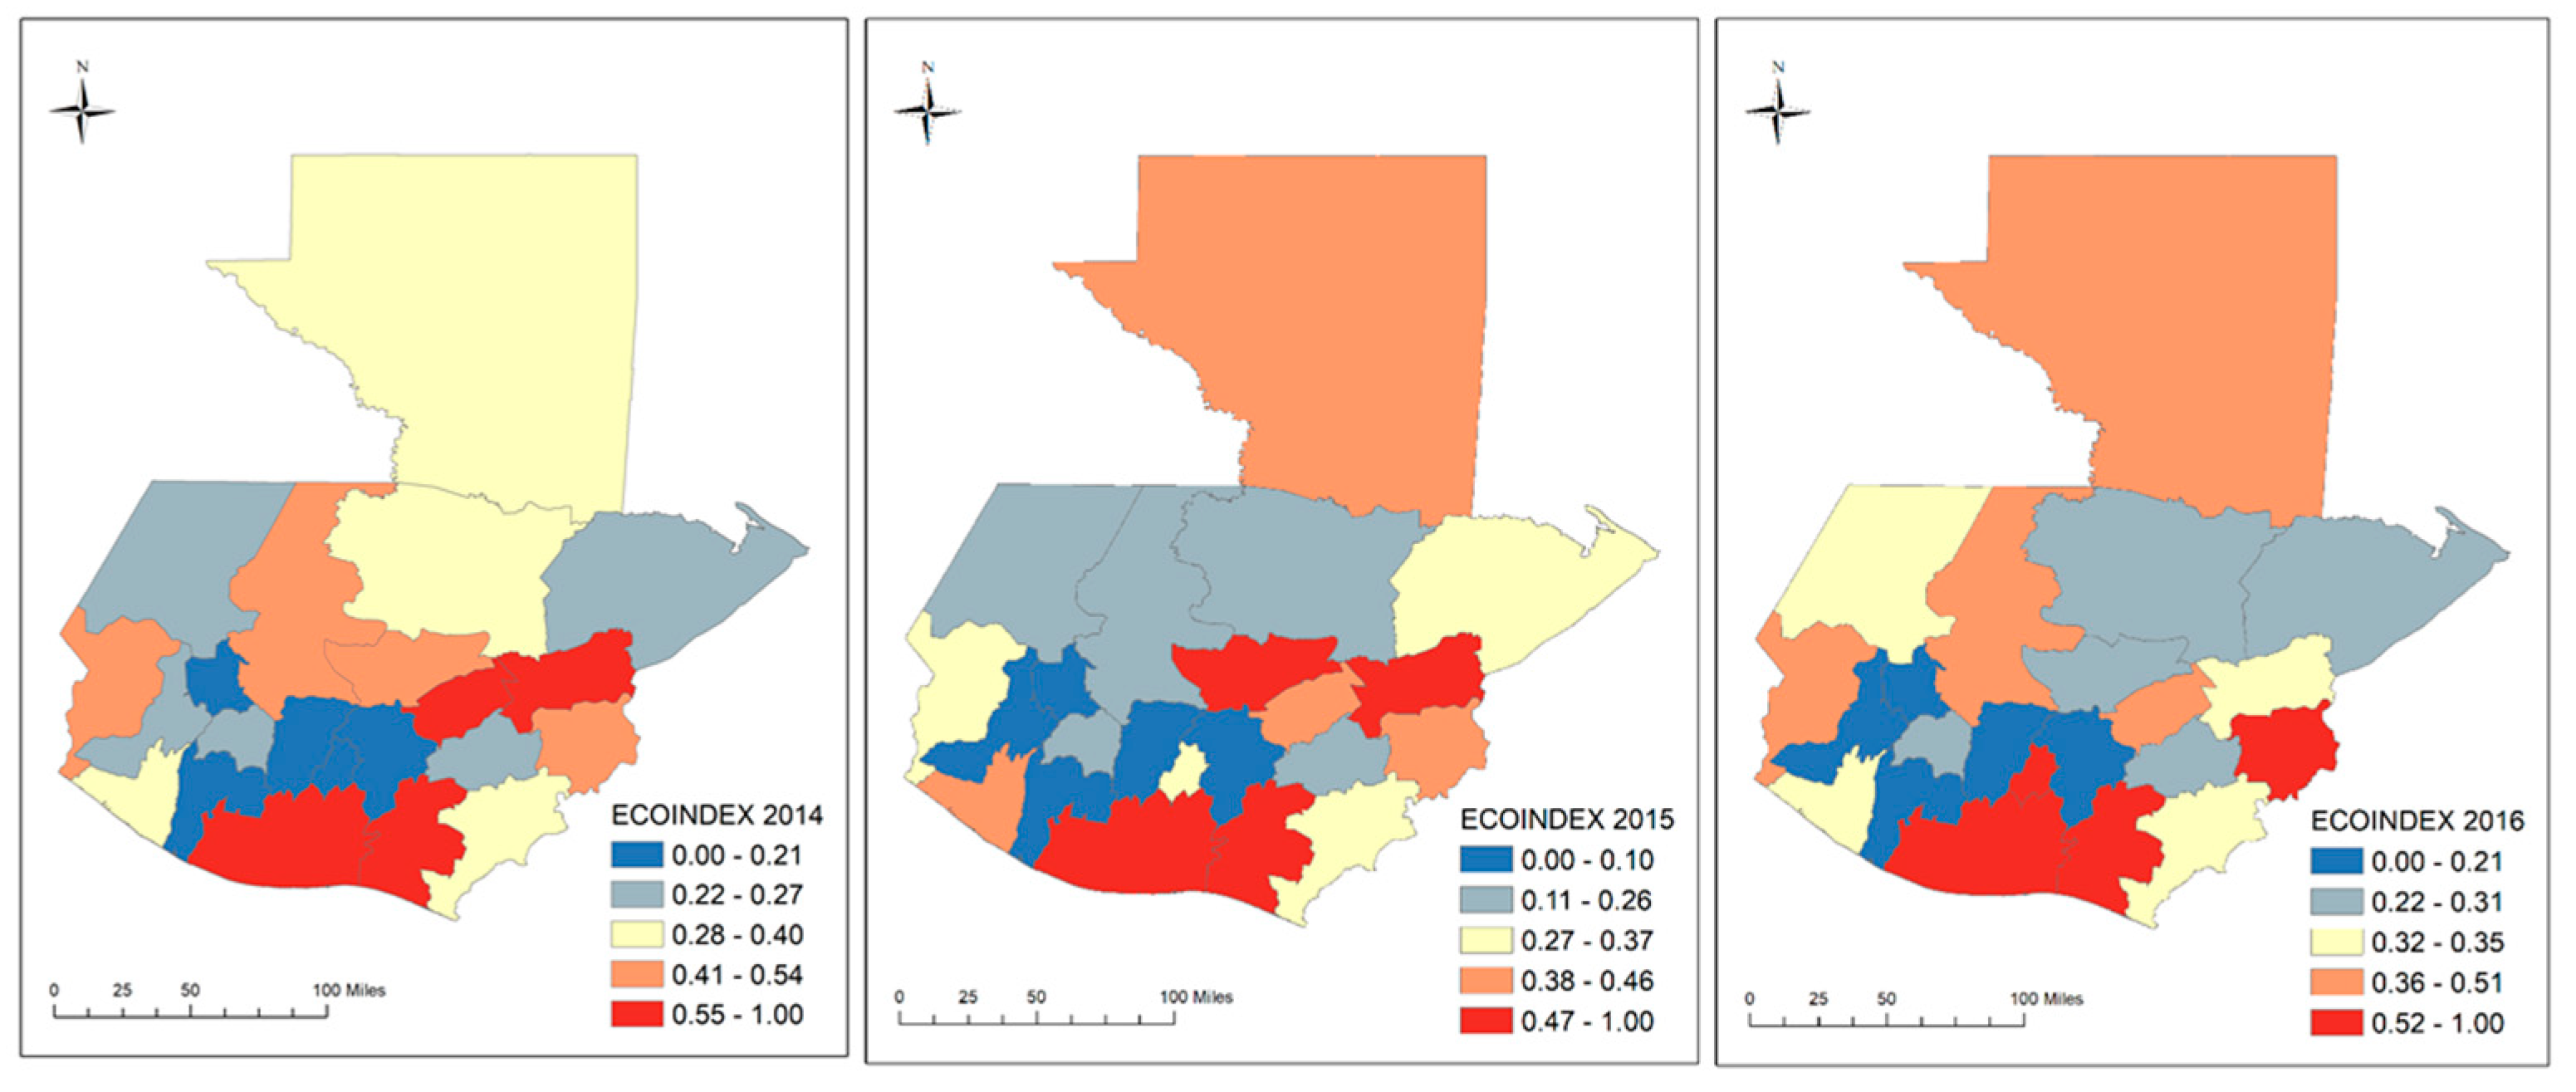
3.2.2. Ecosyndemic Risk by Composite Index
Figure 3 shows ecosyndemic risk based on a composite index by department which takes into account the magnitude of disease. Like the counts index and the disease burden index, ecosyndemic risk appears to be concentrated in the southern and eastern regions of Guatemala, particularly in 2015. However, significant shifts are observed between years. From 2014 to 2015, shifts in increased risk are observed in five departments (23%), mainly in the central and north, including Guatemala, Sacatepéquez, Baja Verapaz, and Petén. From 2015 to 2016, shifts in increased risk are observed in eight departments (36%), including two areas where risk continued to increase after 2014 (e.g., Sacatepéquez and Petén) and two areas in the west (e.g., Huehuetenango and San Marcos).
3.3. Ecosyndemic Risk and Social Vulnerability
Table 3 shows group means of high, medium, and low ecosyndemic risk and mean differences of ecosyndemic risk (based on the composite index) comparing between groups of risk (high and medium, high and low, and medium and low risk), controlling for social vulnerability. The results suggest there are significant mean differences between groups of risk at the 0.05 or 0.01 levels, particularly in 2015. Group means are denoted as M
h, M
m, and M
l. Mean differences were adjusted for social vulnerability variables as covariates, and among these, total poverty (TPOV) (%) and without electricity (NOELEC) (%) were statistically significant and positive, suggesting that ecosyndemic risk increased when there was a greater number of the population living in poverty and/or were lacking a basic need such as electricity in their household. In terms of geography, departments with high(er) averages of ecosyndemic risk (data not shown) were located near the Pacific coast in the west but also inland in the southeast (e.g., Chiquimula and Zacapa).
4. Conclusions
Using GIS, in this study we explored six infectious disease variables and ecosyndemic patterns of risk in Guatemala during 2014, 2015, and 2016, years associated with 19-month El Niño conditions. Differences between groups of risk (high, medium, and low) were also assessed, controlling for social vulnerability. In sum, preliminary results showed that 36% of departments experienced an increase in disease burden from 2014 to 2015 and subsequently from 2015 to 2016. A greater number of departments exhibited increased disease burden in 2015–2016 (27%), compared to 2014–2015 (18%). Ecosyndemic risk was most concentrated in the southern and eastern areas of Guatemala, and also shifted from year to year in the central and northern areas, as well as in the west. The greatest mean differences between groups of risk were observed in 2015, and total poverty and no electricity were significantly associated with increased risk, suggesting that ecosyndemic risk increased with deprivation of income and infrastructure, which affect the capacity to prevent infectious disease exposure, and respond to and with cope with related-illness and other health effects.
This study had several limitations, which can be addressed in future analyses by including more localized data in order to better understand patterns of ecosyndemic risk within departments for public health planning; more comprehensive analysis of social vulnerability (e.g., spatial regression); and measuring the effects of temperature and rainfall patterns on ecosyndemic risk to discern changes and effects across time and space. A better understanding of multiple infectious disease burden associated with ecosyndemic risk and social factors of risk can assist the Ministry of Public Health to improve and coordinate interventions during current and future climate extreme events.
Author Contributions
I.J.R. and J.L. designed the study. I.J.R. collected the data. I.J.R. and J.L. performed analyses. All authors contributed in writing and reviewing the paper. All authors have read and agreed to the published version of the manuscript.
Funding
This research received no external funding.
Acknowledgments
We would like to thank Alejandro Cerón at University of Denver for sharing geographic information system datafiles for Guatemala.
Conflicts of Interest
The authors declare no conflict of interest.
References
- WHO. El Niño and Health: A Global Overview—January 2016. Available online: http://www.who.int/hac/crises/el-Niño/who_el_Niño_and_health_global_report_21jan2016.pdf?ua=1 (accessed on 4 January 2018).
- Ramírez, I.J. Exploring tropical variability and extremes impacts on population vulnerability in Piura, Peru: The case of the 1997-98 El Niño. In Tropical Extremes: Natural Variability and Trends (Observations, Modelling and Theoretical Expectations); Vuruputur, V., Sukhatme, J., Murtugudde, R., Roca, R., Eds.; Elsevier: New York, NY, USA, 2019. [Google Scholar]
- Singer, M. Introduction to Syndemics: A Critical Systems Approach to Public and Community Health; John Wiley and Sons: San Francisco, CA, USA, 2009; pp. 189–192. [Google Scholar]
- Ramirez, I.J.; Lee, J.; Grady, S.C. Mapping Multi-Disease Risk during El Niño: An Ecosyndemic Approach. Int. J. Environ. Res. Public Health 2018, 15, 2639. [Google Scholar] [CrossRef] [PubMed]
- Ramirez, I.J.; Briones, F. Understanding the El Niño Costero of 2017: The Definition Problem and Challenges of Climate Forecasting and Disaster Responses. Int. J. Disaster Risk Sci. 2017, 8, 489–492. [Google Scholar] [CrossRef]
- Ministry of Public Health and Social Assistance (MSPAS). Compendio Estadistico Ambiental (Summary of Environmental Statistics), 2012–2017. Available online: https://www.mspas.gob.gt/ (accessed on 1 February 2019).
- Institute of National Statistics, Guatemala (INE). Population Estimates and Projections for 2008–2020. Available online: https://www.ine.gob.gt/ine/ (accessed on 1 October 2019).
- MSPAS. National Survey of Maternal and Infant Health, 2014–2015. Available online: https://www.mspas.gob.gt/ (accessed on 1 February 2019).
- INE. ENCOVI Survey2014. Available online: https://www.ine.gob.gt/estadisticasine/index.php/usuario/encovi (accessed on 15 October 2019).
- Lee, J.; Ramírez, I.J. The Intersection of Housing and Mental Health in Colorado: Mapping Critical Social Determinants of Health (Report No. 18-09A); Colorado Evaluation and Action Lab at the University of Denver: Denver, CO, USA, 2019. [Google Scholar]
- UN OCHA. El Niño: Overview of Impact, Projected Humanitarian Needs and Response. March 2016. Available online: https://reliefweb.int/sites/reliefweb.int/files/resources/El%20Niño%20Monthly%20Overview%209%20March.pdf (accessed on 15 October 2019).
| Publisher’s Note: MDPI stays neutral with regard to jurisdictional claims in published maps and institutional affiliations. |
© 2019 by the authors. Licensee MDPI, Basel, Switzerland. This article is an open access article distributed under the terms and conditions of the Creative Commons Attribution (CC BY) license (https://creativecommons.org/licenses/by/4.0/).


