1. Introduction
The generation of new knowledge, related to the influence of human activity on the biodiversity of marine ecosystems and the exploitation of their resources, is essential to move toward the planning, management, and sustainable exploitation of the seas and coasts. In addition, the lack of information on the different elements that characterize the marine environment and its interaction with activities of anthropogenic origin is presented as an opportunity to investigate and improve the state of knowledge of this environment.
However, the large volume of data generated in the field of the planning, management, and exploitation of natural resources located in the marine environment requires technologies capable of capturing, storing, processing, analyzing, distributing, and displaying such information quickly and efficiently, contributing to the efficient management of the seas and oceans and the ecosystems dependent on them and avoiding the numerous and costly conflicts arising from poor data management in the face of complex decision-making processes.
Therefore, the integration of new programming techniques that allow the integration of advanced signal processing into a server will improve the knowledge of these ecosystems by society, thus contributing to awareness, which is the first step in generating responsible behaviors that result in better conservation of these natural spaces.
In this context, the general objective of this work is the development of new programming techniques that allow the integration of advanced signal processing (machine learning among others) automatically into a web server. This study is focused on three lines:
A cloud-based system for big data environmental monitoring: here the key aspects of the backend web technologies that allow the management of large amounts of data are discussed.
The layer of processing and online display of information: the processing of the necessary data for its online visualization will be explained, as well as the technologies that allow an adaptable and agile representation.
Machine-learning for big data: machine learning algorithms for the treatment of massive data, which are integrated into a GIS platform, are explained. Thus, the results of geospatial analysis with these algorithms are shown.
In this document, the results of applying these different techniques and technologies to the case of underwater noise monitoring is shown. Underwater noise is one of the environmental indicators that has great influence in the maritime field. Indeed, unlike other indicators of environmental impact (contaminants, temperature, etc.), the critical aspect of generating large amounts of data in short time periods perseveres with underwater noise, as its acquisition is carried out at frequencies in the order of 10 to 100 thousand samples per second. Therefore, the results shown may apply to cases of the online monitoring of other less demanding environmental parameters.
2. Methods
2.1. Cloud-Based System for Big Data Environmental Monitoring
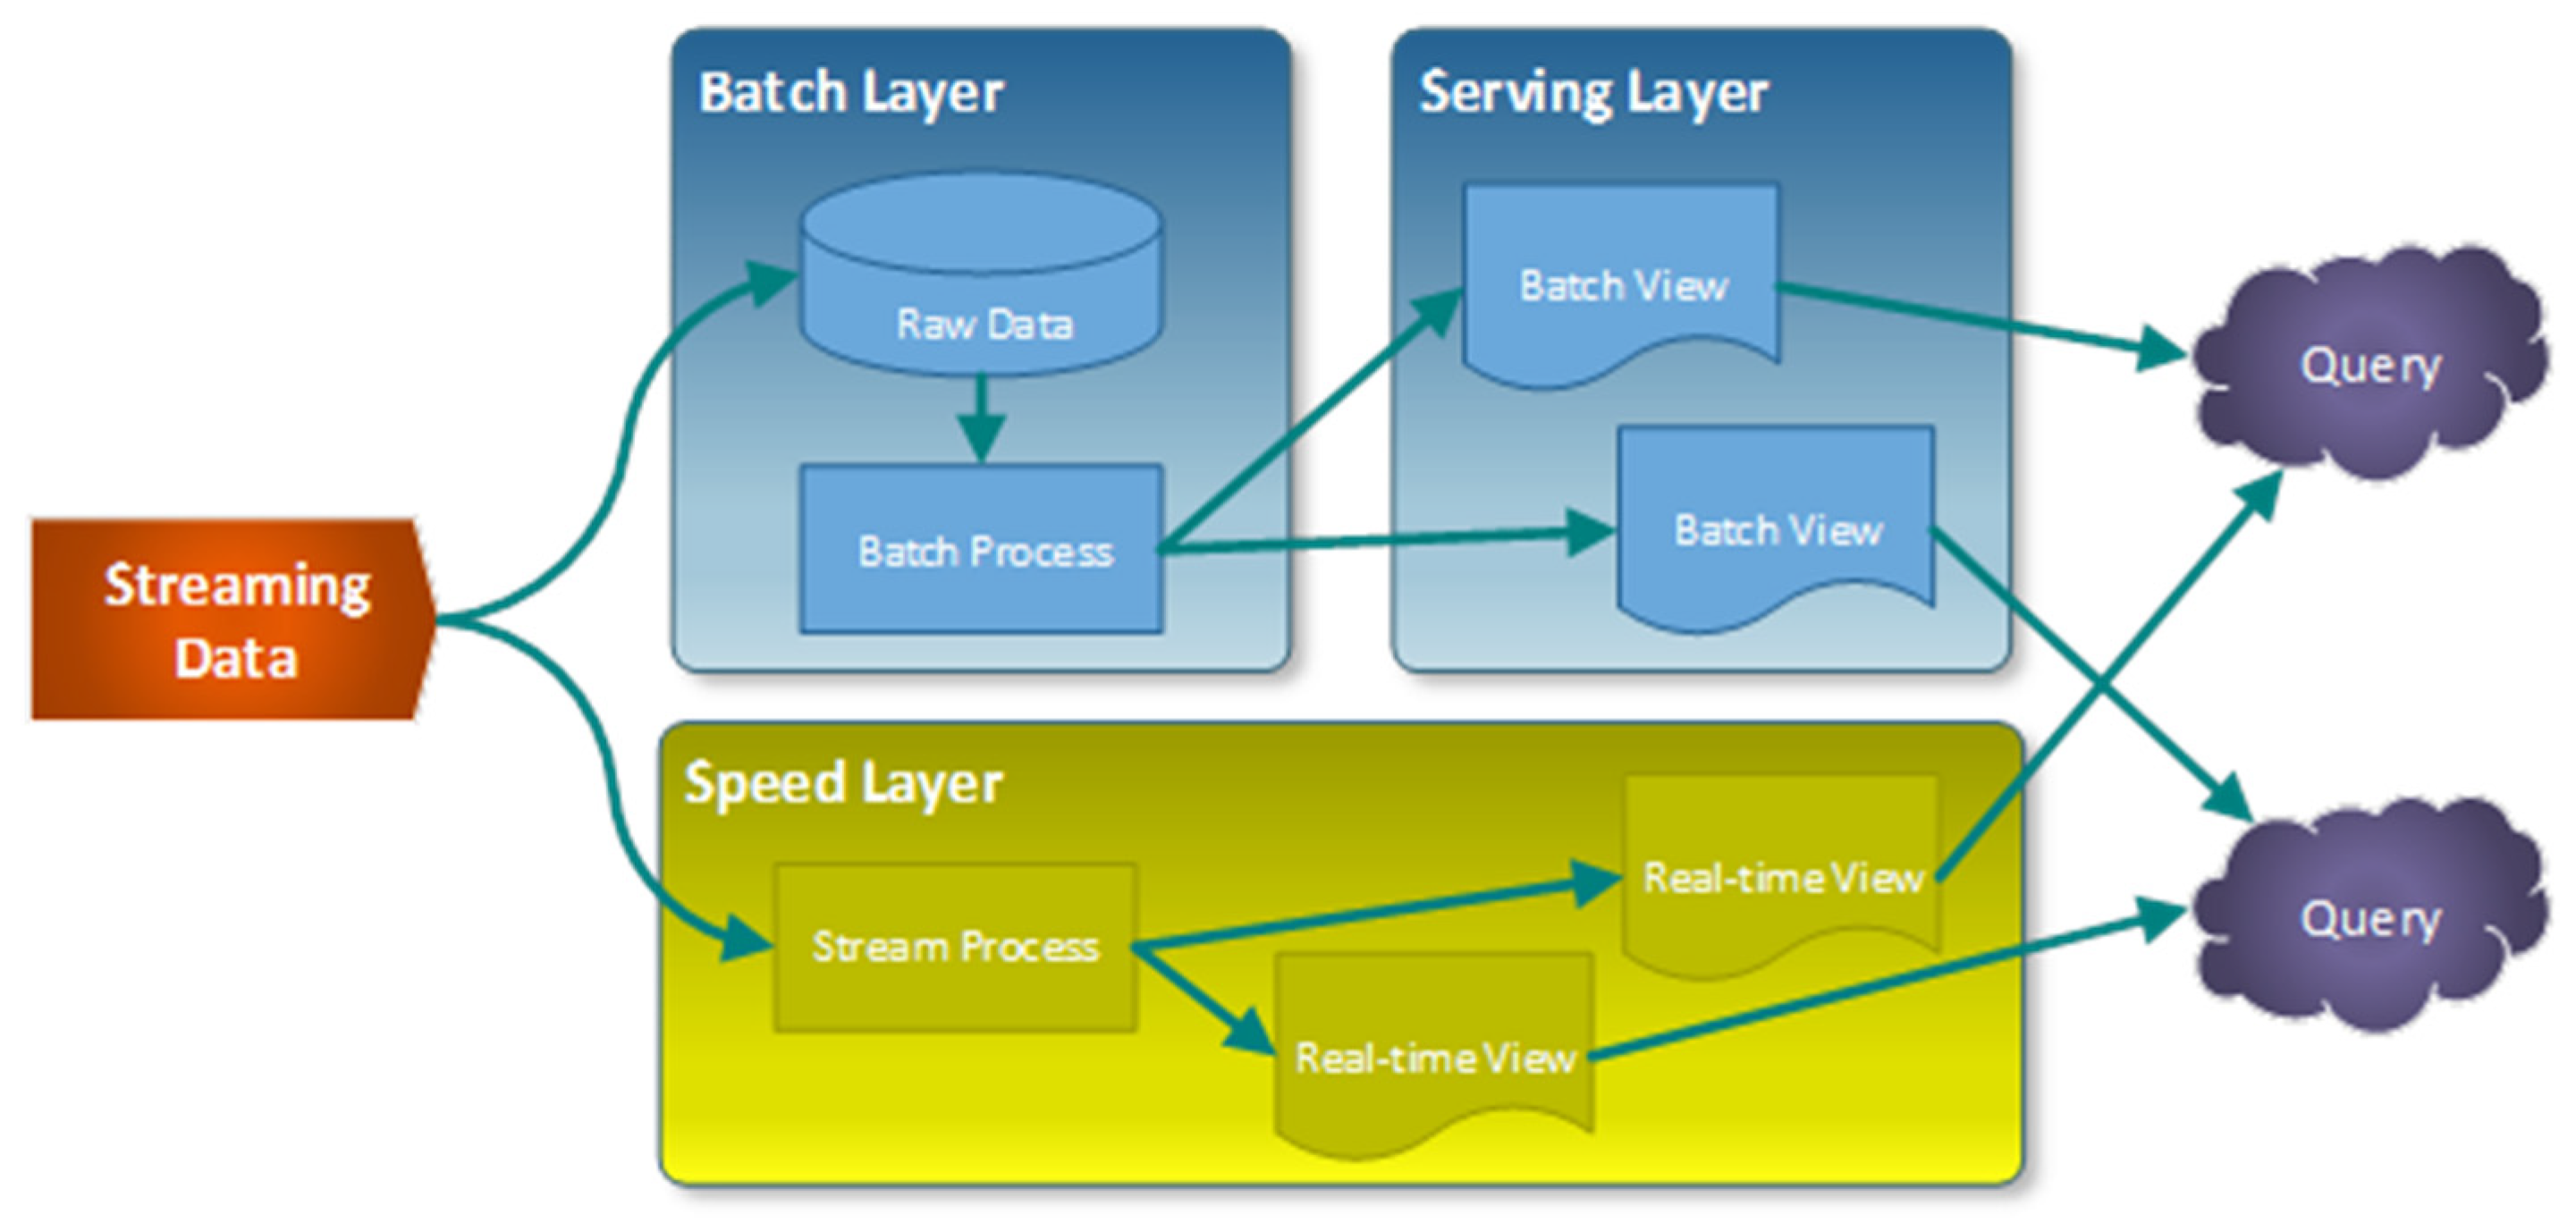
The architecture chosen for the cloud-based system for the environmental monitoring of big data followed the principles of the Lambda architecture [
1]. This was adequate because it combined real-time information (transmission type processing) with heavy processing information (batch type processing). The objective of the chosen architecture is to have a robust fault-tolerant system, that was linearly scalable and that allowed writing and reading with low latency. A typical Lambda architecture scheme is shown in
Figure 1:
As seen in the scheme, it has three distinct layers:
1. The batch layer, where the raw information is managed.
2. The serving layer, where the information to be presented in the queries is prepared and has as its main feature a low latency.
3. The speed layer, where only the latest information is used to provide real-time information.
From the general scheme, for the case at hand, an adaptation was made using web technologies such as Django, MongoDB, and VUE and remaining as shown in the following
Figure 2:
In our case, the starting point was the master database, where the raw data was stored. Here, an immutable data set was built, only for the annexation of raw data.
As the batch layer, we had a pre-processed (Application Programming Interface) API that performed a first basic data treatment to select the most relevant data according to our objective. From there, the serving layer was responsible for executing the machine learning algorithms required by the view, always leaving the last calculated available, thus ensuring low latency. On the other hand, the architecture had a speed layer, which, when required to by the view, read only the last data received and performed fast processing to show them in real time. In this way, the view combined real-time data with the heaviest data from the machine learning.
2.2. Layer of OnLine Processing And Display of Information
When displaying the information, we chose to use a single-page application (SPA) in order to offer a fluid experience to users, just as a desktop application does. In this sense, all HTML, JavaScript, and CSS codes were dynamically loaded according to the user’s interactions on the page.
To achieve this implementation, the JavaScript-based frontend framework VUE.js [
2] was used. Its main advantages over others of the same style are its progressive adaptation as the complexity of the application increases; its intuitive functionality, being modern and easy to use; a varied ecosystem, which covers everything you need; a very active community; and that it is very well componentized.
For the representation of the graphics of the application, the use of the Bokeh [
3] library was chosen. This graphics display library provided us with information presented in a modern, elegant, and concise way. It was also very versatile, but above all, the critical aspect for what was chosen was that it offered interactivity with the user, with high performance over very large or streaming datasets.
Because underwater noise is usually recorded with a high sampling rate (in the order of 104 to 105 samples per second) compared to other maritime data (waves, temperature, pH, electromagnetic fields, etc.), the resulting log files have a large amount of data. In the first instance, for a better understanding of the acoustic signals, processing techniques are used. These techniques can be applied to the entire signal as well as to temporary windows, so that they reduce the data to be displayed at the user’s request, allowing them to adapt to the processing capabilities of a cloud server. These processing techniques have been classified in two groups:
On the one hand, the application implements calculations of the statistical parameters of end and centralization in the time domain, such as the peak-to-peak value or the root mean square value. In addition, it allows the spectrum of the signal in the frequency domain to be obtained as well as the estimation of the Sound Pressure Level (SPL) [dB re 1 µPa] in different frequency bands and their corresponding percentiles. As will be seen, the application of this processing to different temporary windows of the signal allows the evaluating of the stationarity of the measured parameters.
On the other hand, the application allows the calculation of Descriptor 11 Criteria 2 (D11C2) of the Marine Strategy Framework Directive (MSFD), which is the indicator for continuous underwater noise pollution in this directive), associated with the quantification of the continuous noise in the third octave bands centered at 63 and 125 Hz. It considers the different calculation parameters that can be extracted from different methodological guides and expert groups [
4,
5].
2.3. Machine Learning for Big Data
Machine Learning (ML) techniques constitute a breakthrough in the field of analysis and classification of large data sets [
6]. The main objective of this work was to incorporate the position variable (geographic coordinates) as an additional feature to the characteristics of the noise signal recorded by the application. This means that ML algorithms consider the coordinates in which noise measurements were made as one more variable in the classification process. The main idea was to improve the results in the assignment of groups by having a spatial variable, as the place where a noise occurs can be defining depending on external agents, such as, for example, a channel where a large numbers of ships pass the docking area of the port, an open sea area, etc. To do this, GIS tools were used for grouping by position with supervised classification algorithms.
In this application, cluster analysis was used using the ML algorithm called the k-nearest neighbors algorithm (k-NN). As it is a supervised classifier, the estimation of the classes of the samples is carried out through training samples—a grouping of data that has similar characteristics to each other and that have an associated class known to the operator. The determination of the training samples modifies the result of the classification, so it is important that these samples are correctly defined [
7].
Basically, the algorithm works as follows: when it is necessary to establish a classification on a set of data, the k-nearest neighbors algorithm searches among the training samples for the instances closest to the sample that is intended to establish the class value, up to a user-defined value of number of neighbors. The most repeated class of the closest instances obtained are the class awarded by the sample to be classified. Therefore, entering a different number of neighbors’ values in each classification modifies the results. Usually, the higher the number of neighbors’ values, the better the classification accuracy.
3. Results
3.1. Prototype Application
The built application had three main sections:
1. Home, where the objective and context of the project was shown.
2. Processing, which allowed the generation of different information processes, both in time and frequency, by selecting the desired time and frequency intervals.
3. GIS, which allowed advanced machine learning calculations to be performed with ESRI’s own techniques on a map. An example of this section is where a map focused on the Port of Cartagena, with different measurement locations showing submarine noise were shown.
3.2. Processing Test
To measure the performance of the application developed in Django with Python, measurements were made of the time required for the execution of each of the processes developed for a series of signals with different time duration, both stationary, for the entire signal, and non-stationary by setting time intervals.
The following
Figure 7 shows the processing times of different parameters depending on the duration of the processed signal. In absolute terms (left), the calculation time of the FFT was much longer than the other processing, while the calculation of D11C2 and SPL were around an order of magnitude below and the RMS two orders below. In relative terms (right), we can see that the RMS, SPL, and D11C1 processes had approximately the independent duration of the original signal, even decreasing for the RMS.
To delve deeper into the calculation of the parameters under study, the processing of the same signals as above but cut at different time intervals (0.05, 0.1, 0.5, and 1 s) was tested. The results are shown in the following
Figure 8.
It was observed that the processing time did not improve, except for long durations of the original signal, where it is noted that for certain intervals the computational cost improved. Although the time periods studied are quite short, their influence is important for the qualification of D11C1 and its influence on the resulting percentiles and values [
8].
3.3. Machine Learning Test
The results of grouping without adding position variables can easily be seen in the following
Figure 9. The results obtained with the use of the k-NN algorithm taking into account the position variable showed a more defined spatial differentiation (right image) than in the algorithm that only took into account the characteristics of the signal (left image). The context of the example is an area in proximity to the Port of Cartagena (Spain).
4. Conclusions
The implementation of a cloud-based architecture for the recording, processing, and spatial analysis of underwater noise signals was tested. Although the implemented application is a preliminary version with a view to R&D, it was able to run with real signals and in real contexts.
Some results show processing techniques based on temporary windows that can reduce calculation times and adapt to the most current D11C2 definitions. In addition, although the results of applying ML techniques taking into account the position of the signals are preliminary, they show fairly consistent results that can be exploited in future studies.
Author Contributions
Conceptualization, I.F.E. and P.R.; methodology, I.F.E. and P.R.; software, P.R. and M.d.l.T.; formal analysis and data curation, I.F.E.; writing—review and editing, I.F.E., P.R. and M.d.l.T. All authors have read and agreed to the published version of the manuscript.
Funding
This research was funded by the Instituto de Fomento de la Región de Murcia (INFO) under the program of grants aimed at technological centers of the Region of Murcia for the realization of non-economic R&D activities. Modality 1: Independent R&D Projects, with File No.: 2017.08.CT01.0043 and 2019.08.CT01.0037.
Acknowledgments
Thanks to the Port Authority of Cartagena (APC), for its support and collaboration for the realization of measurements that will allow the implementation of new techniques and technologies for the sustainable ports of the future.
Conflicts of Interest
The authors declare no conflict of interest.
References
- Hausenblas, M.; Bijnens, Y.N. Lambda Architecture. Available online: http://lambda-architecture.net/ (accessed on 11 November 2019).
- MIT; Vue, J.S. Available online: https://vuejs.org/ (accessed on 11 November 2019).
- Anaconda and Bokeh Contributors, Bokeh. Available online: https://docs.bokeh.org/en/latest/ (accessed on 11 November 2019).
- Dekeling, R.P.A.; Tasker, M.L.; Van der Graaf, A.J.; Ainslie, M.A.; Andersson, M.H.; André, M.; Borsani, J.F.; Brensing, K.; Castellote, M.; Cronin, D.; et al. Monitoring Guidance for Underwater Noise in European Seas, Part II: Monitoring Guidance Specifications; JRC Scientific and Policy Report EUR 26555; Publications Office of the European Union: Luxembourg, 2014. [Google Scholar]
- Dekeling, R.P.A.; Tasker, M.L.; Van der Graaf, A.J.; Ainslie, M.A.; Andersson, M.H.; André, M.; Borsani, J.F.; Brensing, K.; Castellote, M.; Cronin, D.; et al. Monitoring Guidance for Underwater Noise in European Seas, Part III: Background Information and Annexes; JRC Scientific and Policy Report EUR 26556 EN; Publications Office of the European Union: Luxembourg, 2014. [Google Scholar] [CrossRef]
- Arcila-Calderón, C.; Barbosa-Caro, E.; Cabezuelo-Lorenzo, F. Técnicas big data: Análisis de textos a gran escala para la investigación científica y periodística. El Profesional de la Información 2016, 25, 623. [Google Scholar] [CrossRef][Green Version]
- Burkov, A. The Hundred-Page Machine Learning Book; Kindle Direct Publishing: Seattle, Washington, D.C., USA, 2019. [Google Scholar]
- Merchant, N.D.; Barton, T.R.; Thompson, P.M.; Pirotta, E.; Dakin, D.T.; Dorocicz, J. Spectral probability density as a tool for ambient noise analysis. J. Acoust. Soc. Am. 2013, 133, EL262–EL267. [Google Scholar] [CrossRef] [PubMed]
- Enguix, I.F.; Egea, M.S.; González, A.G.; Arenas, D. Acoustic characterization of impulsive underwater noise present in port facilities: Practical case of the Port of Cartagena. Proceedings 2018, 4, 57. [Google Scholar]
- Urick, R.J. Principles of Underwater Sound, 3rd ed.; McGraw-Hill, Inc.: Los Altos Hills, CA, USA, 1983. [Google Scholar]
- Ruiz, P. Sound Impacto of Mutriku Oscillating Water Column Plant: Unerstanding MSFD Descriptor 11. In Proceedings of the XIV Jornadas españolas de ingeniería de costas y puertos, Alicante, Spain, 24–25 May 2017. [Google Scholar]
- MSFD Calibration Guidelines. Available online: http://www.quietmed-project.eu/wp-content/uploads/2019/01/QUIETMED_D3.1.-Best_practices_guidelines_on_sensor_calibration_final.pdf (accessed on 11 November 2019).
- MSFD Signal Processing Guidelines. Available online: http://www.quietmed-project.eu/wp-content/uploads/2019/01/QUIETMED_D3.2_Best_practices-guidelines_on_signal_processing_final.pdf (accessed on 11 November 2019).
- MSFD Acoustic Modelling Processing Guidelines. Available online: http://www.quietmed-project.eu/wp-content/uploads/2019/01/QUIETMED_D3.3_Best-practices-guidelines-on-acoustic-modelling-and-mapping_final.pdf (accessed on 11 November 2019).
| Publisher’s Note: MDPI stays neutral with regard to jurisdictional claims in published maps and institutional affiliations. |
© 2019 by the authors. Licensee MDPI, Basel, Switzerland. This article is an open access article distributed under the terms and conditions of the Creative Commons Attribution (CC BY) license (https://creativecommons.org/licenses/by/4.0/).


