1. Introduction
A sensor network is characterized by the distribution of sensor nodes able to capture information, such as temperature, positioning, depth, wind speed, or even capturing an image and transmitting the information to a system able to interpret and process the collected data. The sensors can be distributed in previously established positions or randomly in a given area, known as sensing area. They can also be fixed or mobile, depending on the application.
In certain cases, these sensors are best installed in remote terrains, such as forests, for example, or agricultural fields, or even in battle fields. For civilian applications, these sensors can be installed in more urbanized places, such as universities or industries, for example.
Regardless of the characteristics of the application, the sensor network must be able to meet the minimum service requirements, such as capacity of delivery, transmission delay, power consumption, fault tolerance, and sensing capacity. The other two requirements that must be considered part of quality of service in a sensor network, and that have a direct impact on the consumption of power are connectivity and the coverage provided by the distribution of the sensor nodes [
1]. According to [
2], the attention of researchers has been increasingly drawn to this last parameter, since many times, the sensor nodes are distributed randomly in the sensing area, and therefore the correct calculation of the ratio between coverage and number of nodes is essential in order to reach the objectives of the application.
In further consideration of coverage, in environmental monitoring for example, there are fixed sensors, which simplifies the analysis of sensor distribution and, consequently, of coverage capacity. For a broad range of applications, it is impossible to divide the network into disconnected sets of nodes, making the problem of connectivity a crucial issue. For the purpose of this paper, the coverage and the connectivity of the sensor nodes are considered conjointly.
Other papers related to similar problems are present in [
3,
4,
5,
6,
7,
8,
9,
10,
11,
12,
13,
14].
The scope of this paper is to present a mathematical model based on the calculation of the probability of a given sensor in movement to transmit or receive captured information or control messages, such as synchronization messages, using the sensing area, the sensor transmission range, and the number of active nodes distributed in the target area as input parameters. To this end, the mathematical model that was developed is presented, considering sensor nodes moving at low speeds (e.g., a flock in a field), and at high speeds (e.g., drones over a forested or natural disaster area) and the deployment of the software model.
While leaving many sensor nodes in a state of dormancy increases the power efficiency of the network as a whole, it also reduces both the sensing area coverage as well as its connectivity [
15].
An area is considered as having coverage when each point in the area to be monitored is under the surveillance of a sensor node, while a wireless sensor network is considered connected if each pair of sensor nodes is able to communicate directly or indirectly with other sensor nodes, with the purpose of discovering a minimum subset of active sensor nodes for the captured data to be sent to the processing system or the sink node [
16].
2. Description the Problem and Methodology
The capacity of a message being delivered on the network depends on the existence of a path defined by the routing protocol. This dependence is related to the distance between the sensor nodes and the speed that these nodes are moving at. The implementation of this model is based on the assumption that the mobility of the sensor nodes always takes place within a defined sensing region and a known area.
Considering the
t0 and
t1 steps of a discrete event simulator, there is a probability that the sensor node will be connected at
t1, assuming that it was connected at
t0.
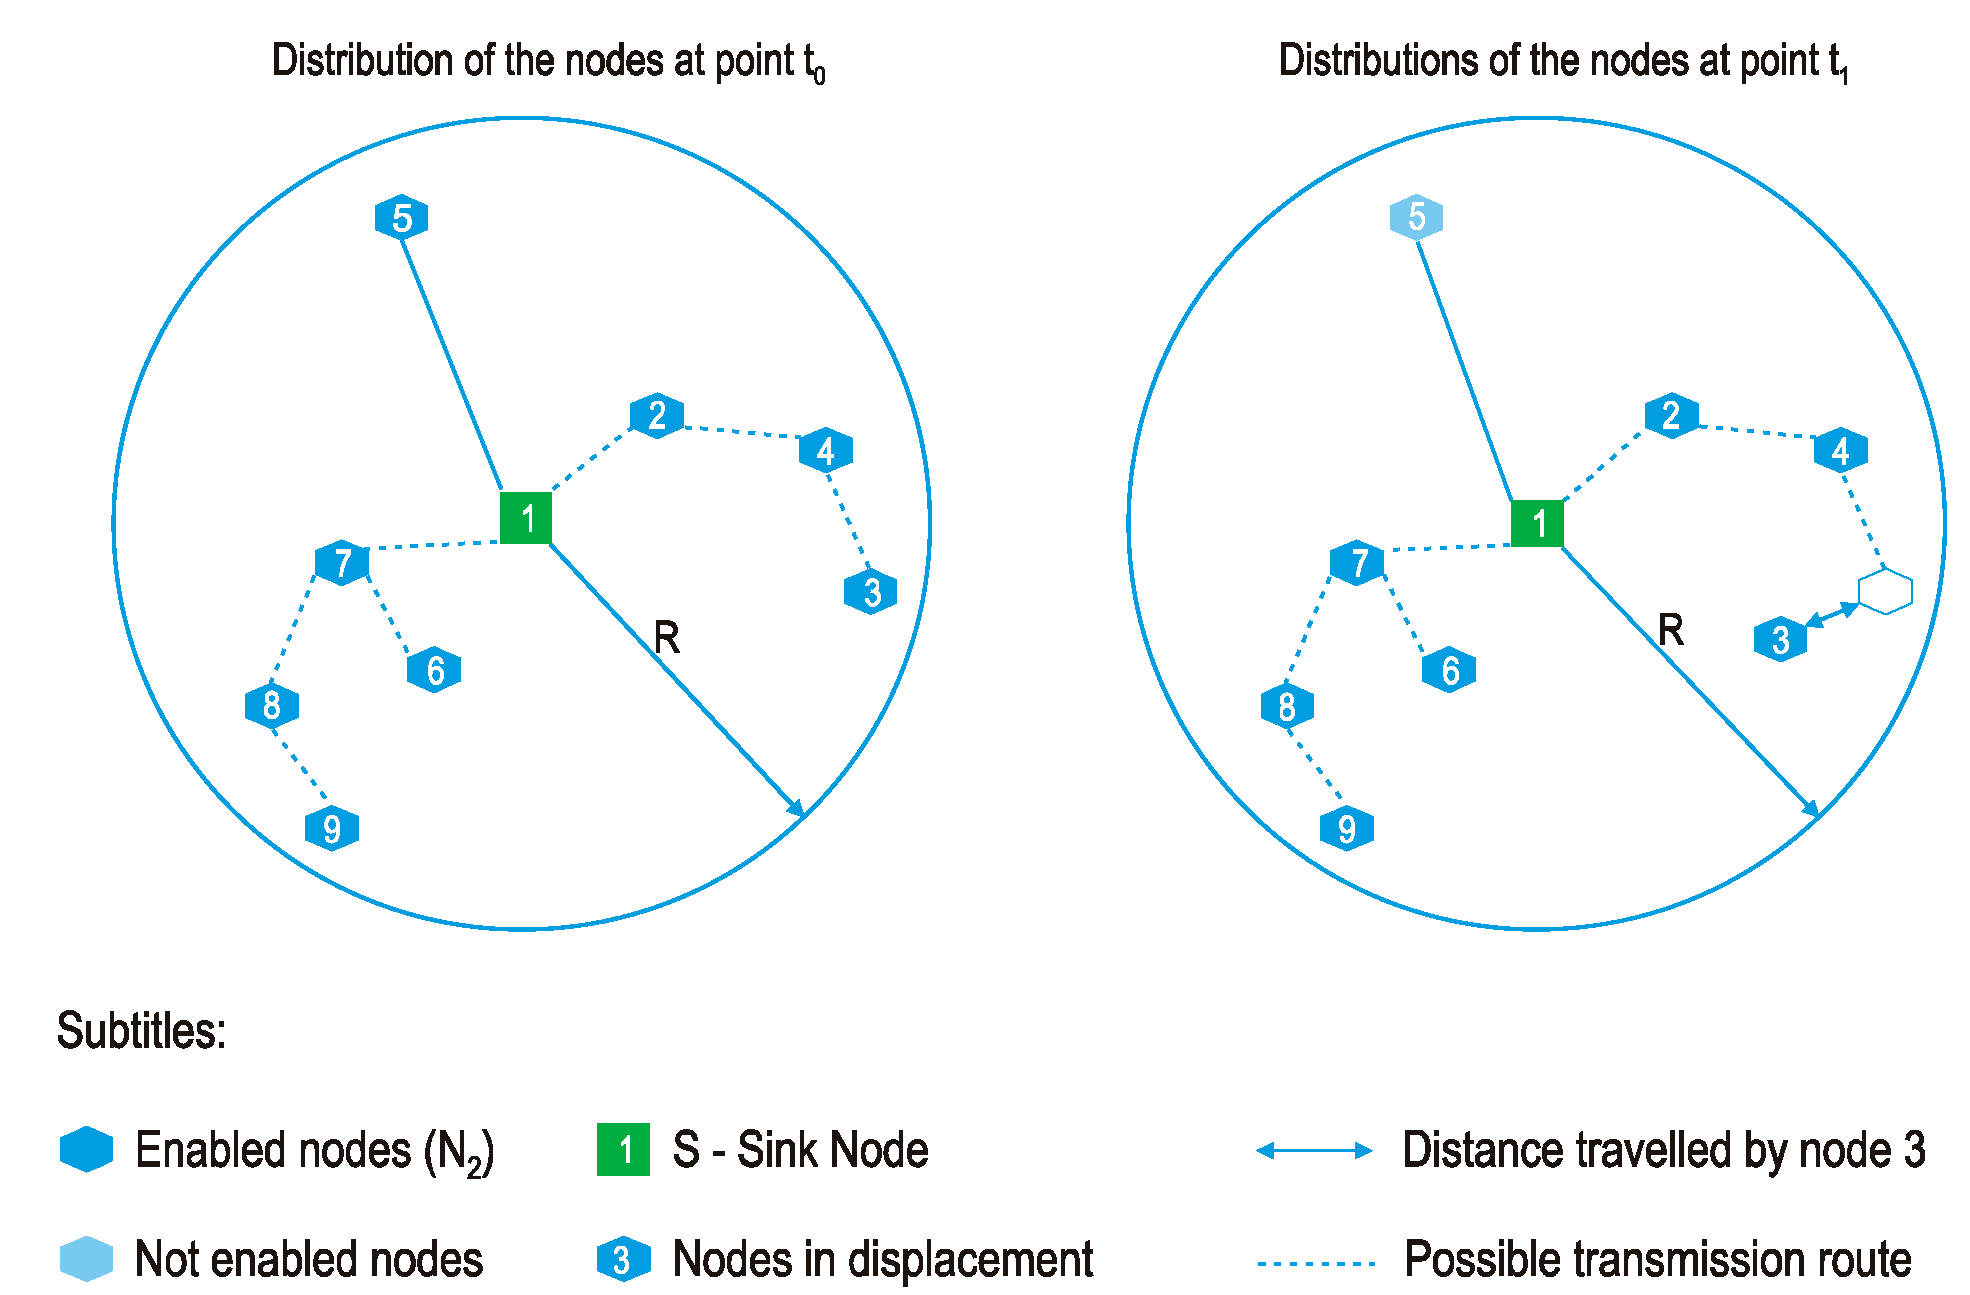
Figure 1 presents two distributions of sensor nodes in a sensing area. At
t0, the sensor nodes were distributed randomly. Therefore, there is a probability that a sensor node will be connected at t
0, defined as
Pt0. At the next t
1 instant, due to the mobility of the sensor nodes, the distribution of the sensor nodes in the sensing area will not be the same. Therefore, there is a new probability that a sensor node will be connected, defined as
Pt1.
In the case of high speeds, this probability is a random variable that depends on the coverage area, while for low dislocation speeds, the probability of the sensor node being connected depends on the coverage area and the state of connectivity in the previous step.
The distance traveled by the node (D
p) is calculated by the following Equation (1):
If D
p is greater than r (D
p > r), than the dislocation speed is considered high and the probability of a given x
i sensor node receiving a synchronization message at
t0 is the same as the probability of this same sensor node receiving a message at
t1. This is called the P
random Probability, as shown in Equation (2) below:
For the sensor node dislocation speed to be considered low, the distance traveled by the sensor node at ∆t (t1 − t0) must be less than the distance of the radio transmitter’s range (Dp < r) of the same sensor node, considering that at t0, there is a valid communication route between the sensor node and the sink node.
The probability of sensor node x
1 receiving a message (e.g., synchronism message) at t
k, assuming that this message was received at t
0, is calculated by Equation (3):
The probabilities of an xi sensor node establishing communication with the sink node when moving at high or low speeds is given by Prandom, which is calculated estimating the coverage area.
For a simple case with two sensor nodes, the probability of communication using an intermediate node as relay is presented in Equation (4):
One can thus remove the condition of the probability presented in Equation (4) and eliminate parameter ρ, and obtain from this the probability, based on parameters R (radius of the sensing area) and r (transmission range of the sensor node), resulting in Equation (5), which shall be used to validate the model.
For the generalization of the Prandom, one must calculate the total area of coverage by up to four sensors and discount the intersections. This results in the expression used in our simulator.
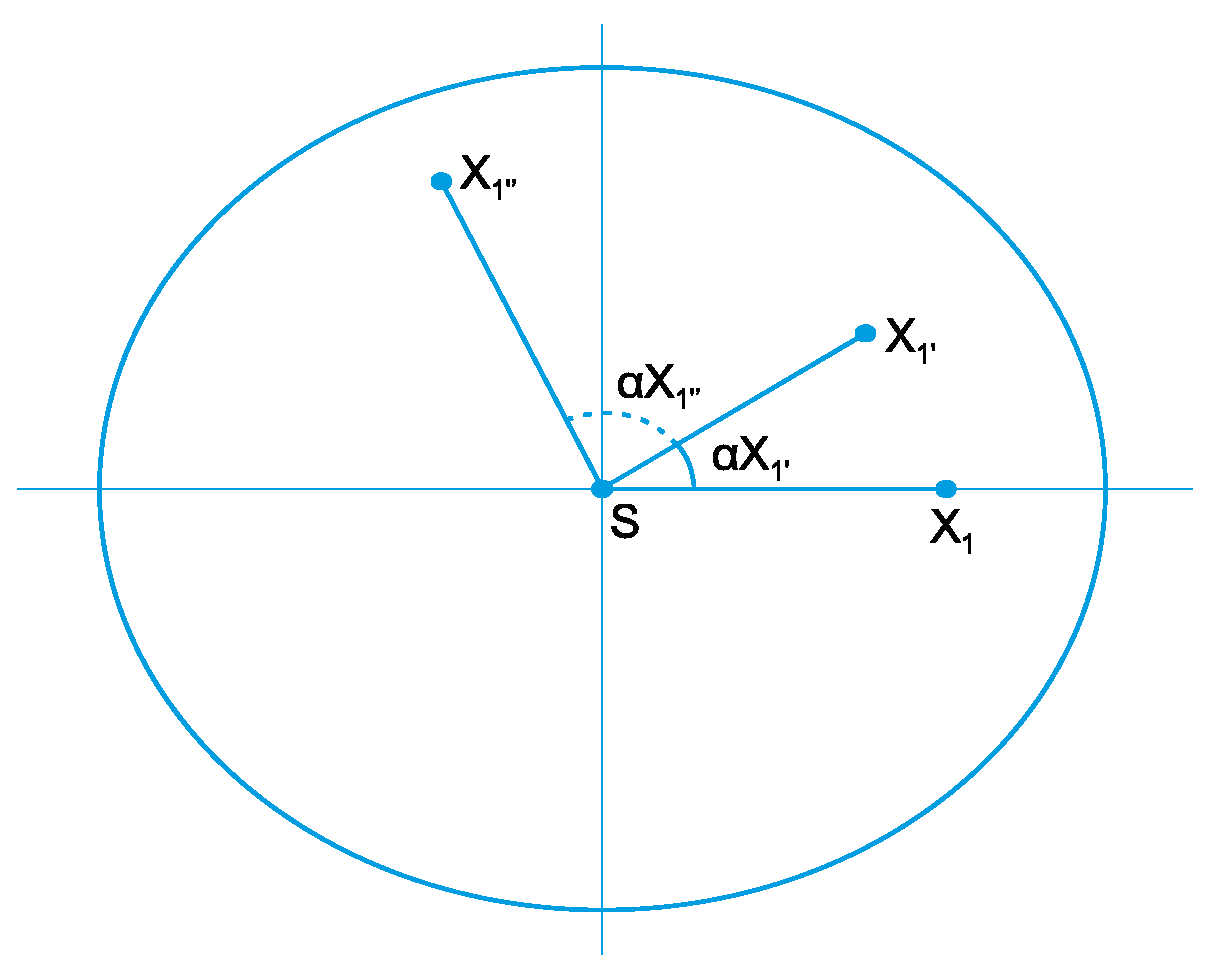
Based on the analysis of the several possible cases presented, one can determine that the area added by a given
X1i sensor node, positioned within the range of the S central sensor node, can be generalized by Equation (6), displayed below, as long as all X
1i sensor nodes are ordered ascending from angle α, as shown in
Figure 2.
Thus, the generalization of P
random to establish communication between sensor node
X2, positioned outside the range of central sensor node S, and the sink sensor node, by means of sensor node
X1, positioned within the range of the sink sensor node, is calculated by Equation (7)
where A
SR is the sensing area and is calculated by: A
SR = πR
2.
3. Simulation
To analyze the probability of a given node to establish communication with the sink sensor node, a software was developed in MATLAB, based on the Monte Carlo Method. This statistical simulation method uses a random sequence of numbers to develop simulations. In other words, it is considered a universal numerical method to solve problems by means of random sampling (approximating the solution).
There is no need to write down the differential equations describing the behavior of complex systems for this method. The only requirement is that the physical or mathematical system be described (modeled) in terms of functions of density of probability distribution (FDP). Once these distributions have been established, the Monte Carlo simulation can begin random sampling based on them. This process is repeated innumerable times, and the desired result is obtained by means to statistical techniques on a given number of executions (samples) that can vary from dozens to millions of times [
17].
3.1. Validation
Considering two sensor nodes,
X1 and
X2 with a transmission range of r, randomly distributed in a circular sensing area ASR, with a radius of R and an S sink node, positioned in the center of the A
SR area, there is a probability P(Ei) of four possible events occurring, as described in
Table 1.
For each event in
Table 1, simulations were carried out using the developed software. The parameters used for simulations is described in
Table 2. The results were compared with the results returned from the mathematical solution developed and presented in
Section 3.
Event E
3 is mathematically modeled in
Section 3, and its extrapolation was implemented in software, for a given
Xi sensor node to establish communication with the sink node through n hops. Thus, to validate the software, 22 simulations were executed, with a fixed number of repetitions defined for each simulation. The first simulation was repeated 8000 times and the last 60,000 times. The calculated and simulated results for the other events, as well as the mean of the simulated results achieved for event 3, are presented in
Table 3.
The main event analyzed is E
3, since this event represents the probability of a sensor node communicating with the sink node through another sensor node (X
2 → X
1 → S). As observed in
Table 3, the average probability obtained with the simulation of the developed software was 0.33%, while the mathematically calculated probability was 0.33% (using Equation (5)). This shows that it is possible to use software to achieve simulation results for extrapolated scenarios; in other words, with quantities higher than two sensor nodes, without the need of developing complex mathematical models.
3.2. Experiments and Measurements
In order to simulate a scenario as similar as possible to a real-life situation, we used a circular sensing area equivalent to a 4000-hectare farm [
18], sensors with a 100-m transmission range, and the sink node placed in the center of the Area.
Table 4 shows all the input parameters used in the simulation. In the simulation scenario, the delay in communication between the sensor and sink sensor node is not taken into consideration.
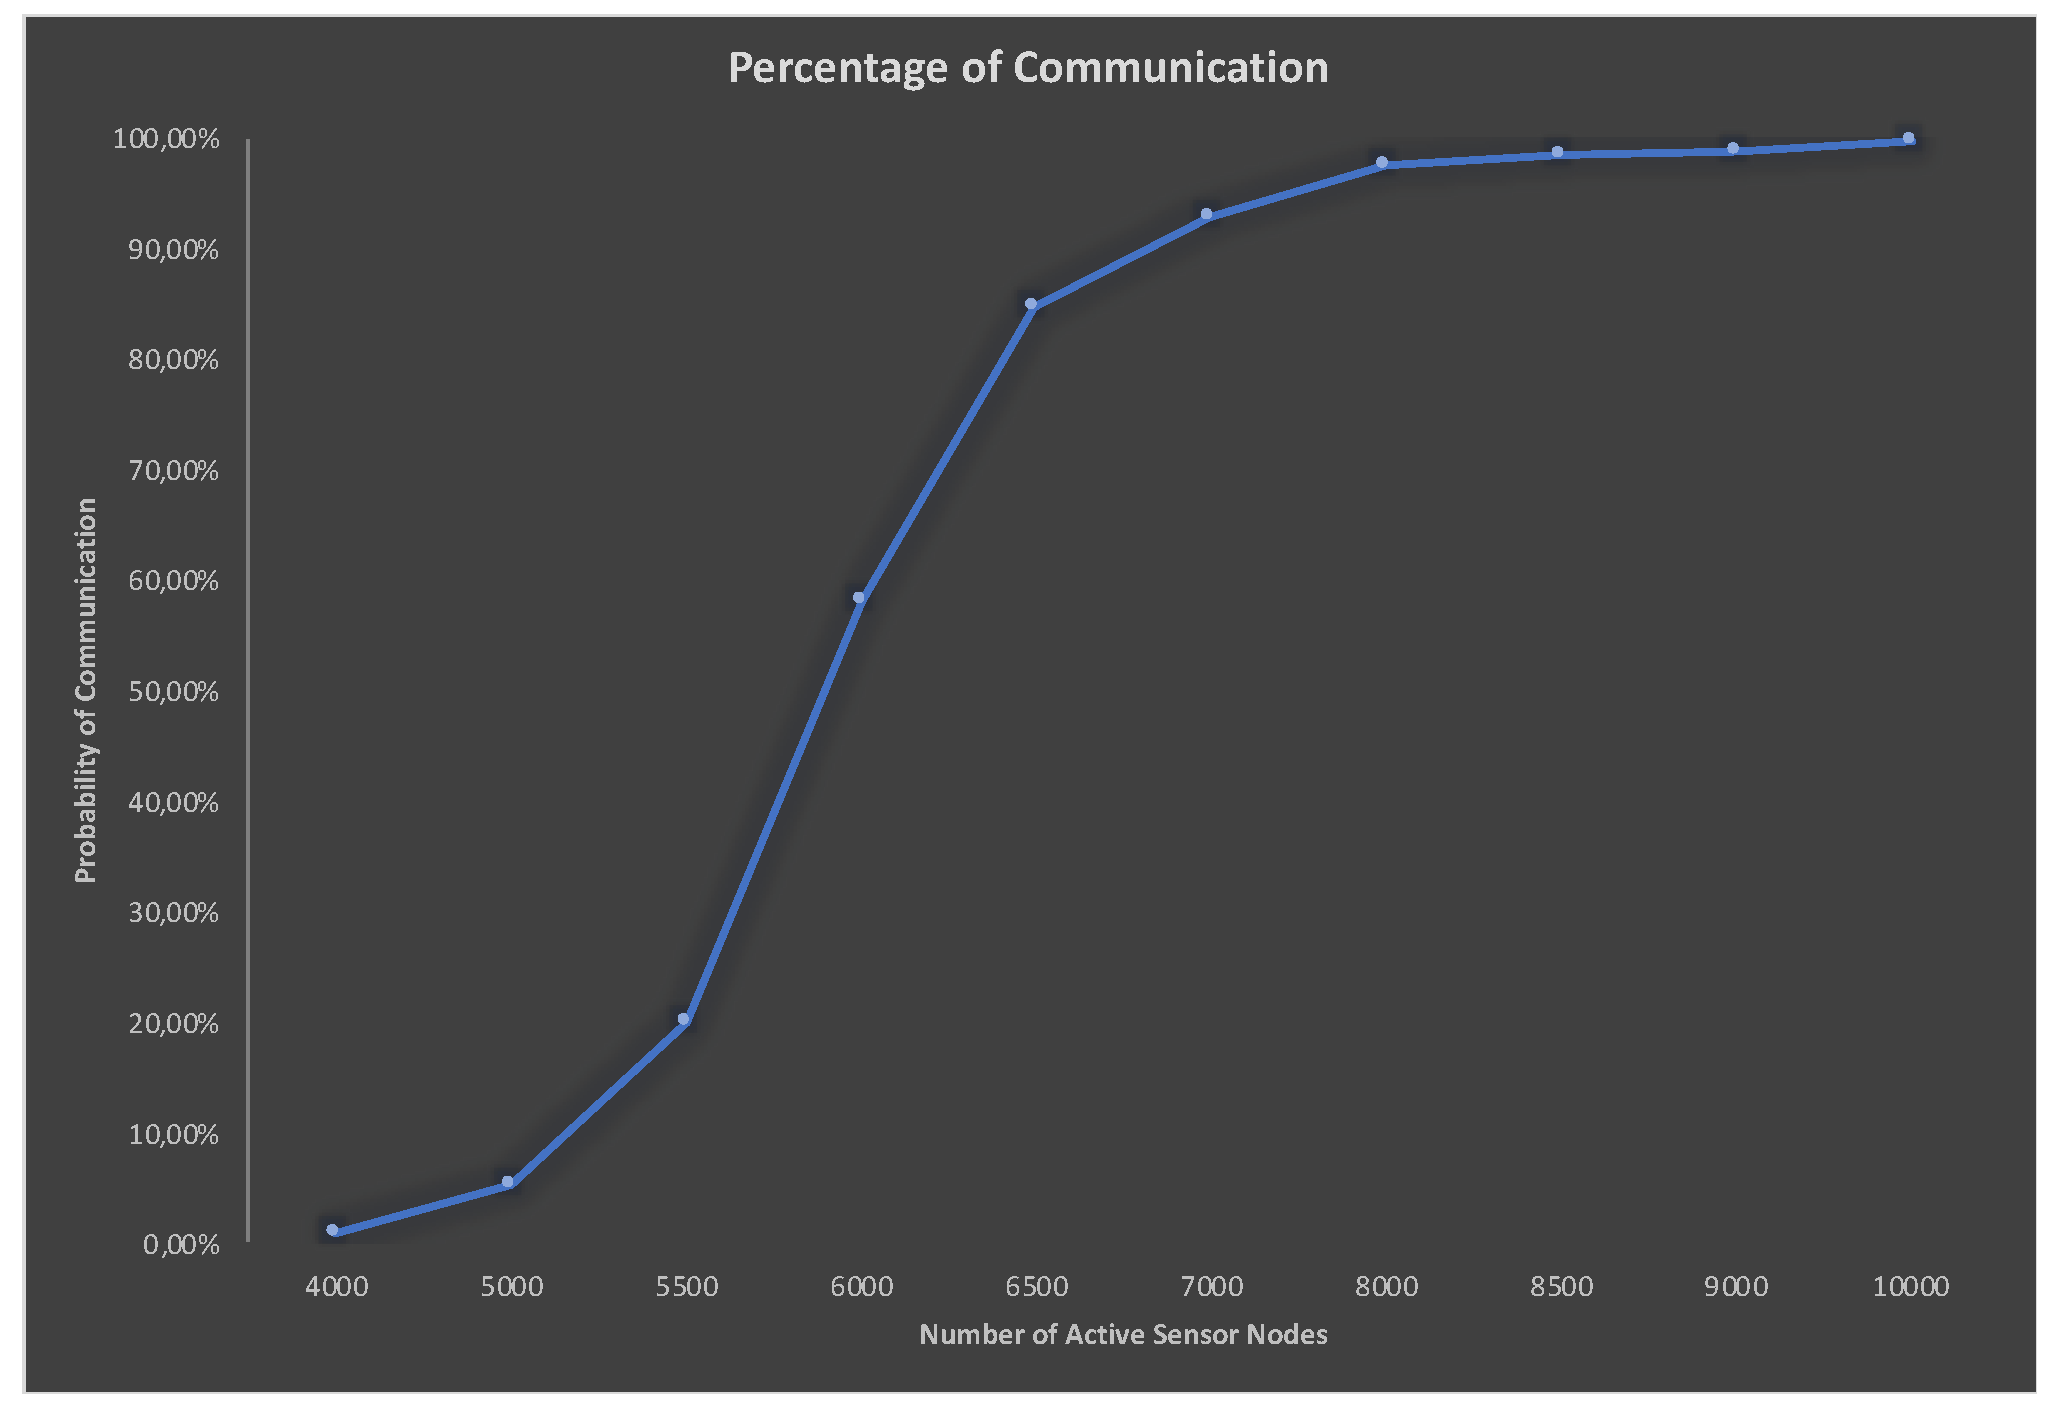
The achieved results, shown in
Figure 3, demonstrate that if 4000 sensors are distributed over an area to be monitored, the probability of a new sensor randomly distributed in this same area being able to establish contact with the sink node is 0.96%. However, if in this same area, there are 7000 sensors, the probability of communication soars to 92%. This means that for an increase of 75% in the number of sensors, the probability of there being communication is 96.8% higher. On the other hand, to achieve a 99.77% probability of communication, the number of sensors must be increased 2.5 times.
Based on the data achieved with 8000 sensors, the probability of communication is 97.59%. However, to achieve a probability of communication 1.0223 times higher, the number of sensors would have to be increased by 25%. This shows that, for a given number of distributed sensor nodes, there is a saturation of the probability of communication, which leads to the conclusion that any gains from increased sensor node distribution, without evaluating the coverage, is minimal.
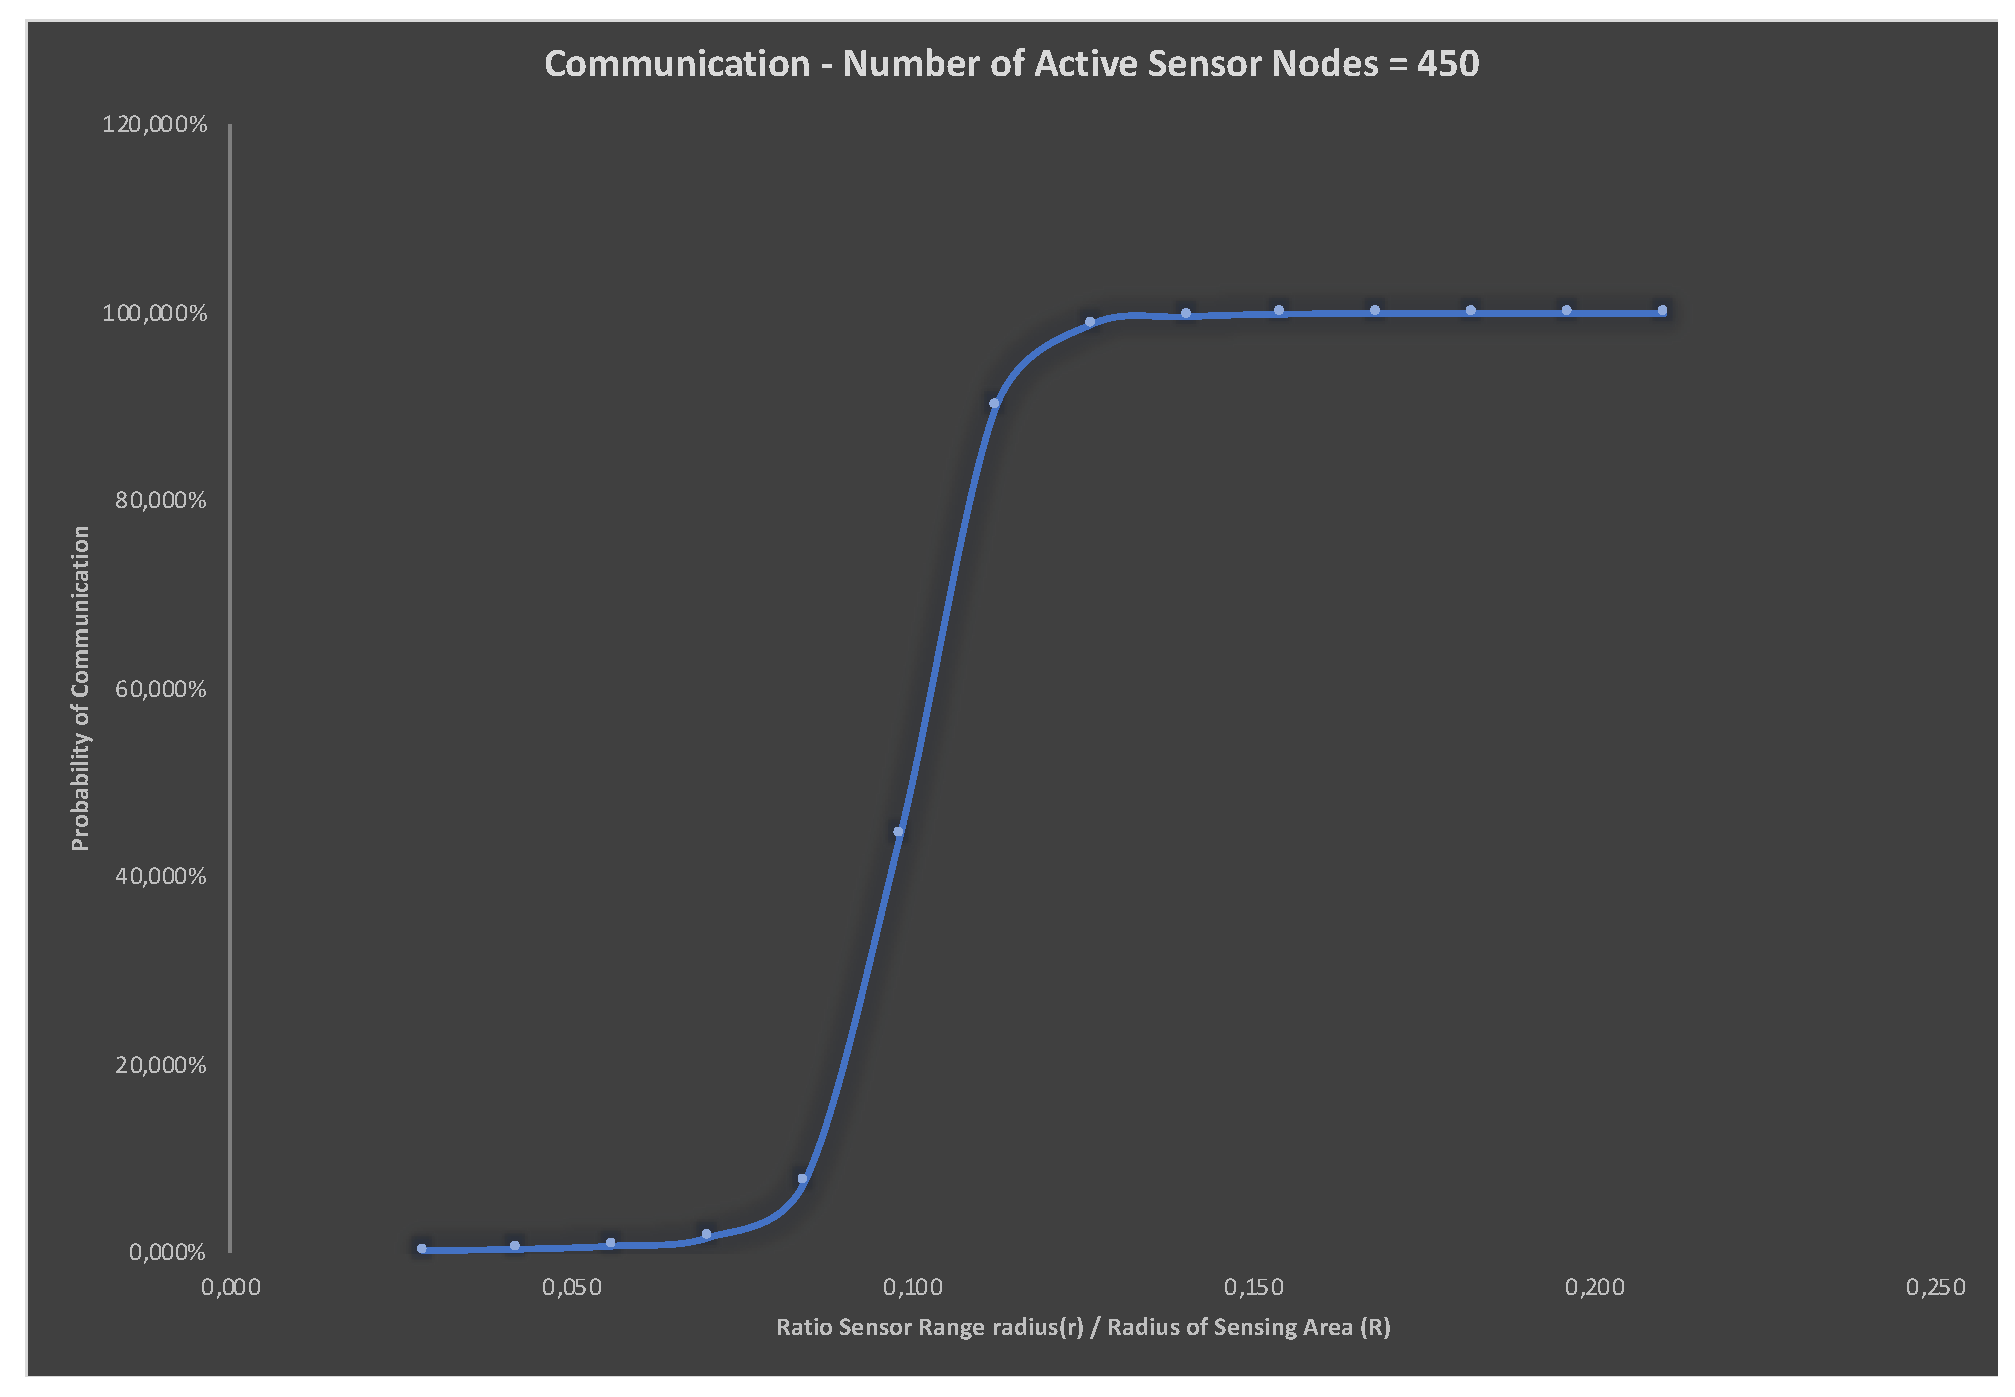
In order to evaluate the behavior of the probability of communication in relation to the variation of the coverage radius of the sensor (r/R), another simulation was carried out. For this study, the number of sensor nodes was fixed, and the variation of the sensor node transmission range (r) was executed in steps of 50 m, starting at 100 m (base scenario).
To establish the number of sensor nodes to be used in the simulation, a new simulation was made, with the transmission range of the sensor node fixed at 0.1 of the radius of the sensing area, that is, r = 0.1R, and the number of active sensor nodes was varied from 100 sensors up, with additions of 100 units.
Based on the results achieved with this simulation, it was established that with 450 active sensors, the probability of communication is 49.48% (approximately 50%), and, therefore, this was the amount of sensor nodes chosen to verify the behavior of the sensor nodes based on the relation r/R. The behavior of the probability of communication based on the relation (r/R) is presented in
Figure 4.
An analysis of the results shows that the relation r/R is a determining factor only in one segment of the relation r/R. Based on the approximate value of r/R = 0.12, the probability of communication remains practically the same. This is relevant from the viewpoint of sensor network designers who need specific equipment that have both optimal coverage, which means higher transmission ranges, and sensors with long-lasting batteries.
4. Conclusions
This paper establishes a way to evaluate the probability of communication between a given sensor node and the sink node. The achieved results demonstrate an increasing relationship between number of sensor nodes and the probability of communication, by which it is possible to evaluate the gains in communication by increasing the number of nodes in a sensing area.
This interpretation can be extrapolated, bringing one to the conclusion that the probability of communication demonstrates the coverage percentage of the monitored area.
With the software developed to execute the simulation, it is possible to reduce the complexity of mathematical models to analyze the coverage and communication in sensor networks that require large amounts of sensor nodes.
Another relevant contribution lies in the analysis of the relation between the range of the sensor, the sensing area, and the number of nodes, since these factors bear a significant impact on the life of the sensor batteries. This has been studies over the years, and the analysis of the r/R relation from this perspective contributes to increasing the efficiency and minimizing the deployment costs of sensor networks.
The proposed model can also be used for different applications, such as FANETs (Flying Ad hoc Networks), military applications, the monitoring of vehicles on highways, border surveillance, to name a few.
It is the author’s intention, based on the proposed model, to evaluate the impact of the level of synchronization on a sensor node, considering the delay in communication variable and the mobility variable when nodes are engaged in low-speed dislocations.


