1. Introduction
In many engineering areas, assessing the integrity and/or health of a structure is an important and timely topic. Several methods have been developed in the past decades for the relevant structural health monitoring (SHM), which aims to detect any possible damage and classify the conditions of structures. Methods can be distinguished into model-driven [
1,
2,
3,
4], see also Farrar and Worden [
5], or data-driven ones. The model-driven SHM approach is based on an analytical or finite element model of the structure [
6]. Although this approach can successfully detect damage, some limitations are represented by the necessity of a detailed model, of a model updating procedure and of data reduction from raw vibration measurements. The data-driven SHM approach is instead based on monitoring features that must be sensitive to damage, and then on discriminating the normal or undamaged structural state condition from the damaged one by analyzing the features [
5,
7,
8,
9]. To pursue this aim, SHM consists in statistical pattern recognition methodologies arranged into four steps: (1) operational evaluation, (2) data acquisition, (3) feature extraction, and (4) statistical decision making for the classification of features [
5].
Feature extraction is an important step in the methods of statistical pattern recognition, since methods may fail to provide an accurate decision using unreliable features. Series modeling is an applicable tool to extract damage-sensitive features from raw vibration data. In this regard, in [
10] coefficients of autoregressive (AR) models were extracted as damage-sensitive features, whereas in [
11] the residuals of AR models were employed to quantify the differences between the prediction from the AR model and the actual measurements. A different approach to extract the damage-sensitive features is via principal component analysis (PCA). In [
12], PCA was introduced to extract the features used for sub-surface defect detection, and in [
13] PCA and independent component analysis (ICA) were compared for selecting the features from the measured data.
Statistical decision making refers to the application of statistical methods for the classification of the extracted features. This step is related to the implementation of machine learning algorithms, to classify the structural state conditions and identify possible damage states [
5,
14,
15,
16]. The simple idea of machine learning relies on identifying a relationship between some features derived from the measured data in the undamaged or damaged conditions, as a training data set. In machine learning and statistics, classification is a problem of identifying the class label of a set of observations on the basis of a training set. The classification problem is considered as an instance of supervised learning that trains a classifier using the data set including the features related to both the undamaged and damaged conditions. In [
17] a damage classification approach was presented for structures under varying operational and environmental conditions, with a unique combination of time series analysis and artificial neural networks. In [
18], a comparative study of various classification algorithms was conducted for fault diagnosis, using different types of signals. The classification methods used were linear discriminant analysis, support vector machines, random forests and adaptive resonance theory-Kohonen neural network. In [
19], the linear discriminant analysis method was adopted as a classifier for the damage detection in composite structures with the aid of a wavelet packet transform-based algorithm. A naïve Bayes classifier was used in [
20] and shown to be one of the most promising classification approaches for damage detection. Despite the studies on successful classification algorithms, there are some other techniques that can be used in the context of SHM: most of them require a simple strategy to become useful approaches in the detection of damage [
21,
22].
The main objective of this work is to discuss some classification methods and compare their performances in the classification of different structural conditions. Linear discriminant analysis (LDA), quadratic discriminant analysis (QDA), naïve Bayes (NB) classification, and decision tree (DT) are here adopted to recognize the class label of the structural state. AR models and PCA are applied to extract the damage-sensitive features from the raw vibration data. To assess the performances of the classification methods, a numerical benchmark concrete beam is considered.
2. Method
In the proposed comparative assessment, the features are selected using AR or PCA models and the structural state conditions are accordingly classified. Most of the classification methods require training and test data sets including features related to the undamaged and damaged conditions, as well as class labels. The performance and prediction accuracy of each of these methods depend on the model and algorithm parameters: a comparative assessment is therefore necessary in real-life cases and is here provided. Assume that ϵ ℜv×n is the training set, that consists of -dimensional features in the undamaged and damaged conditions, where represents the number of sensors mounted on the structure; then, the training set has AR coefficients or principal components at each sensor location. Next, if z ϵ ℜvrepresents the vector containing the classification labels for each element in the training data set, the classification methods have to classify the test data through the information extracted from the training and class label sets.
2.1. Feature Selection
Assuming that a linear time-invariant representation can fit the structural response, an AR model for a single-output system reads [
23]:
where
y(
t) is the measured response at time
t;
θ = [
θ1,
θ2,…,
θa] is the vector of AR coefficients;
is the model order;
e(
t) is an uncorrelated residual sequence used to quantify the difference between the measured and predicted responses.
PCA is a statistical procedure that is used to convert a set of observations of possibly correlated variables into a set of linearly uncorrelated variables, named principal components. In the context of SHM, PCA can be used to reduce the dimension of high-dimensional data [
24], extract damage-sensitive features [
13], or discriminate between normal and abnormal conditions of a structure [
25]. Hence, PCA linearly transforms matrix
into a low-dimensional matrix
T ϵ ℜ
v×k using an additional matrix
P ϵ ℜ
n×k in the following form:
To apply PCA, it is necessary to standardize the original matrix on the basis of mean values and standard deviations of all features for each single sensor. This also helps remove the differences in the ranges of the variables, and provides the same importance to each of them in the statistical analysis.
2.2. Classification Methods
When two or more clusters of data are known
a priori and new observations have to be classified based on the measured characteristics, discriminant analysis can be adopted. LDA is a classification method [
26], that can be used to find a linear combination of features to characterize or separate the classes of groups. In order to perform the classification, a training data set must be defined and the class with the smallest misclassification cost is then predicted [
27]. It is assumed that in the
-th class
, the probability density function of
x from the training set
, with mean
μk and covariance
Σk, is given by:
The aim is to classify the group for which the probability is largest for a randomly selected observation. To use Equation (3) as a classifier, one needs to estimate the class priors, and the means and covariance matrix from the training data set. In the case of LDA, Gaussians for each class are assumed to share the same covariance matrix
Σk =
Σ, and the classification rule is based on a linear score function that is given by:
where
pk is the probability that a randomly selected observation falls in the
-th class.
QDA still assumes that the features are normally distributed, but the covariance of each class is no more identical to all the others [
28]. Overall, with LDA it is assumed that the trained model has the same covariance matrix for each class and only the mean values vary, whereas with QDA both the mean and covariance of each class both vary. QDA classifies a sample set into the cluster that has the largest score function, defined as:
The unknown values of
μk,
Σk, and
pk are again obtained from the training data set.
NB is a classification method that is intended to classify the feature values on the basis of the Bayes theorem: it assumes that the values of a particular feature are conditionally independent, given the class. The method then computes the posterior probability of the features belonging to each class, for any test data: hence, NB classifies the test data set based on the largest posterior probability. To perform classification, the algorithm builds the posterior probability model on the basis of Bayes rule, according to:
The algorithm classifies an observation by allocating it to the class yielding the maximum posterior probability.
DT is a further classification method that applies a decision tree as a predictive model for the process of classification. A decision tree is a decision support tool that employs a tree-like graph as a model of decisions. The goal of this approach is to predict the class of new data by learning simple decision rules, inferred from the data features. If the target variable can take a finite set of values, models are called classification trees. The classification decision tree splits so-called nodes based on either impurity or node error: a common method dealing with impurity is the Gini’s diversity index or the maximum deviance reduction, which is also known as cross entropy [
29]. Given the training data set
and the label vector
z, DT recursively partitions the space such that the samples with the same labels are grouped together. In order to train the classifier, it becomes essential to specify the number of branch nodes (decision splits), the minimum number of branch and leaf node observations, and the prior probabilities for each class. A full discussion of the classification decision tree is beyond of the scope of this article, and readers are referred to [
30] for further details.
3. Results and Discussion
To verify the performance and capability of the presented methods, the numerical benchmark model discussed in [
31] is considered, see
Figure 1. The model is a simply supported beam with length 5 m, height 0.5 m, and width 0.01 m. 15 sensors are assumed to be installed at the top surface of the beam, to provide acceleration time histories in the vertical direction: for each location, the measurement period is assumed to last two seconds, and the measurements thus consist of 4001 data points. A single vertical crack is considered at mid-span, close to the location of sensor #8.
Table 1 also shows the damage cases allowed for, at varying damage severity or crack length.
Out of all the digital pseudo-experimental data, two acceleration responses in the undamaged and damaged cases are chosen for feature extraction with both the considered approaches. Therefore, the acceleration measurements in this study consist of a matrix with 8002 data points, 15 sensors and 7 cases.
Feature selection is used to extract the parameters of the AR model and the components of PCA, using the acceleration data by considering 80% of data (i.e., 3201 data points) for training, 10% of data for validation and the remaining 10% for testing, to assess and ensure the accuracy of modelling and extracted features. In this study, Bayesian information criterion is adopted to set the order of the AR model to , and the least-squares technique is used to estimate the coefficients vector θ of the AR model.
To adopt the components of PCA as damage-sensitive features, a standardization process has been enforced for the acceleration histories, so as to have data with zero mean and unit variance. To achieve accuracy for the classification task, seven class labels are defined in accordance with the cases gathered in
Table 1: hence, in order to classify the structural state, the features obtained with the AR and PCA models in the damaged scenarios 2–7 have been adopted as test data sets.
The process of classification based on LDA, QDA, NB and DT is carried out using the training and test data sets. To summarize the obtained results, it turns out that LDA is not capable of classifying the different damage patterns; in contrast, QDA and NB provide excellent classification results using the AR coefficients as damage-sensitive features. If the PCs are instead used as damage-sensitive features, all the classification methods with the exception of NB fail in giving a reliable output. Results of NB thus demonstrate that this method is the only reliable and capable tool for classification.
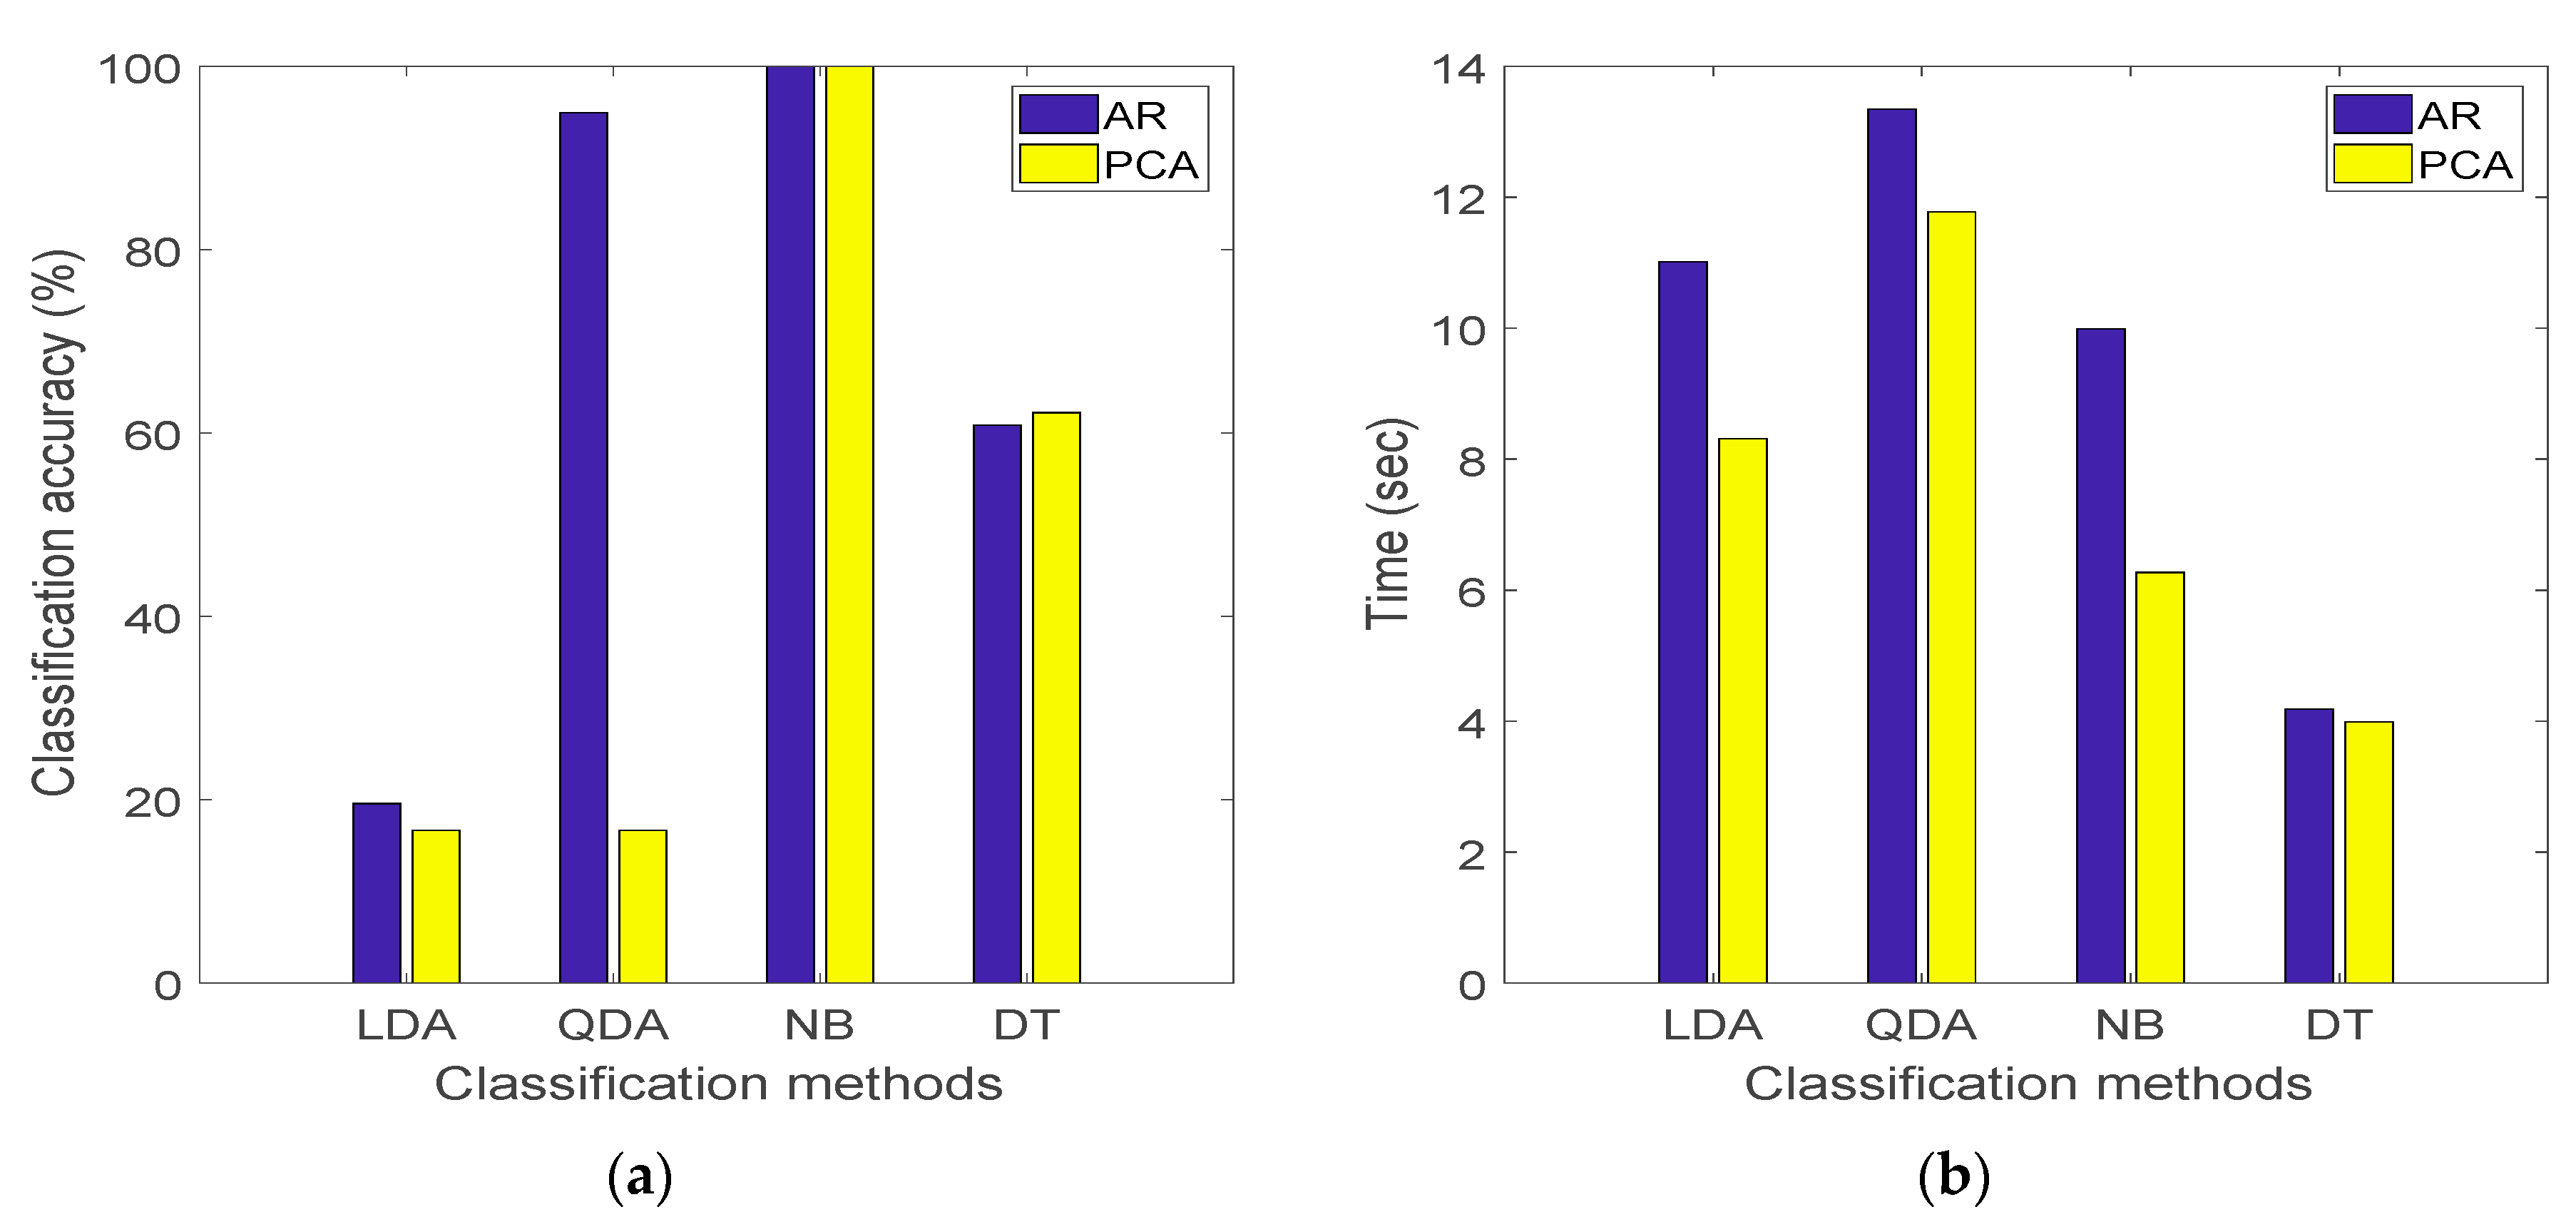
In order to compare in some details the results of classification using the AR and PCA models,
Figure 2a displays the accuracy of the classification methods on the basis of the classification error estimated from the loss function [
32], and
Figure 2b shows instead the corresponding computing time. The loss function gives a scalar value representing how well the trained model (classifier) classifies the test data. It is shown that NB, independently of the adopted feature selection algorithm, has the highest accuracy and a remarkable computational efficiency; LDA, though rather efficient, cannot provide reliable classification results, with an accuracy never exceeding 20%; DT turns out to be a moderate classification method in terms of accuracy and the best approach with respect to computing time, handling either the AR and PCA features. Using QDA, the results of classification on the basis of AR coefficients are rather good, whereas those based on the PCs are not and feature an accuracy smaller than 20%; furthermore, this method results to be computationally inefficient.
4. Conclusions
In this paper, a comparison has been provided of the performances of some efficient methods to classify the structural conditions of a cracked concrete beam using the two well-known feature selection techniques: AR time series modeling, and PCA. For the process of classification, the coefficients of the AR model and the principal components of the PCA model have been exploited as damage-sensitive features.
The results showed that LDA is not a reliable classification method in the context of SHM, resulting in a low accuracy of classification and relatively high computational costs for both of the feature selection techniques. By contrast, NB provides classifications with the highest accuracy coupled with a computational efficiency. DT is not able to classify the structural conditions as good as NB, yet it outperforms LDA; this method is anyway better than LDA and NB in terms of computational costs. The results of QDA are affected by the feature selection technique, but it can be concluded that this method has a good classification accuracy, though it is associated with the highest computing time.
The main limitation of the considered classification methods is represented by being supervised learning algorithms. The supervised format requires data from the damaged states to be always available, and this represents a practical challenge to the applicability of the classification methods to real-life structures.
Author Contributions
All authors, who are stated in the manuscript, certify that they have sufficiently contributed to prepare this research study. This contribution includes A.E.: Conceptualization, Ideas, formulation, and Implementation of research aims and goals, Writing-Original draft preparation. H.S.: Visualization and Formal analysis. S.M.: Supervision, Investigation, Writing-Reviewing, and Editing. All authors have read and agreed to the published version of the manuscript.
Funding
This research received no external funding.
Acknowledgments
The authors are indebted to Kullaa for providing the data relevant to the benchmark concrete beam.
Conflicts of Interest
The authors declare no conflict of interest.
References
- Capellari, G.; Eftekhar Azam, S.; Mariani, S. Damage detection in flexible plates through reduced-order modeling and hybrid particle-Kalman filtering. Sensors 2016, 16, 2. [Google Scholar] [CrossRef] [PubMed]
- Eftekhar Azam, S.; Mariani, S.; Attari, N. Online damage detection via a synergy of proper orthogonal decomposition and recursive Bayesian filters. Nonlinear Dyn. 2017, 89, 1489–1511. [Google Scholar] [CrossRef]
- Eftekhar Azam, S.; Mariani, S. Online damage detection in structural systems via dynamic inverse analysis: A recursive Bayesian approach. Eng. Struct. 2018, 159, 28–45. [Google Scholar] [CrossRef]
- Sarmadi, H.; Karamodin, A.; Entezami, A. A new iterative model updating technique based on least squares minimal residual method using measured modal data. Appl. Math. Model. 2016, 40, 10323–10341. [Google Scholar] [CrossRef]
- Farrar, C.R.; Worden, K. Structural Health Monitoring: A Machine Learning Perspective; John Wiley & Sons Ltd.: Hoboken, NJ, USA, 2013. [Google Scholar]
- Entezami, A.; Shariatmadar, H.; Sarmadi, H. Structural damage detection by a new iterative regularization method and an improved sensitivity function. J. Sound Vib. 2017, 399, 285–307. [Google Scholar] [CrossRef]
- Entezami, A.; Shariatmadar, H. An unsupervised learning approach by novel damage indices in structural health monitoring for damage localization and quantification. Struct. Health Monit. 2017, 17, 325–345. [Google Scholar] [CrossRef]
- Entezami, A.; Shariatmadar, H. Structural health monitoring by a new hybrid feature extraction and dynamic time warping methods under ambient vibration and non-stationary signals. Measurement 2019, 134, 548–568. [Google Scholar] [CrossRef]
- Entezami, A.; Shariatmadar, H. Damage localization under ambient excitations and non-stationary vibration signals by a new hybrid algorithm for feature extraction and multivariate distance correlation methods. Struct. Health Monit. 2019, 18, 347–375. [Google Scholar] [CrossRef]
- Sohn, H.; Czarnecki, J.A.; Farrar, C.R. Structural Health Monitoring Using Statistical Process Control. J. Struct. Eng. 2000, 126, 1356–1363. [Google Scholar] [CrossRef]
- Fugate, M.L.; Sohn, H.; Farrar, C.R. Vibration-based damage detection using statistical process control. Mech. Syst. Signal Process. 2001, 15, 707–721. [Google Scholar] [CrossRef]
- Sophian, A.; Tian, G.Y.; Taylor, D.; Rudlin, J. A feature extraction technique based on principal component analysis for pulsed Eddy current NDT. NDT Int. 2003, 36, 37–41. [Google Scholar] [CrossRef]
- Zhong, A.; Song, H.; Han, B. Extracting structural damage features: Comparison between PCA and ICA. In Intelligent Computing in Signal Processing and Pattern Recognition, Lectures Notes in Control and Informatic; Springer: Berlin/Heidelberg, Germany, 2006; Volume 345, pp. 840–845. [Google Scholar] [CrossRef]
- Entezami, A.; Shariatmadar, H.; Karamodin, A. Data-driven damage diagnosis under environmental and operational variability by novel statistical pattern recognition methods. Struct. Health Monit. 2018. [Google Scholar] [CrossRef]
- Rezaiee-Pajand, M.; Entezami, A.; Shariatmadar, H. An iterative order determination method for time-series modeling in structural health monitoring. Adv. Struct. Eng. 2017, 21, 300–314. [Google Scholar] [CrossRef]
- Entezami, A.; Shariatmadar, H.; Karamodin, A. An improvement on feature extraction via time series modeling for structural health monitoring based on unsupervised learning methods. Sci. Iran 2018. [Google Scholar] [CrossRef]
- Sohn, H.; Worden, K.; Farrar, C.R. Statistical damage classification under changing environmental and operational conditions. J. Intell. Mater. Syst. Struct. 2002, 13, 561–574. [Google Scholar] [CrossRef]
- Niu, G.; Son, J.-D.; Widodo, A.; Yang, B.-S.; Hwang, D.-H.; Kang, D.-S. A comparison of classifier performance for fault diagnosis of induction motor using multi-type signals. Struct. Health Monit. 2007, 6, 215–229. [Google Scholar] [CrossRef]
- Gaudenzi, P.; Nardi, D.; Chiappetta, I.; Atek, S.; Lampani, L.; Pasquali, M.; Sarasini, F.; Tirilló, J.; Valente, T. Sparse sensing detection of impact-induced delaminations in composite laminates. Compos. Struct. 2015, 133, 1209–1219. [Google Scholar] [CrossRef]
- Addin, O.; Sapuan, S.; Mahdi, E.; Othman, M. A Naïve-Bayes classifier for damage detection in engineering materials. Mater. Des. 2007, 28, 2379–2386. [Google Scholar] [CrossRef]
- Entezami, A.; Shariatmadar, H.; Mariani, S. Fast unsupervised learning methods for structural health monitoring with large vibration data from dense sensor networks. Struct. Health Monit. 2019. [Google Scholar] [CrossRef]
- Entezami, A.; Shariatmadar, H.; Mariani, S. A novelty detection method for large-scale structures under varying environmental conditions. In Proceedings of the Sixteenth International Conference on Civil, Structural and Environmental Engineering Computing (Civil-Comp 2019), Riva del Garda, Italy, 16–19 September 2019. [Google Scholar]
- Box, G.E.; Jenkins, G.M.; Reinsel, G.C. Time Series Analysis: Forecasting and Control, 4th ed.; John Wiley & Sons, Inc.: Hoboken, NJ, USA, 2008. [Google Scholar]
- Mujica, L.E.; Vehí, J.; Ruiz, M.; Verleysen, M.; Staszewski, W.; Worden, K. Multivariate statistics process control for dimensionality reduction in structural assessment. Mech. Syst. Signal Process. 2008, 22, 155–171. [Google Scholar] [CrossRef]
- Tibaduiza, D.A.; Mujica, L.E.; Rodellar, J.; Güemes, A. Structural damage detection using principal component analysis and damage indices. J. Intell. Mater. Syst. Struct. 2015. [Google Scholar] [CrossRef]
- Fisher, R.A. The use of multiple measurements in taxonomic problems. Ann. Eugen. 1936, 7, 179–188. [Google Scholar] [CrossRef]
- McLachlan, G.J. Discriminant Analysis and Statistical Pattern Recognition; Wiley: Hoboken, NJ, USA, 2004. [Google Scholar]
- Alpaydin, E. Introduction to Machine Learning; MIT Press: Cambridge, MA, USA, 2014. [Google Scholar]
- Coppersmith, D.; Hong, S.J.; Hosking, J.R. Partitioning nominal attributes in decision trees. Data Min. Knowl. Discov. 1999, 3, 197–217. [Google Scholar] [CrossRef]
- Breiman, L.; Friedman, J.; Stone, C.J.; Olshen, R.A. Classification and Regression Trees; CRC Press: Boca Raton, FL, USA, 1984. [Google Scholar]
- Kullaa, J.; Santaoja, K.; Eymery, A. Vibration-based structural health monitoring of a simulated beam with a breathing crack. Key Eng. Mater. 2013, 569, 1093–1100. [Google Scholar] [CrossRef]
- Yuan, G.-X.; Ho, C.-H.; Lin, C.-J. Recent advances of large-scale linear classification. Proc. IEEE 2012, 100, 2584–2603. [Google Scholar] [CrossRef]
| Publisher’s Note: MDPI stays neutral with regard to jurisdictional claims in published maps and institutional affiliations. |
© 2019 by the authors. Licensee MDPI, Basel, Switzerland. This article is an open access article distributed under the terms and conditions of the Creative Commons Attribution (CC BY) license (https://creativecommons.org/licenses/by/4.0/).


