Proceeding Paper

Acoustic Conditions Analysis of a Multi-Sensor Network for the Adaptation of the Anomalous Noise Event Detector †

GTM—Grup de recerca en Tecnologies Mèdia, La Sall, Universitat Ramon Llull, C/Quatre Camins, 30, 08022 Barcelona, Spain
*
Author to whom correspondence should be addressed.
Presented at the 5th International Electronic Conference on Sensors and Applications, 15–30 November 2018; Available online: https://ecsa-5.sciforum.net.
Proceedings 2019, 4(1), 51; https://doi.org/10.3390/ecsa-5-05738
Published: 15 February 2019
(This article belongs to the Proceedings of 5th International Electronic Conference on Sensors and Applications)

Abstract

:
The DYNAMAP project is aimed at implementing a dynamic noise mapping system able to determine the acoustic impact of road infrastructures in real time. It was established as a result of the European Noise Directive 2002/49/EC. A Wireless Acoustic Sensor Network (WASN) is used to collect the measurements in two pilot areas: in the city of Milan (urban) and on the A90 motorway around Rome (suburban). For a proper evaluation of the noise level of the road infrastructures, the anomalous noise events (ANE) unrelated to traffic noise (e.g., sirens, horns, speech, doors, etc.) should be removed before updating the noise maps. For this purpose, an anomalous noise events detector (ANED) was initially designed and trained using data from a real-life recording campaign. In this work, we continue adapting the ANED algorithm to conform to the requirements of the final 25-node hybrid WASN deployed in the suburban environment. Specifically, the study focuses on the analysis of the spectro-temporal characteristics of the acoustic data in real-operation conditions and their differences between the 19 high-capacity nodes in the Rome pilot area in order to adapt the ANED to run on the entire WASN appropriately.

1. Introduction

The number of people living in urban and suburban areas is increasing year after year [1]. As a consequence, the quality of life of citizens is being negatively affected by the increase in Road Traffic Noise (RTN) levels [2], which has been identified as one of the main sources of health-related problems [3,4]. At the European level, the prevention and reduction of environmental noise is being addressed by competent authorities based on the European Noise Directive 2002/49/EC (END) [5], and the consequent strategic noise mapping assessment CNOSSOS-EU [6] has to be implemented by all European member states by the end of 2018. The different pillars of these regulations are: (i) determining noise exposure, (ii) informing the affected citizens, and (iii) preventing and reducing the environmental noise where necessary.
Moreover, the END requires the member states to tailor and publish noise maps together with the corresponding action plans every five years for large agglomerations (with +100,000 inhabitants) and other major infrastructures. This requirement has been (and is still being) mainly addressed by experts that collect representative acoustic data using certified sound level devices, which is subsequently fed into the corresponding noise tailoring software [7]. Nevertheless, the emergence of Wireless Acoustic Sensor Networks (WASNs) provides the possibility of monitoring environmental noise pervasively in urban and suburban environments [8,9].
Among these WASN-projects, the LIFE+ DYNAMAP project [10] is aimed at developing a dynamic noise mapping system able to detect and represent the acoustic impact of road infrastructures in real time. Two hybrid low-cost WASNs (including high-capacity and low-capacity nodes) have recently been deployed in the two pilot areas of the project [11,12]: the first one, within District 9 of the city of Milan, and the second one along the A90 motorway surrounding Rome, corresponding to an urban and a suburban environment, respectively. For a proper evaluation of the noise level of the road infrastructure, the anomalous noise events (ANE) unrelated to regular traffic noise (e.g., sirens, horns, speech, doors, music, etc.) should be automatically removed from the equivalent noise level computation to tailor reliable RTN maps. To that effect, an Anomalous Noise Event Detector (ANED) has been designed and implemented to run on the 19-node high-capacity low-cost acoustic sensors of the WASN [13,14].
After the original design of the ANED based on a synthetic audio database [15], the core algorithm was improved and trained with audio data from a recording campaign conducted across different representative locations of the pilot areas [13]. Specifically, Rome’s suburban acoustic environment was sampled through a subset of the 19 high-capacity sites of the A90 Rome motorway during short periods of time (e.g., 20–30 min) throughout the daytime [16]. Despite the collected audio coming from a real-life environment, it was impossible to take into account all of the factors that would affect the WASN during the real operation; i.e., working 24 hours/day, and during days of different traffic activity (e.g., weekdays and weekends). Furthermore, the measurements were performed using a tripod placed over the highway portal floors with an oblique orientation during the recording campaign [16], which differs from the final position of the low-cost sensors in the WASN.
In Reference [17], the first steps towards adapting the ANED to run in the final operational conditions of the WASN were presented, after deploying the low-cost high-capacity nodes in the Rome pilot. That work covered two main stages: the first was focused on the validation of the performance of the preliminary ANED version on the real-life operation data, and the second focused on the process followed to collect new data from the sensors of the deployed 19-node WASN. After the manual labelling of a representative subset of the recorded data, a significantly larger and richer dataset was obtained than the one obtained from the recording campaign (e.g., new ANE categories were included), the new one being composed of around 107 h of audio. The results in Reference [17] did not give suitable results in terms of accuracy, therefore, in this paper, we present the next step consisting of a subsequent analysis carried out on the 107 h of real-operation audio data. The final goal of this study is to analyze the spectro-temporal patterns of the noise received by each sensor in order to determine to what extent it is necessary to adapt the ANED to run on all the nodes of the WASN appropriately.
The rest of this paper is structured as follows. In Section 2, a detailed description of the operating conditions of the Rome pilot area is given. After that, in Section 3, a spectro-temporal analysis is conducted on the audio data obtained for each high-capacity node of the network. Finally, Section 4 presents the conclusions derived from this research.

2. Description of the Operating Conditions in the Rome Pilot

The WASN of the suburban area of the Rome ring road is comprised of 24 acoustic sensors, five of which are low-capacity sensors without enough computational resources to allocate to the ANED. The locations of the 19 high-capacity sensors of the WASN in the Rome suburban pilot area are shown in Figure 1; in red are those that were also used during the initial recording campaign. These are the locations where the recordings were conducted to provide the acoustic data used to re-train and validate the ANED performance in the final locations of the sensors.
The system must be robust and stable as it operates 24 hours a day 7 days a week. Thus, the ANED training must include, as far as possible, all kinds of real-life situations. This is a very challenging task, which is difficult to accomplish especially if the amount of available resources is limited, e.g., the processing and storage capabilities. Our approach to this problem was to plan one-day real-operation recordings of all WASN sensors, selecting a weekday and a weekend day to provide diverse traffic conditions i.e., Thursday the 2nd and Sunday the 5th of November, 2017. From each sensor, 20 min was recorded every hour. Figure 2 shows a schematic diagram of the recording days and the recording duration. Sixteen hours were taken into consideration for each location, having a diversity belonging to a workday and a weekend and a representation for each hour of the day. After the performed labelling, these data could be used to properly re-train the ANED and improve its accuracy.

3. Acoustic Spectral Analysis of the Nodes of the WASN

In this section, we analyze the spectral distributions for each sensor and for each hour using the available audio recordings. The analysis was performed using the Gammatone filterbank as a spectral representation because of its high coherence with mammal sensitivity. It was implemented following the approach of the Gammatone Cepstral Coefficients (GTCC) which was proposed in Reference [18]. Acoustic signal frames of 30 ms were selected using a Hamming window [19], and 48 subband energies were obtained between 20 Hz and 22 kHz. Using the 20 min audio file of a given sensor, a mean spectrum was computed, and the 24 mean spectra were compiled to define the spectrum-time profile of this sensor during the day.
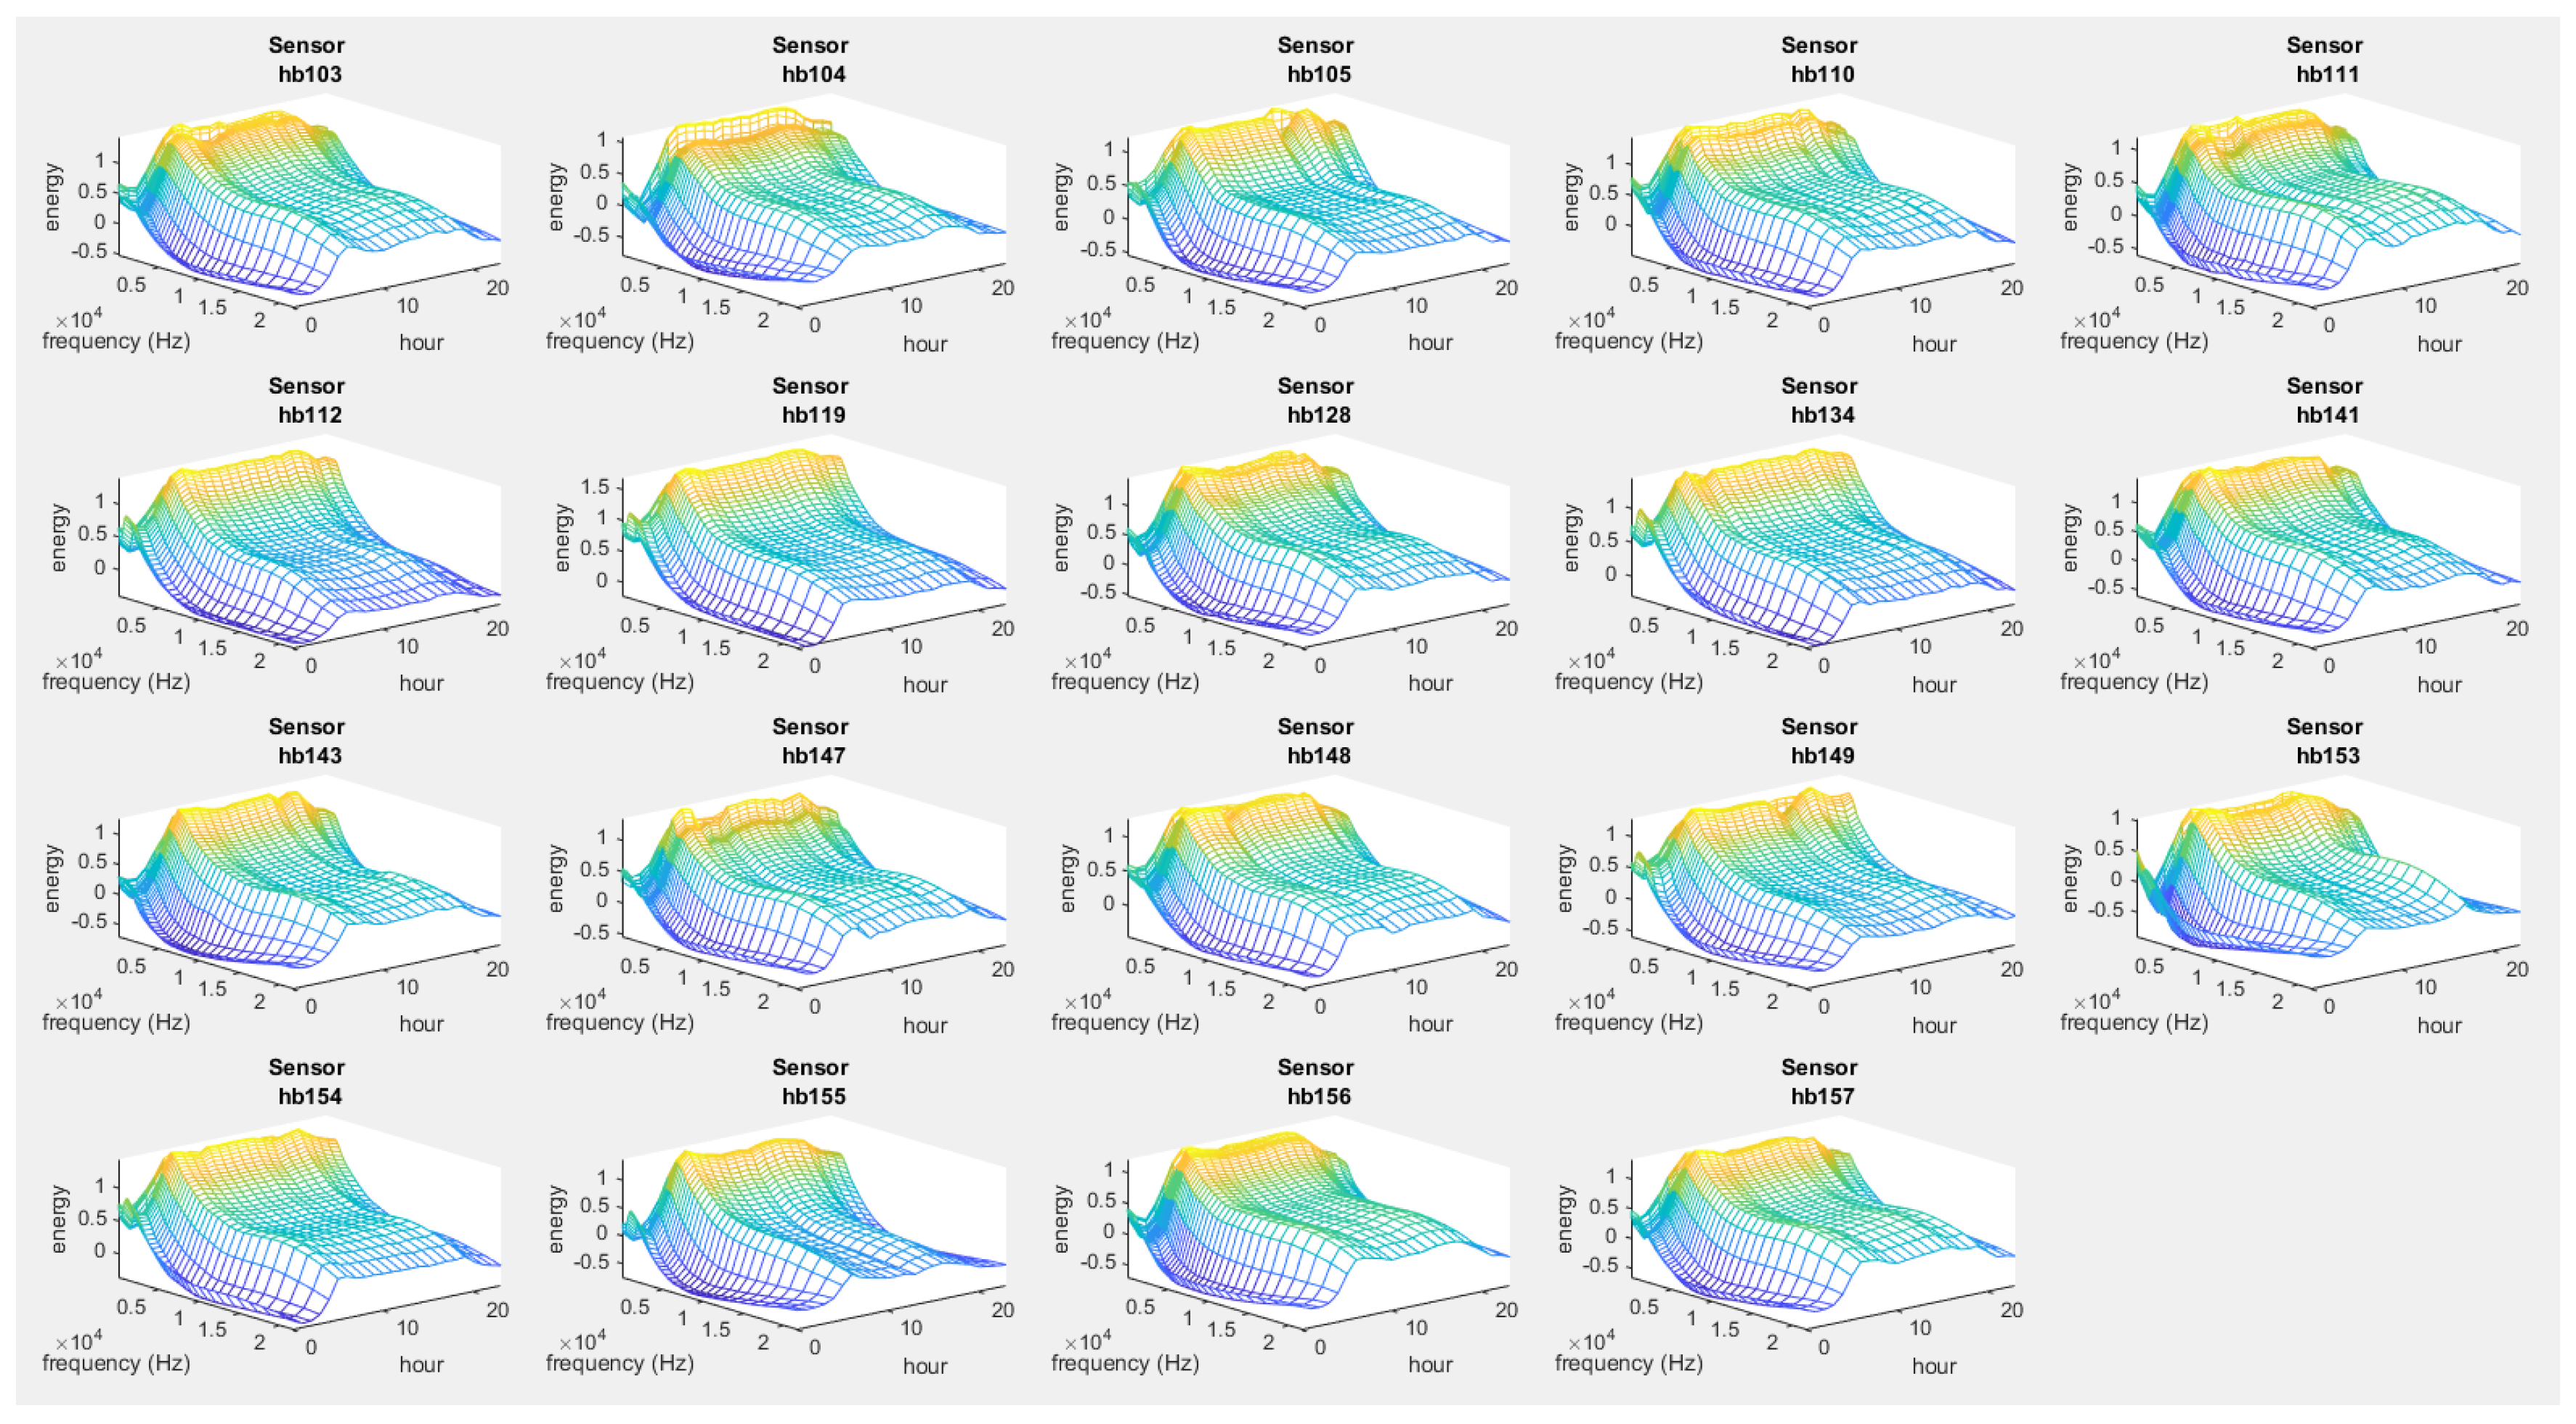
The spectrum-time profiles of the 19 sensors of the WASN for the weekday are shown in Figure 3. All sensor profiles follow a gross similar pattern, which can be basically attributed to road traffic noise (the major class): higher noise levels are obtained in the lower frequency band, and higher amplitudes are observed in the time region of higher traffic density (between 6:00 and 21:00). Nevertheless, it can be seen that there are some fine variations between sensor profiles, which informs about the diversity as regards traffic conditions and noise events in these specific locations.
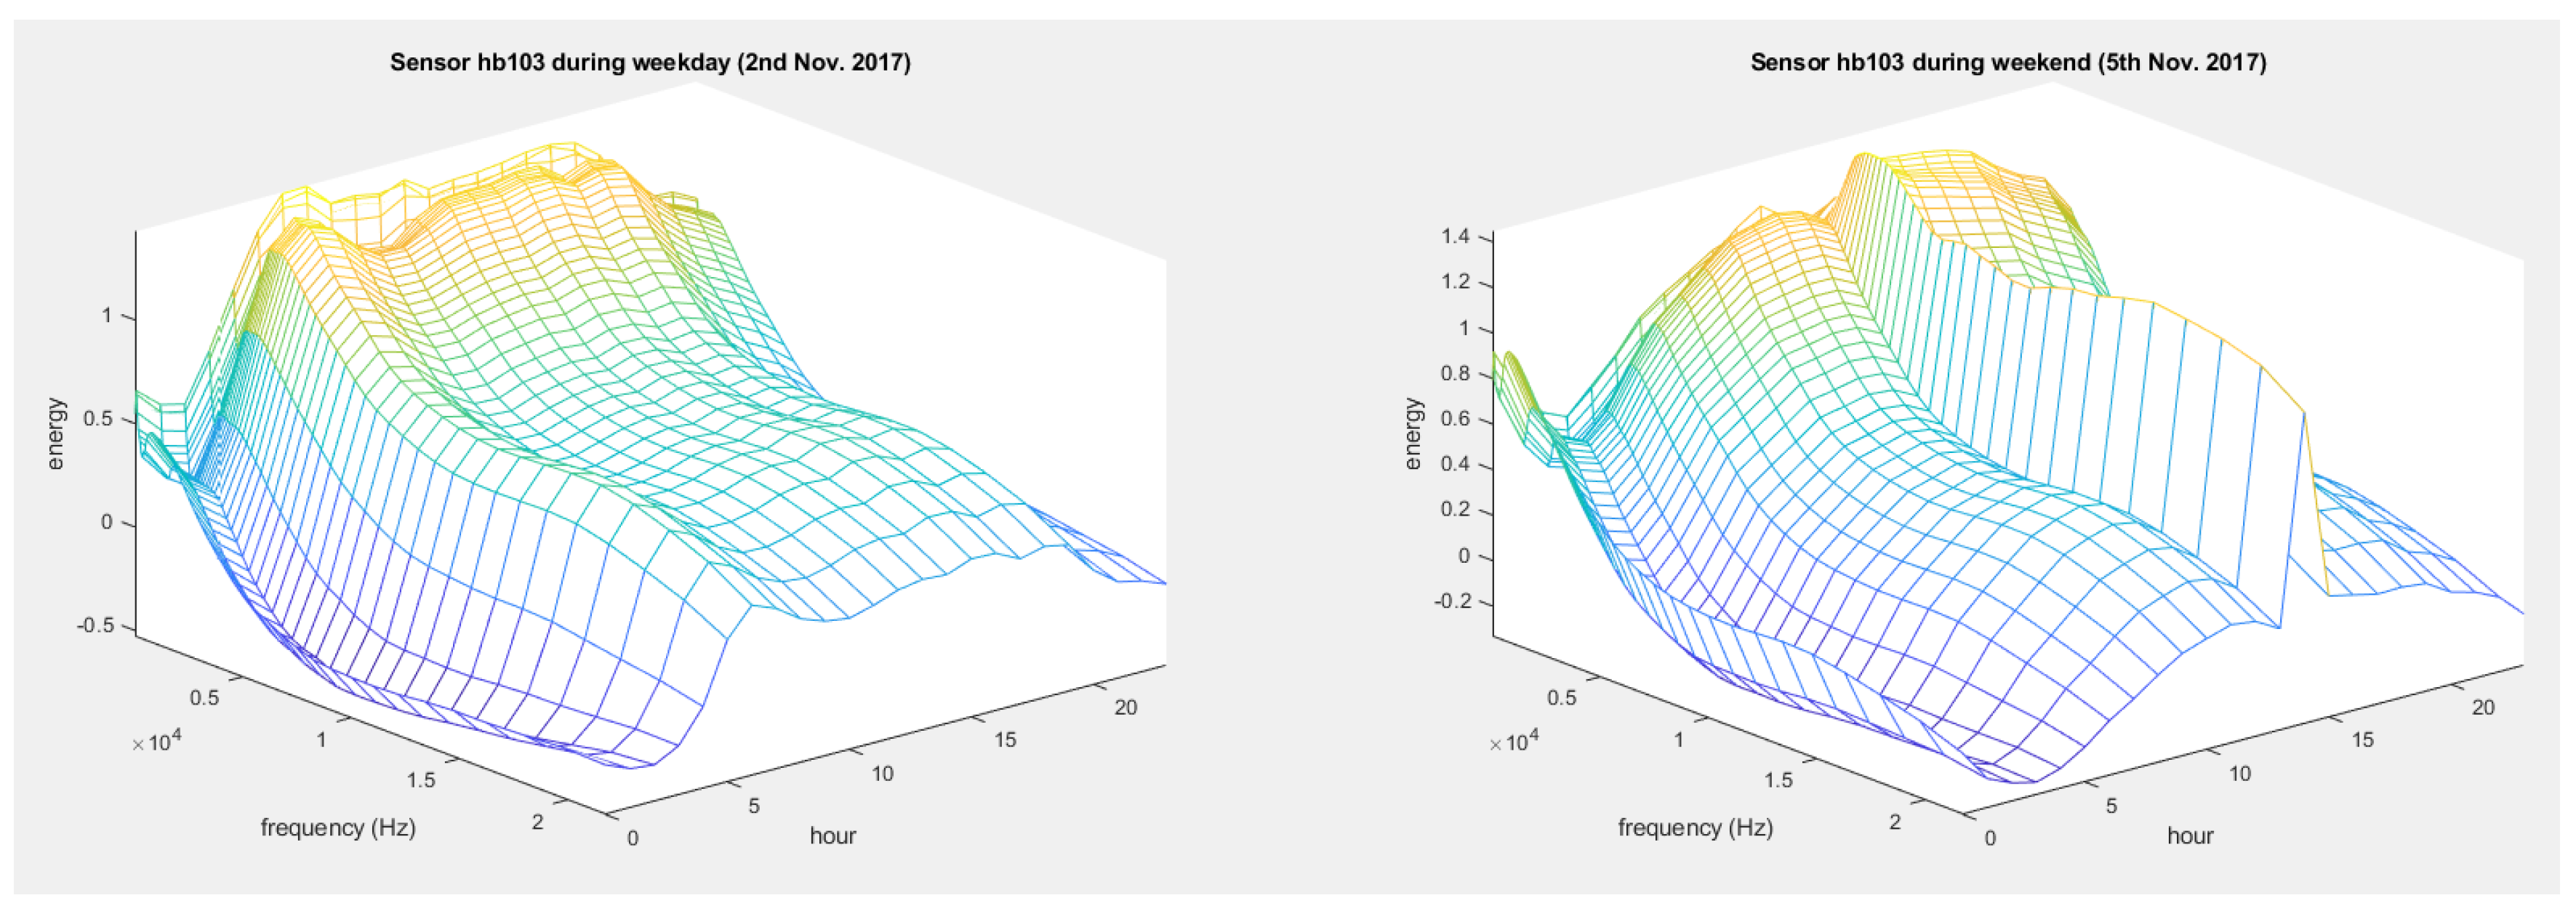
In Figure 4, the spectrum-time profiles are shown for a weekend day, where sensor hb119 was active only between 00:00 and 13:00 (the rest of the values in its profile have been fixed to 0). In this case, high energy values can be observed at 14:00, coinciding with the sound of rain. Furthermore, by comparing this figure with the previous (Figure 3), several similarities can be observed. Sensor hb112 and hb134 show low energy values at high frequencies in both Figures; the reader may observe that both are located very near to one another as shown in Figure 1. However, sensor hb119 is also located near to these two but its high frequencies present higher energy values on both dates. On the other hand, sensors hb103, hb111, hb143, hb156, and hb157 show high energies at high frequencies on both days and are all located in the south-west part of the Rome ring road. In the northern part of the ring road, we have sensors hb104, hb141, and hb153, however, the energy profiles are only similar for hb104 and hb141. In the eastern part of the ring road, hb112 and hb119 are also located near to one another, and both present a similar spectrum-time pattern, the hb119 sensor having a higher energy overall. As can be seen, most sensors located near to each other present a similar energy profile or pattern, however, a more detailed analysis should be conducted to better characterize and quantify the differences between the spectrum-time profiles. In Figure 5, the spectrum-time profiles of one sensor (hb103) are shown for the two analyzed days in order to better explore the inter-week differences. As can be observed, the mean monitored road-traffic noise in a certain location presents significant differences when a weekday is compared with a weekend day, e.g., the initiation time of traffic noise in the morning and its drop off in the evening show a softer behavior during the weekend.
In order to better explore all the available data, more analyses should be conducted to conclude to what extent the differences of the observed spectral-time profiles are connected, e.g., performing clustering of sensors to train the ANED differently for each group.

4. Conclusions

In this study, the various recording locations had different acoustic profiles, having an effect on the sound levels as well as the ANED performance. For this reason, it is of great importance to study the acoustic conditions of the sensors which make up the sensor network. In this paper, the acoustic profiles of the high-capacity nodes from the Rome WASN are described in detail, in order to explore the differences among them. In addition, the difference between two different days are analyzed. A weekday and a weekend day were selected, data from 20 min for every hour of these days was analyzed. The last phase of the DYNAMAP project involves the authors conducting fine tuning of the acoustic sensors to improve the individual performance of each node in the network. This study is focused on analyzing the acoustic profile of the nodes in an attempt to acsertain the sensor network uniformity and to use this information in the next stage of training of the anomalous noise event detector. Future lines of investigation will include measuring the acoustic differences of each sensor and comparing these metrics with the event detection accuracy.

Author Contributions

J.C.S. conducted the experiments of spectral analysis and wrote a part of the paper. R.M.A.-P. also helped to design the experiments and wrote another part of the paper. F.A. and F.O. analyzed the results of the spectral distribution computations and wrote parts of the paper.

Funding

Ferran Orga thanks the support of the European Social Fund and the Secretaria d’Universitats i Recerca del Departament d’Economia i Coneixement of the Catalan Government for the pre-doctoral FI grant No. 2018FI_B1_00175.

Acknowledgments

The research presented in this work has been partially supported by the LIFE DYNAMAP project (LIFE13 ENV/IT/001254). Francesc Alías acknowledges the support from the Obra Social “La Caixa” under grant ref. 2018-URL-IR1rQ-021.

Conflicts of Interest

The authors declare no conflict of interest.

References

  1. Organization, W.H.; The Joint Research Centre of the European Commission. Burden of Disease from Environmental Noise: Quantification of Healthy Life Years Lost in Europe; Technical Report; World Health Organization Regional Office for Europe: Copenhagen, Denmark, 2011. [Google Scholar]
  2. Botteldooren, D.; Dekoninck, L.; Gillis, D. The influence of traffic noise on appreciation of the living quality of a neighborhood. Int. J. Environ. Res. Public Health 2011, 8, 777–798. [Google Scholar] [CrossRef] [PubMed]
  3. Babisch, W. Transportation noise and cardiovascular risk. Noise Health 2008, 10, 27–33. [Google Scholar] [CrossRef] [PubMed]
  4. Stansfeld, S.A.; Matheson, M.P. Noise pollution: non-auditory effects on health. Br. Med. Bull. 2003, 68, 243–257. [Google Scholar] [CrossRef] [PubMed]
  5. EU. Directive 2002/49/EC of the European Parliament and the Council of 25 June 2002 relating to the assessment and management of environmental noise. Off. J. Eur. Communities 2002, L189, 12–25. [Google Scholar]
  6. Kephalopoulos, S.; Paviotti, M.; Anfosso-Lédée, F. Common Noise Assessment Methods in Europe (CNOSSOS-EU). Publ. Off. Eur. Union 2002, Report EUR 25379 EN, 1–180. [Google Scholar]
  7. Cerniglia, A. Development of a GIS based software for real time noise maps update. In INTER-NOISE and NOISE-CON Congress; Institute of Noise Control Engineering: Reston, VA, USA, 2016; Volume 253, pp. 6291–6297. [Google Scholar]
  8. Santini, S.; Ostermaier, B.; Vitaletti, A. First experiences using wireless sensor networks for noise pollution monitoring. In Proceedings of the Workshop on Real-World Wireless Sensor Networks, Glasgow, Scotland, 1 April 2008; ACM: New York, NY, USA, 2008; pp. 61–65. [Google Scholar]
  9. Gubbi, J.; Marusic, S.; Rao, A.S.; Law, Y.W.; Palaniswami, M. A pilot study of urban noise monitoring architecture using wireless sensor networks. In Proceedings of the 2013 International Conference on Advances in Computing, Communications and Informatics (ICACCI), Greater Noida, Indiam, 24–27 September 2013; pp. 1047–1052. [Google Scholar]
  10. Sevillano, X.; Socoró, J.C.; Alías, F.; Bellucci, P.; Peruzzi, L.; Radaelli, S.; Coppi, P.; Nencini, L.; Cerniglia, A.; et al. DYNAMAP—Development of low cost sensors networks for real time noise mapping. Noise Mapp. 2016, 3, 172–189. [Google Scholar] [CrossRef]
  11. Zambon, G.; Benocci, R.; Bisceglie, A. Development of optimized algorithms for the classification of networks of road stretches into homogeneous clusters in urban areas. In Proceedings of the 22nd International Congress on Sound and Vibration, Florence, Italy, 12–16 July 2015. [Google Scholar]
  12. Bellucci, P.; Peruzzi, L.; Zambon, G. LIFE DYNAMAP project: The case study of Rome. Appl. Acoust. 2017, 117, 193–206. [Google Scholar] [CrossRef]
  13. Socoró, J.C.; Alías, F.; Alsina-Pagès, R.M. An Anomalous Noise Events Detector for Dynamic Road Traffic Noise Mapping in Real-Life Urban and Suburban Environments. Sensors 2017, 17, 2323. [Google Scholar] [CrossRef] [PubMed]
  14. Alías, F.; Alsina-Pagčs, R.M.; Orga, F.; Socoró, J.C. Detection of Anomalous Noise Events for Real-Time Road-Traffic Noise Mapping: The Dynamap’s project case study. Noise Mapp. 2018, 5, 71–85. [Google Scholar] [CrossRef]
  15. Socoró, J.C.; Ribera, G.; Sevillano, X.; Alías, F. Development of an Anomalous Noise Event Detection Algorithm for dynamic road traffic noise mapping. In Proceedings of the 22nd International Congress on Sound and Vibration (ICSV22), Florence, Italy, 12–16 July 2015; The International Institute of Acoustics and Vibration: Florence, Italy, 2015; pp. 1–8. [Google Scholar]
  16. Alías, F.; Socoró, J.C. Description of anomalous noise events for reliable dynamic traffic noise mapping in real-life urban and suburban soundscapes. Appl. Sci. 2017, 7, 146. [Google Scholar] [CrossRef]
  17. Socoró, J.C.; Alsina-Pagès, R.M.; Alías, F.; Orga, F. Adapting an Anomalous Noise Events Detector for Real-Life Operation in the Rome Suburban Pilot Area of the DYNAMAP’s Project. In Proceedings of the EuroNoise 2018, Crete, Greece, 27–31 May 2018; EAA—HELINA: Crete, Greece, 2018; pp. 693–698. [Google Scholar]
  18. Valero, X.; Alías, F. Gammatone Cepstral Coefficients: Biologically Inspired Features for Non-Speech Audio Classification. IEEE Trans. Multimedia 2012, 14, 1684–1689. [Google Scholar] [CrossRef]
  19. Blackman, R.B.; Tukey, J.W. Particular pairs of windows. In The Measurement of Power Spectra, from the Point of View of Communications Engineering; Dover Press: Dover, NJ. USA, 1959; pp. 95–101. [Google Scholar]
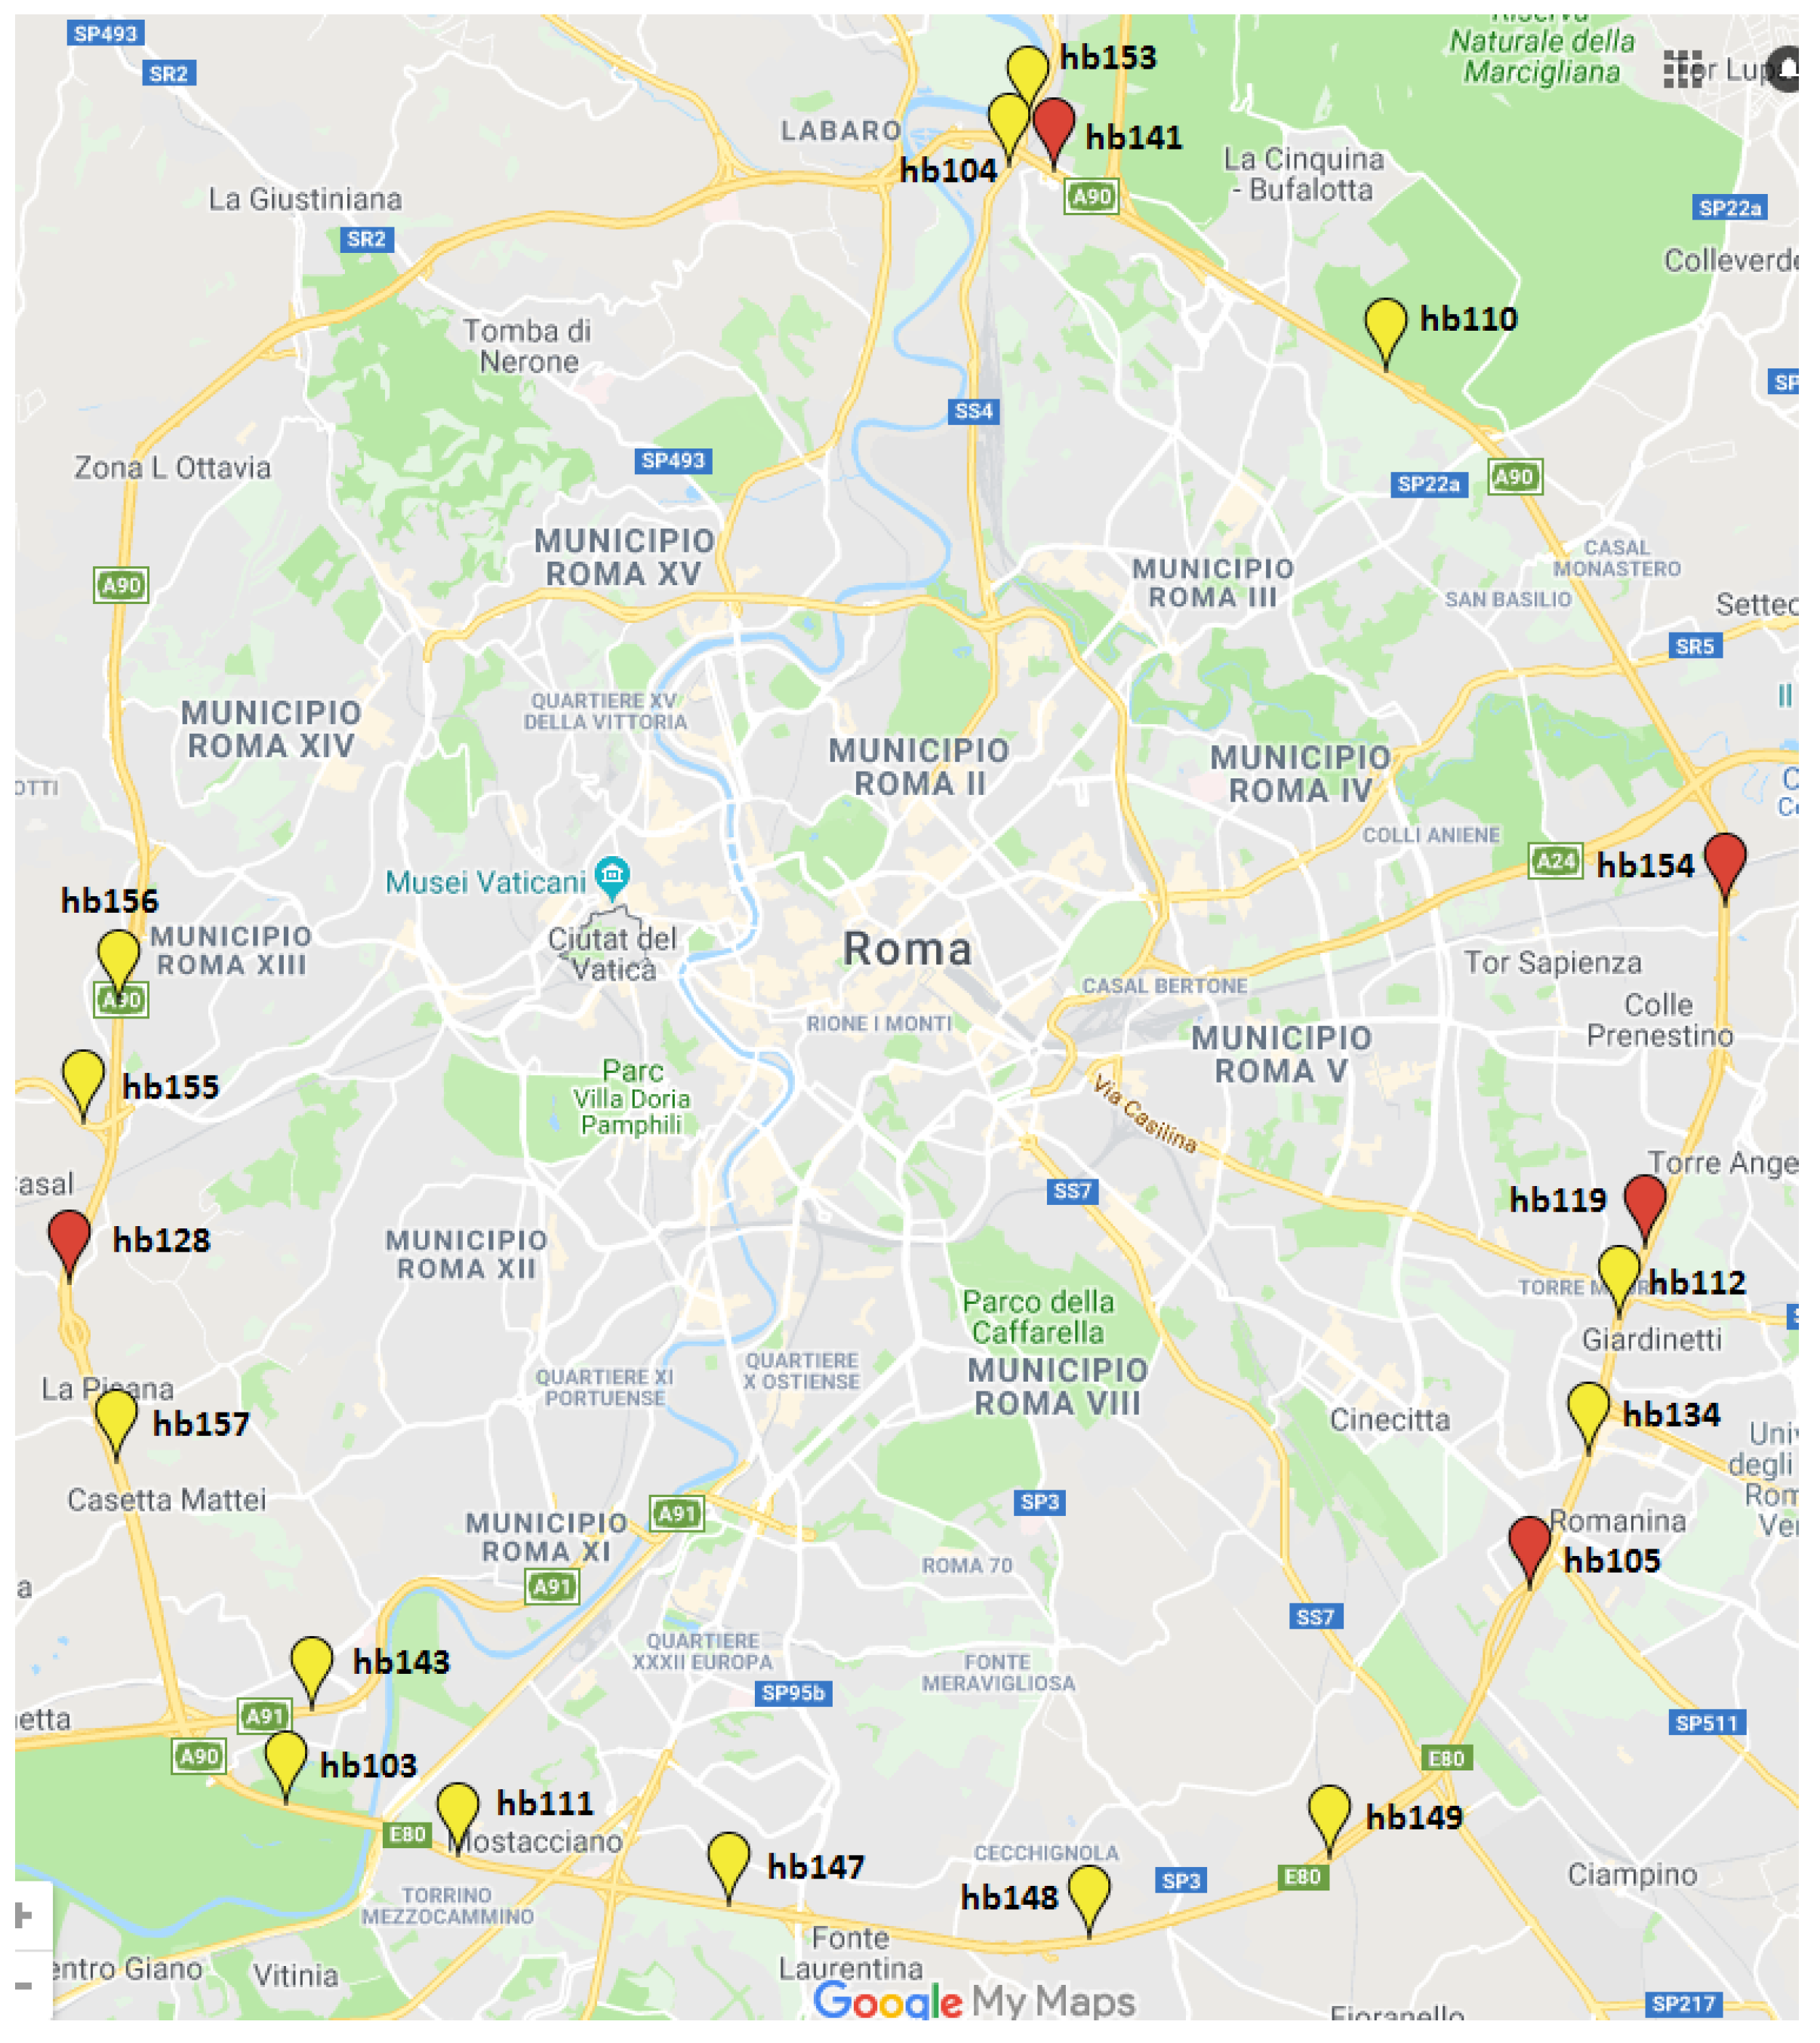
Figure 1. Map with sensor location information within the Wireless Acoustic Sensor Network (WASN) of DYNAMAP project.
Proceedings 04 00051 g001
Figure 2. Diagram of the recording days and duration for each sensor.
Proceedings 04 00051 g002
Figure 3. Spectrum-time profiles of the 19 sensors of the WASN on a weekday (2 November 2017).
Proceedings 04 00051 g003
Figure 4. Spectrum-time profiles of the 19 sensors of the WASN during the weekend (5 November 2017).
Proceedings 04 00051 g004
Figure 5. Spectrum-time profiles of the sensor hb103 (2 and 5 November 2017).
Proceedings 04 00051 g005