Abstract
Presently, the growing challenge of Reverse Logistics (RL) transportation has broadly received attentions in supply chain management area from both scholars and practitioners. When products have reached their end-of-life they have to enter into reverse chain for the purpose of either recycling, repair, re-manufacturing, or re-use. As a matter of fact that the cost of transporting products through a reverse supply chain is often higher than moving the original product from the manufacturer to the consumer. A well-organized reverse logistics network especial transportation can lead to save cost, increase revenue and customer satisfaction. The optimized reverse logistics transportation is one of the crucial tasks for enterprises to gain the competitive advantage from their supply chain network. This paper aims to optimize the transportation cost of end-of-life lead- acid batteries between the recycle consolidation centers and smelting manufacturers. A Linear Programming (LP) model was formulated in order to solve the transportation problem. The two scenarios of transportation service fees (cost per volume versus cost per trip) were comparison. The proposed approach was applied to real case in central region of Thailand. The numerical experiments was executed to minimize the transportation cost of the system on both scenarios. In term of total transportation cost of system, the result from this study indicated that cost per volume scenario is lower than cost per trip scenario.
1. Introduction
Environmental problem as well as government’s regulation has sparked Reverse Logistics (RL) interest. RL is the process of moving goods; used, damaged, unwanted, outdated or waste products; from their sources to the final destinations. The ultimate goal of RL approach is to capture values and proper disposal waste management [1]. This approach can help the recycle enterprises to add value and to reduce the raw material cost. Each raw material will be processed differently depends on its nature. Even though the reverse logistics has different method and process from forward logistics but the basic supply chain activity still be the same. There were several past researches studied in many aspects of RL such as Gołębiewski et al. [2] considered the facility location problem in the reuse and recycle process respectively; Xiao et al. [3] studied the location and allocation problem to find the best place for recycle and Habibi et al. [4] conducted research on the collection and disassembly for end-of -life products to minimizes the total cost of collection and disassembly; Trochu et al. [5] studied eco-efficient reverse logistics network design under environmental regulations etc.
End-of-life or unwanted goods requires the suitable transportation planning in order to minimize cost. As a matter of fact, the cost for managing reverse chain is high and also the reverse transport is normally higher than forward transport Govindan et al. [6]. According to Chiou et al. [7]; Subulan et al. [8], the proper reverse logistics transportation can help relevant enterprises reduce cost, increase profit, increase customers’ satisfaction and gain the competitive advantage from their supply chain network.
This paper aims to optimize the transportation cost of end-of-life lead-acid batteries from consolidation centers to smelting manufacturers by applying Linear Programming (LP) approach.
2. Materials and Methods
2.1. Problem Description
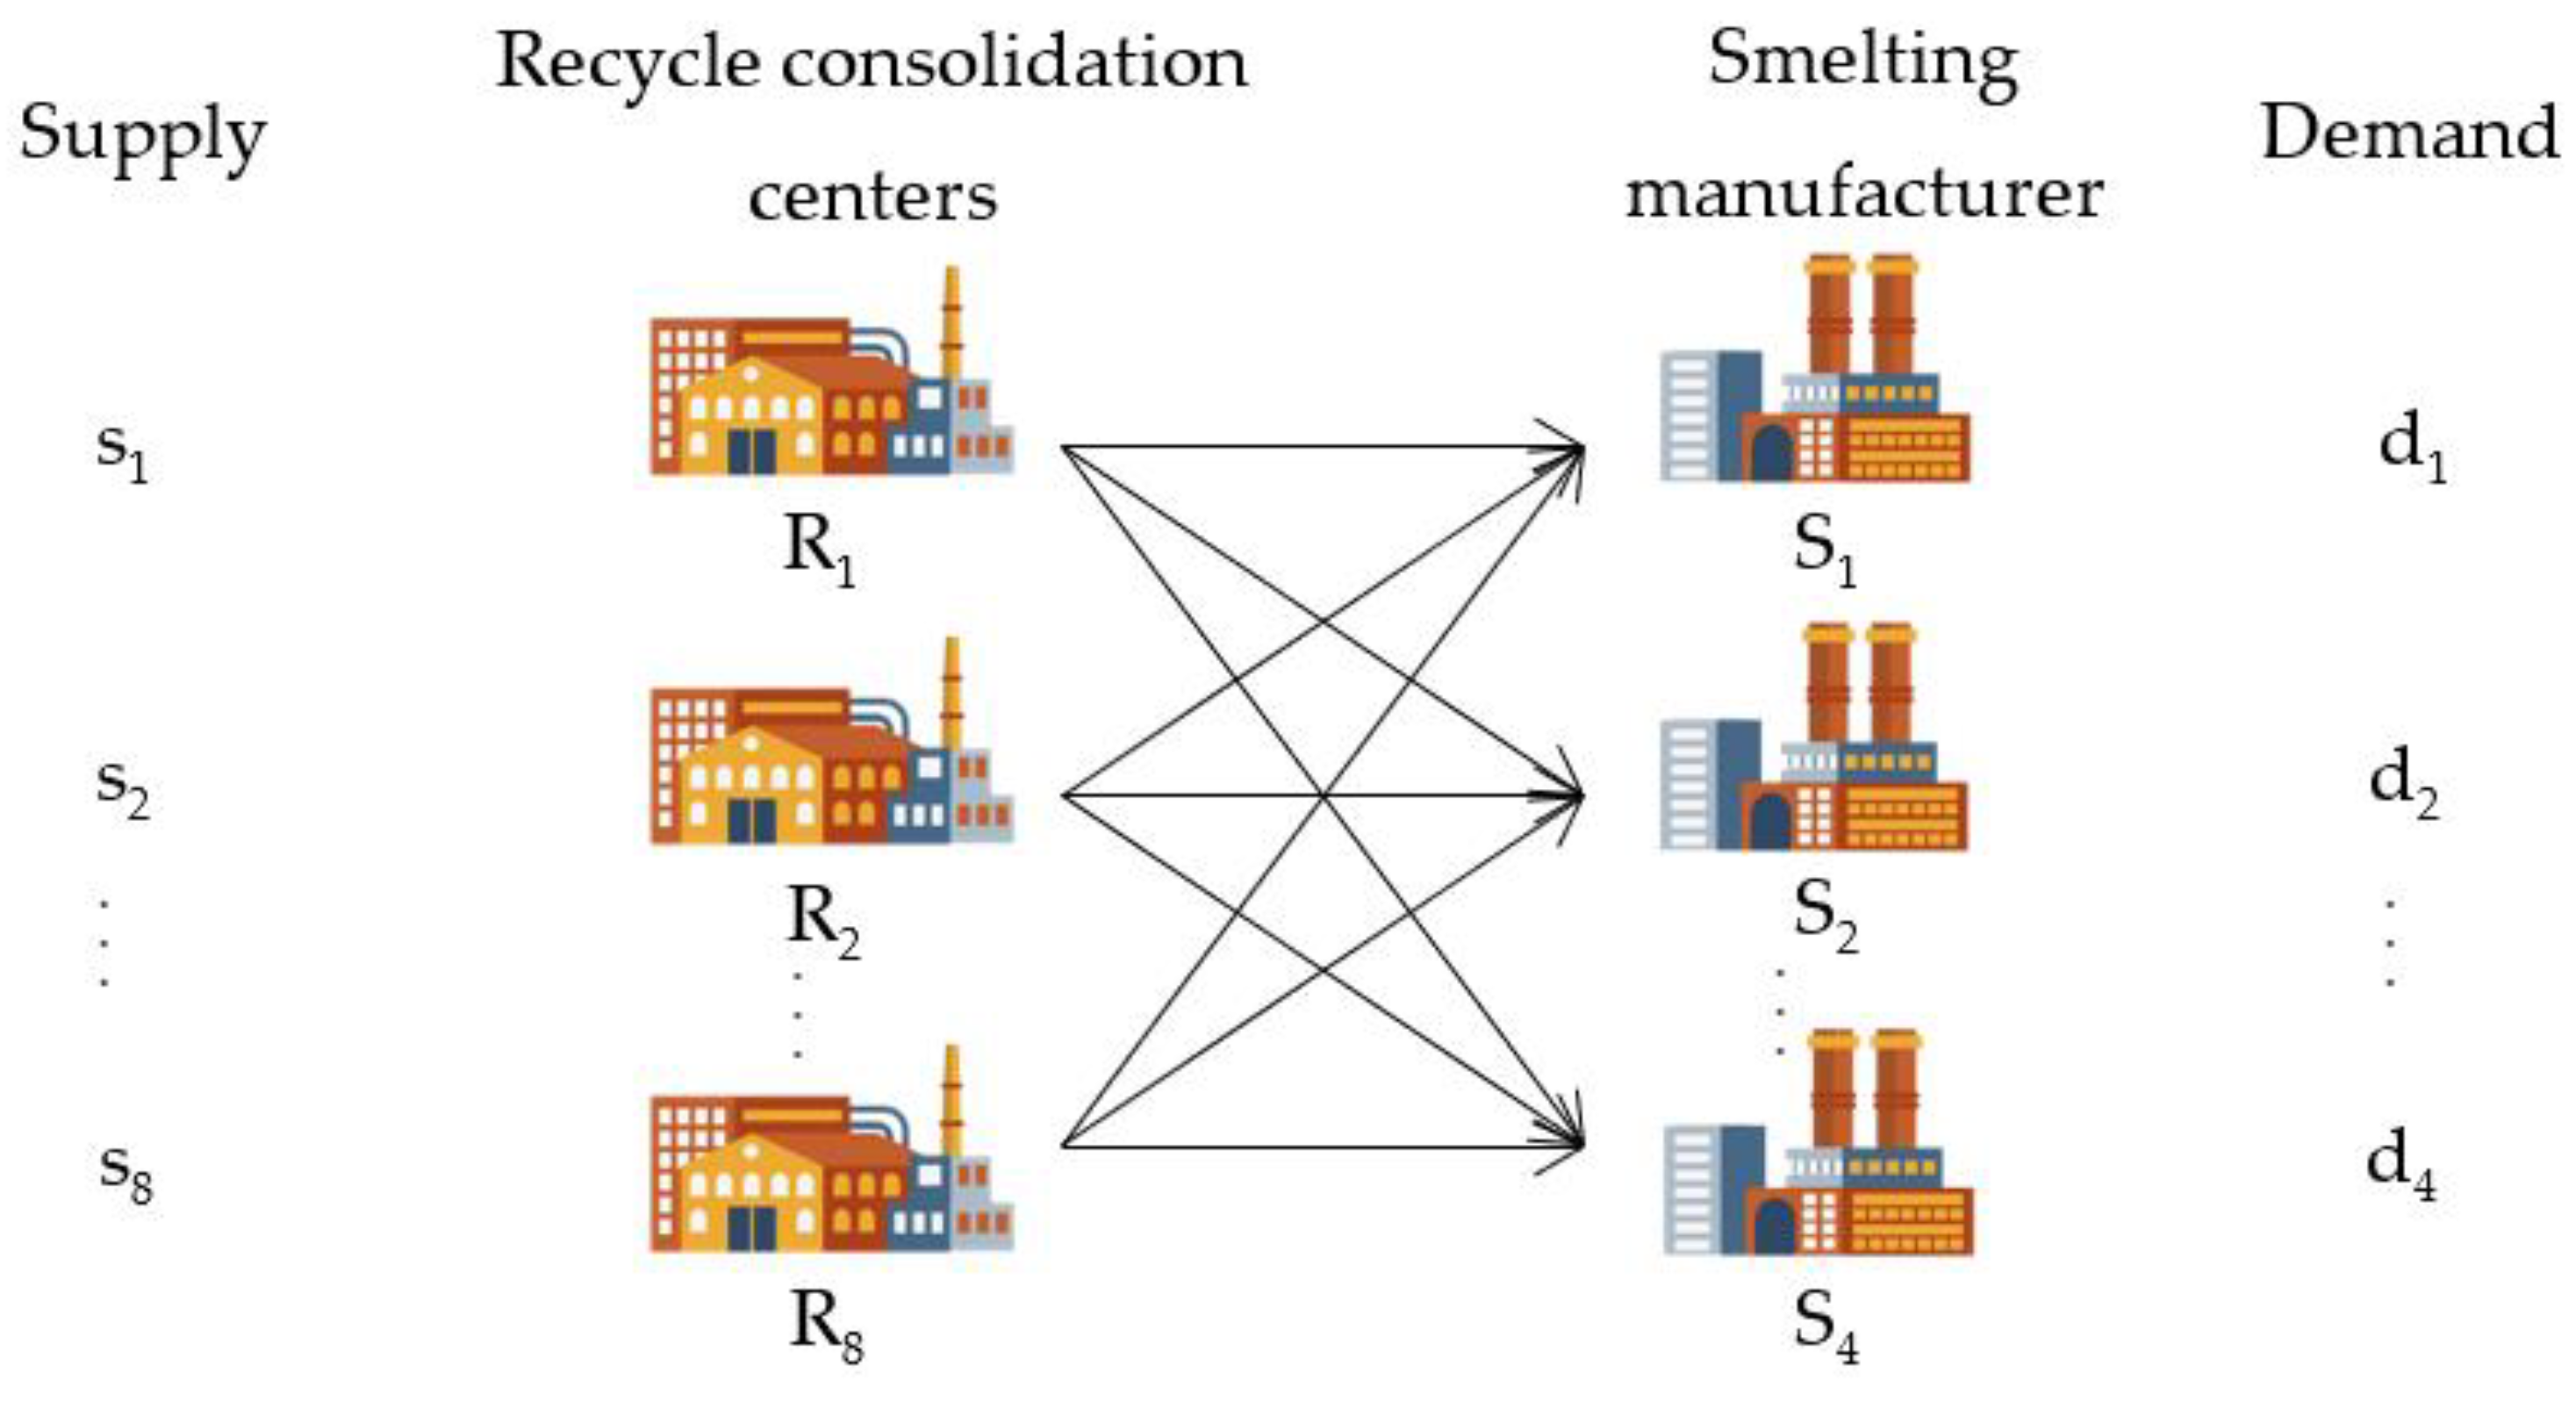
This section describes the specific problem and mathematical model for transportation planning of end-of-life vehicle lead- acid batteries between the recycle consolidation centers and the smelting manufacturers is shown in Figure 1. By using central part of Thailand as a case study, there are eight recycle consolidation centers, which are located in different regions. The available annual consolidation quantity of end-of-life vehicle lead- acid batteries at each recycle centers are 10,165.2 (R1), 1016.5 (R2), 10,165.2 (R3), 5082.6 (R4), 1016.5 (R5), 5082.6 (R6), 1016.5 (R7) and 25,413.0 (R8) tons per year respectively. For the smelting manufacturers, four sites are located throughout the region with available capacity 12,600.0 (S1), 9000.0 (S2), 6000.0 (S3), and 12,000.0 (S4) tons per year respectively. The transportation cost in Thai currency (baht) together with supply quantity (per year) at each recycle consolidation centers and the capacity (per year) at each smelting manufacturers are illustrated in Table 1. By making the contract with recycle companies, a third party logistics (3PL) company take responsibility to shift end-of-life lead-acid batteries from recycle consolidation centers to smelting manufacturers.

Figure 1.
Transportation Problem.

Table 1.
The information of capacity, supply quantity and cost.
This study simultaneously considers transportation problem together with reverse logistics context. This paper aims to find the optimal transportation cost by comparing the two scenarios of transportation service contracts. The first scenario is volume contract (cost per volume) and the second scenario is lump-sum contract (cost per trip).
From Table 1, the total supply quantities of all recycle consolidation centers is 58,958.3 tons per year and the total available capacities of all smelting manufacturers is 39,600.0 tons per year. Hence, the total supply quantity is exceed total demand 19,358.3 tons per year (about 32.8%).
This study separates the problem into two situations. Situation 1 (with dummy) each smelter manufacturer received supply quantity equal its available capacity caused oversupply quantity 19,358.3 tons. In order to tackle this problem, the dummy smelter manufacturer with available capacity 19,358.3 tons per year was established. Situation 2 (without dummy) by supposing each smelting manufacturers can increase its available capacity in proportion to match with oversupply quantities. Hence, the total remaining supply quantities (19,358.3 tons per year) were shared among four smelting manufacturers as spited to 951.94, 537.10, 9024.73, 18,049.46 tons per year respectively. The result of sharing total remaining quantities made demand and supply were balancing in quantities.
2.2. Mathematic Model
This section presents a linear programming model for transportation problem. This study begins with defining a decision variable and parameters. The decision variables represents the amount of end-of-life lead-acid batteries quantities, which transport from consolidate center i to smelter manufacture j. This study defines m and n as the number of consolidate centers and smelter manufacturers, respectively. The parameters represent the transportation service fees from consolidate center i to smelter manufacture j, stand for the supply quantities at each consolidate center and stand for the available capacity at each smelter manufacture. The linear programing (LP) model of the transportation is formulated as following below.
| Minimize | (1) | |
| Subject to | (2) | |
| (3) | ||
| (4) |
The objective Function (1) is to find minimum transportation service cost in each scenario. Constrain (2) represents the quantities of end-of-life vehicle lead- acid batteries taken out from consolidate center that will not exceed the supply quantities at each recycle consolidate center. Constrain (3) represents the quantities of end-of-life vehicle lead- acid batteries was assigned to each smelter manufacture cannot exceed its available capacity.
3. Result
The numerical experiment was executed to optimize the transportation cost of the system on both scenarios. The simplex method was applied to solve LP problem by code in python language on Intel core i5-3337U CPU 1.80 GHz RAM 8 GB as shown in Table 2. Based on Table 2, Scenario I (cost per volume) the total transportation cost of situation 1 (with dummy) 71,023 baht was lower than situation 2 (without dummy) 108,773 baht and Scenario 2 (cost per trip) the total transportation cost of situation 1 (with dummy) 77,115 baht was lower than situation 2 (without dummy) 119,248 baht.
Table 2.
The optimal transportation cost in two situations.
4. Discussion
This paper proposes the LP model to solve transportation problem for end-of-life lead-acid batteries from eights recycle consolidation centers to four smelting manufacturers which all facilities are located in central region of Thailand. The result indicates that the total transportation cost by using volume contract (cost per volume) always lower than the total transportation cost of lump-sum contract (cost per trip). To obtain minimize the total transportation cost, this study recommends that the recycle companies should select the volume contract instead of lump-sum contract with 3PLs. For demand side, the result for this study points out that the total transportation costs of situation 1 (with dummy) are lower than costs of situation 2 (without dummy) for both scenarios. It is implied that each smelting manufacturers should maintain theirs current available capacities in order to minimize the total transportation cost.
Author Contributions
Conceptualization, S.S. and D.S.; methodology, S.S.; software, S.S.; validation, S.S. and D.S.; formal analysis, S.S.; investigation, D.S.; resources, S.S.; data curation, S.S.; writing—original draft preparation, S.S.; writing—review and editing, D.S.; supervision, D.S. All authors have read and agreed to the published version of the manuscript.
Funding
This research received no external funding.
Conflicts of Interest
The authors declare no conflict of interest.
References
- Roger, D.S.; Tibben-Lembke, R. Going Backwards: Reverse Logistics Trends and Practices; Reverse Logistics Executive Council: Pittsburgh, PA, USA, 1999; pp. 1–36. [Google Scholar]
- Dat, L.Q.; Linh, D.T.T.; Chou, S.-Y.; Yu, V.F. Optimizing reverse logistics costs for recycling end-of-life electrical and electronic products. Expert Syst. Appl. 2012, 39, 6380–6387. [Google Scholar] [CrossRef]
- Gołębiewski, B.; Teajer, J; Jaros, M.; Winiczenko, R. Modelling of the location of vehicle recycling facilities: A case study in Poland. Resour. Conserv. Recycl. 2013, 80, 10–20. [Google Scholar] [CrossRef]
- Habibi, M.K.K.; Battaïa, O.; Cung, V.D.; Dolgui, A. Collection-disassembly problem in reverse supply chain. Int. J. Prod. Econ. 2017, 183, 334–344. [Google Scholar] [CrossRef]
- Trochu, J.; Chaabane, A.; Ouhimmou, M. Reverse logistics network redesign under uncertainty for wood waste in the CRD industry. Resour. Conserv. Recycl. 2018, 128, 32–47. [Google Scholar] [CrossRef]
- Govindan, K.; Palaniappan, M.; Zhu, Q.; Kannan, D. Analysis of third party reverse logistics provider using interpretive structural modeling. Int. J. Prod. Econ. 2012, 140, 204–211. [Google Scholar] [CrossRef]
- Chiou, C.Y.; Chen, H.C.; Yu, C.T.; Yeh, C.Y. Consideration factors of reverse logistics implementation A case study of Taiwan’s electronics industry. Procedia Soc. Behav. Sci. 2012, 40, 375–381. [Google Scholar] [CrossRef]
- Subulan, K.; Tasan, A.S.; Baykasoglu, A. Designing an environmentally conscious tire closed-loop supply chain network with multiple recovery options using interactive fuzzy goal programming. Appl. Math. Model. 2015, 39, 2661–2702. [Google Scholar] [CrossRef]
© 2020 by the authors. Licensee MDPI, Basel, Switzerland. This article is an open access article distributed under the terms and conditions of the Creative Commons Attribution (CC BY) license (http://creativecommons.org/licenses/by/4.0/).