1. Introduction
Mobility is an essential activity in urban environments, where dwellers and visitors are constantly making decisions in order to take the best route from one point to another (where “best” is a function of multiple criteria). For instance, a city resident may decide that the best route to take today from home to work is one where their favorite coffee shop is along the path; a tourist may consider that the best route from the Central Plaza to the Municipal Theater is the one where they can walk and encounter the most tourist attractions. There are several applications to aid in navigating urban spaces (e.g., Google Maps, Waze, Navitime), and most often, they suggest routes according to the criterion of taking the shortest route, although some suggest alternatives also considering other criteria such as travel time and traffic congestion. As discussed in the next sections, the literature documenting urban mobility and the technological aids developed to assist citizens is based on assumptions about infrastructure and conditions that are not present in developing countries and its most underserved regions; this is because those are regions where there is not adequate urban infrastructure, where the geographic conditions can be adverse, where insecure zones are common, and non-planned built environments are present. We aim to understand how the urban environment in these regions affects the mobility of its inhabitants and what an appropriate tool for navigation should consider.
Therefore, in
Section 2, we explore the literature related to mobility and navigation systems for urban spaces and highlight how these works are not adequate for developing regions. We then proceed (
Section 3) to use qualitative techniques for a contextual study upon which we base the design and implementation of a system for tracking mobility, as well as analyzing and visualizing the results. This system is used in a crowdsensing campaign where residents of the Camino Verde neighborhood (a marginalized region) participated. The results of this campaign show (
Section 4) how the mobility decisions of residents are affected; these results must inform the design of a navigation system (
Section 5) adequate for underserved neighborhoods.
Section 6 concludes summarizing our current achievements and the planned work for implementing and testing the navigation system.
2. Related Work
Urban mobility has been widely studied, either through simulation [
1] or through more empirical studies [
2]. However, except for some broad characterizations [
3], not much attention has been paid to the particular case of underserved urban zones.
According to recent reports [
4], global urbanization is increasing, the majority of the population now lives in cities, and developing countries are the ones experiencing the highest growth rates. However, a literature review shows [
5] that our current understanding of urban mobility is grounded on studies made in highly developed countries, with adequate urban infrastructure; in other words, the urban areas where most people live are being neglected. The geographic environment affects the mobility decisions and possibilities of urban dwellers [
6], so it follows that there will be significant differences between developed and underdeveloped urban regions.
For instance, studies such as the one conducted by Lathia
et al. [
7] aim to understand mobility patterns by tracking users of public transportation systems (
e.g., through the use of checks ins and outs of transportation cards). A similar study would be very difficult, or plain impossible, in underserved cities where payments in public transportation are made exclusively in cash, and where official routes are seldom followed. Therefore, in these environments, different methodologies and tools should be applied. Similarly, the large-scale use of tracking devices [
8,
9] in vehicles such as taxis, motorcycles, bicycles, and others have resulted invaluable insights. Again, in underserved regions, this type of study would be impractical as usually public transportation is not widely available there or it is so basic that a tracking device would be considered an unnecessary luxury (as would also be the case of private vehicles that some residents may own).
Google Maps and Waze are freely available apps that can be used by mobile phone users to view maps, get route recommendations, visualize traffic conditions, and other useful functions; there are other similar apps with a more localized approach, such as Navitime [
10] in Japan. We have tested several such apps and found some issues that make them inadequate for the regions we are interested in. For instance, they do not provide comprehensive information about the neighborhood, as some streets are not mapped and pedestrian routes suggestions are not available; also, it is lacking important collective knowledge such as informal routes (that do not appear in official maps), dangerous zones, walkability, absence of sidewalks, steepness of streets, public lights, and others that may affect mobility decisions.
3. A System for Characterizing Mobility in Underserved Urban Spaces
3.1. Contextual Study
We first conducted a contextual study to understand how the residents of an underserved community conduct their daily mobility, according to their geographic environment, the urban infrastructure available (or not), the public transportation facilities, and others.
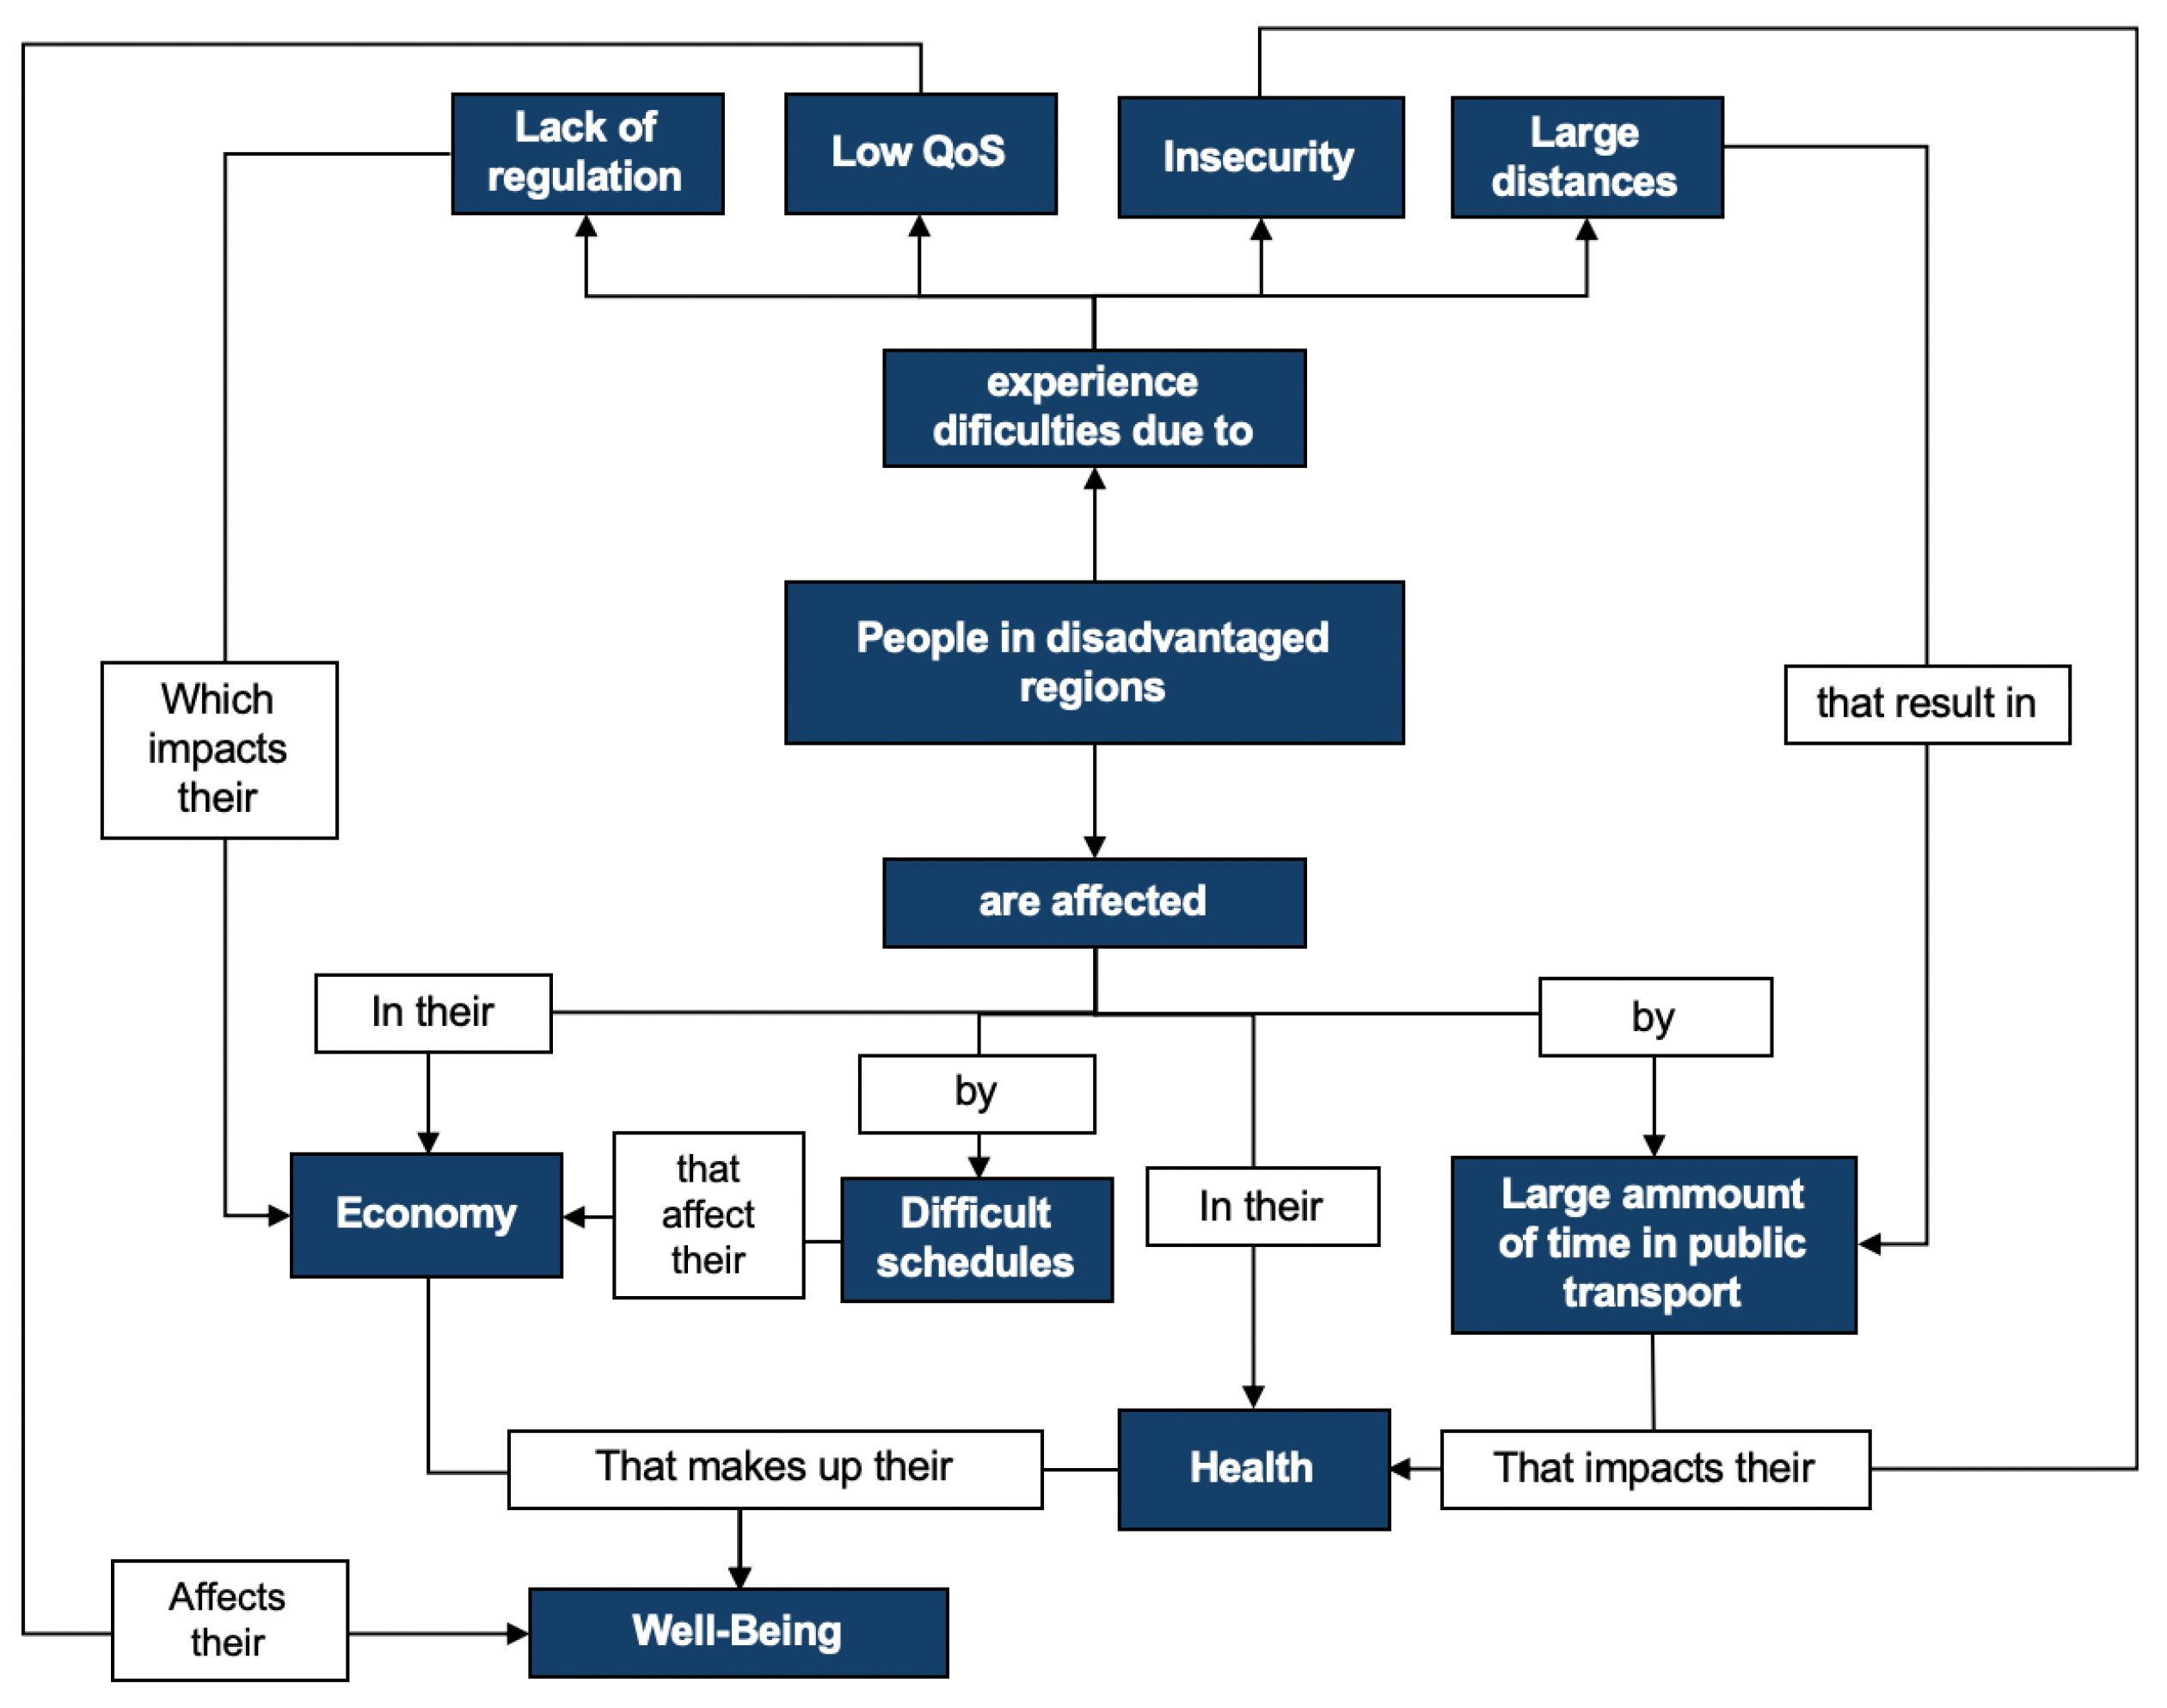
Two different interviews were applied to neighbors of Camino Verde. The interviews focused on understanding how the lives of people that live in underserved regions are affected by a lack of access to jobs and public services and what role public transport has in this. Participants were asked about their health, their economy, and public transport.
For both interviews, recurrent topics emerged. For instance, public transportation in the area is deficient both in its quality and the availability of routes, therefore this affects the mobility possibilities of residents. As a consequence, respondents also expressed the desire to have their own private means of transportation but deplored the fact that they could not afford it. Axial coding [
11] allowed to find the core themes and elaborate a conceptual model (see
Figure 1). Besides the inefficient public transportation service, other factors such as insecurity in the region, and long distances to traverse daily, affect the mobility decisions, the economy, the health, and the overall subjective well-being of residents. Once the qualitative analysis was done, we were in a better position of understanding the context of use and proceed with the design of our system.
3.2. System Design
It should be noted that although many technologies for tracking urban mobility are available, not all are adequate for our purposes in terms of price, form-factor, unobtrusiveness, user incentives and being unattractive for potential thieves.
For instance, a typical smartphone-based solution would not be adequate for our context as the neighbors would either not have one or would not be able to pay a monthly data usage plan; also, the users would use the phones for texting, games, and other non-tracking purposes, which in turn would rapidly drain the battery (as experienced in test trials). Wearable devices such as smartwatches would be too attractive for potential thieves and would put the users at risk. Thus, we needed a device that could be worn without being in plain sight, that could work without user interaction, and that would not incur data fees, and thus could work without being connected to a data network. After a thorough evaluation process, we decided to use intervened and cheap smartphones (around $ 30 USD) as tracking devices. The main idea is to use the phones in a disconnected data model, only connected to the GPS network. The phones were intervened to not allow any kind of user interaction, so users would just keep them in their pockets during the tracking period. Additionally, as a user incentive, after the tracking period had concluded, the phones would be unblocked, and users would be able to keep them.
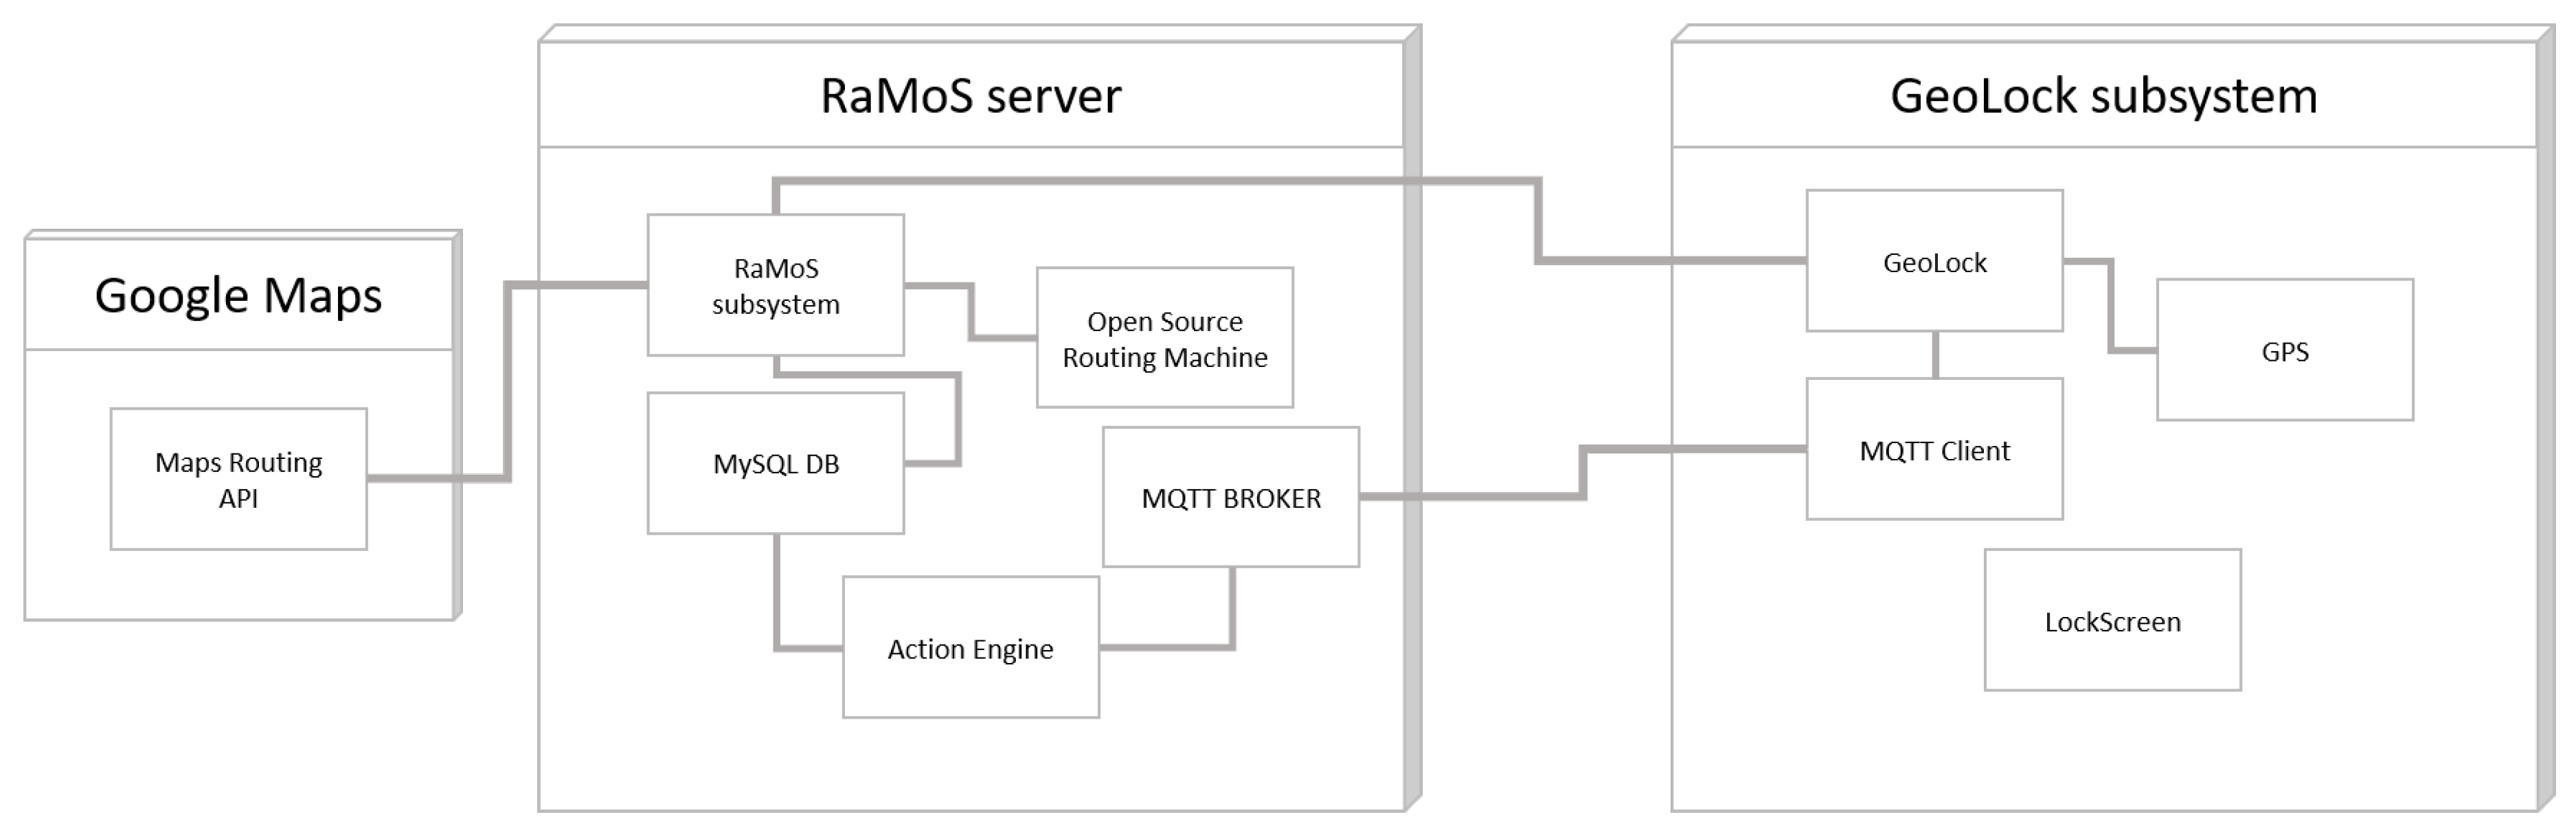
As can be seen in
Figure 2, there are two main parts in our system: the GeoLock subsystem installed in the tracking devices, and the RaMos subsystem residing in a server and used for
a posteriori data analysis and visualization.
3.3. GeoLock subsystem
This subsystem was implemented for devices running the Android OS. The GeoLock subsystem has 10 main nodes, although there are other minor ones not worth detailing here. The entry point is called Settings Activity and is meant for the administrator to use to set up a crowdsensing campaign, including info related to participants (
e.g., name, contact), connectivity details (
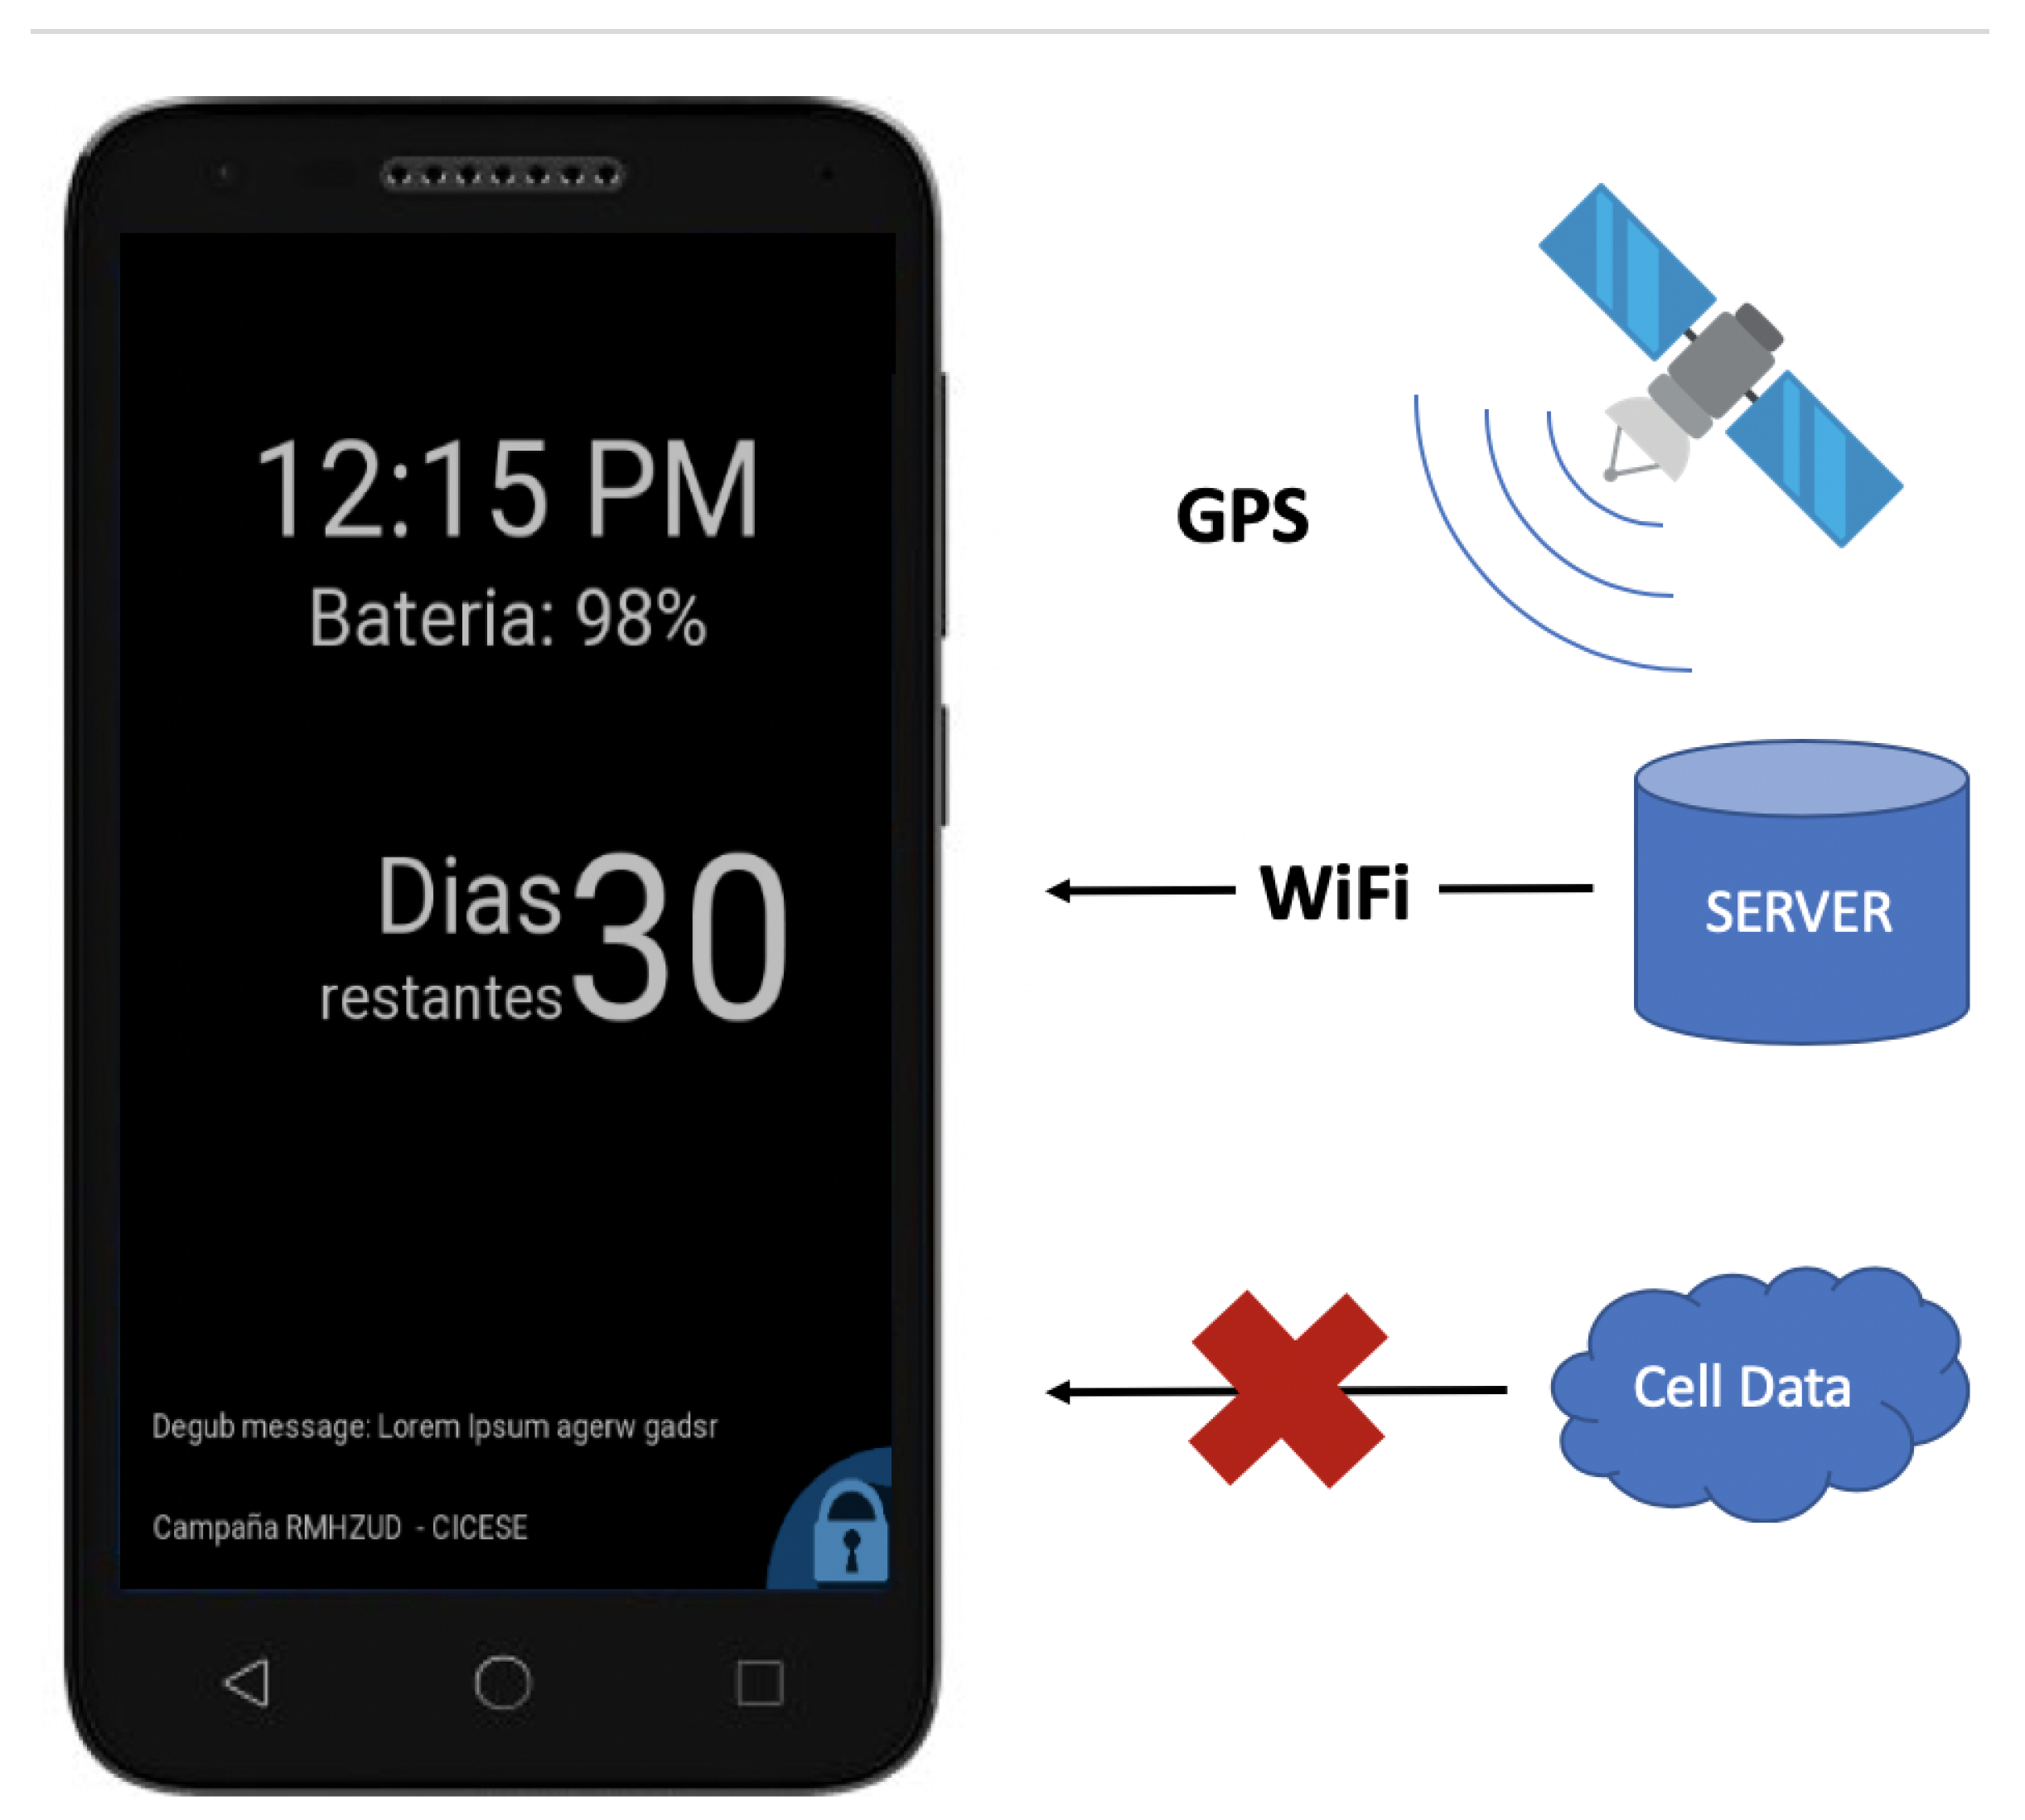
e.g., MQTT server), and a number of days the campaign will be running. These are stored via the Preference Singleton. The Preference Singleton provides access to Android preferences to all other classes via the Android API; it allows sharing application context, configurations, and variables between classes. As previously stated, during the crowdsensing campaign, users will not be able to interact with the phone doing the location tracking; this will be achieved with LockScreen Activity, which will only display information such as date, time, current battery usage, number of days remaining in the campaign, and possibly some message sent from the administrator (could be broadcast or unicast). All forms of input, including physical buttons, will be disabled. See
Figure 3.
Once the Lock-screen activity is initialized, the device will start to collect GPS, altitude and time data. A data point is requested every 75000 milliseconds and is appended to a GeoJSON file that is stored in local memory. A new GeoJSON file is created every hour and these are saved inside dated folders. When the device automatically connects to a known WiFi access point, an MQTT message is sent to the server to begin the file transfer. The process of downloading data from the phones to the server is done via an API on the server side where a negotiation takes place between the device and the server via MQTT. Therefore, there is an MQTT Helper to connect to the MQTT server via our MQTT Client; aiding in these processes are some utilities in MQTT Client to carry out functions such as handling messages, modify the data capture rate and add the device to the registry.
3.4. RaMoS Subsystem
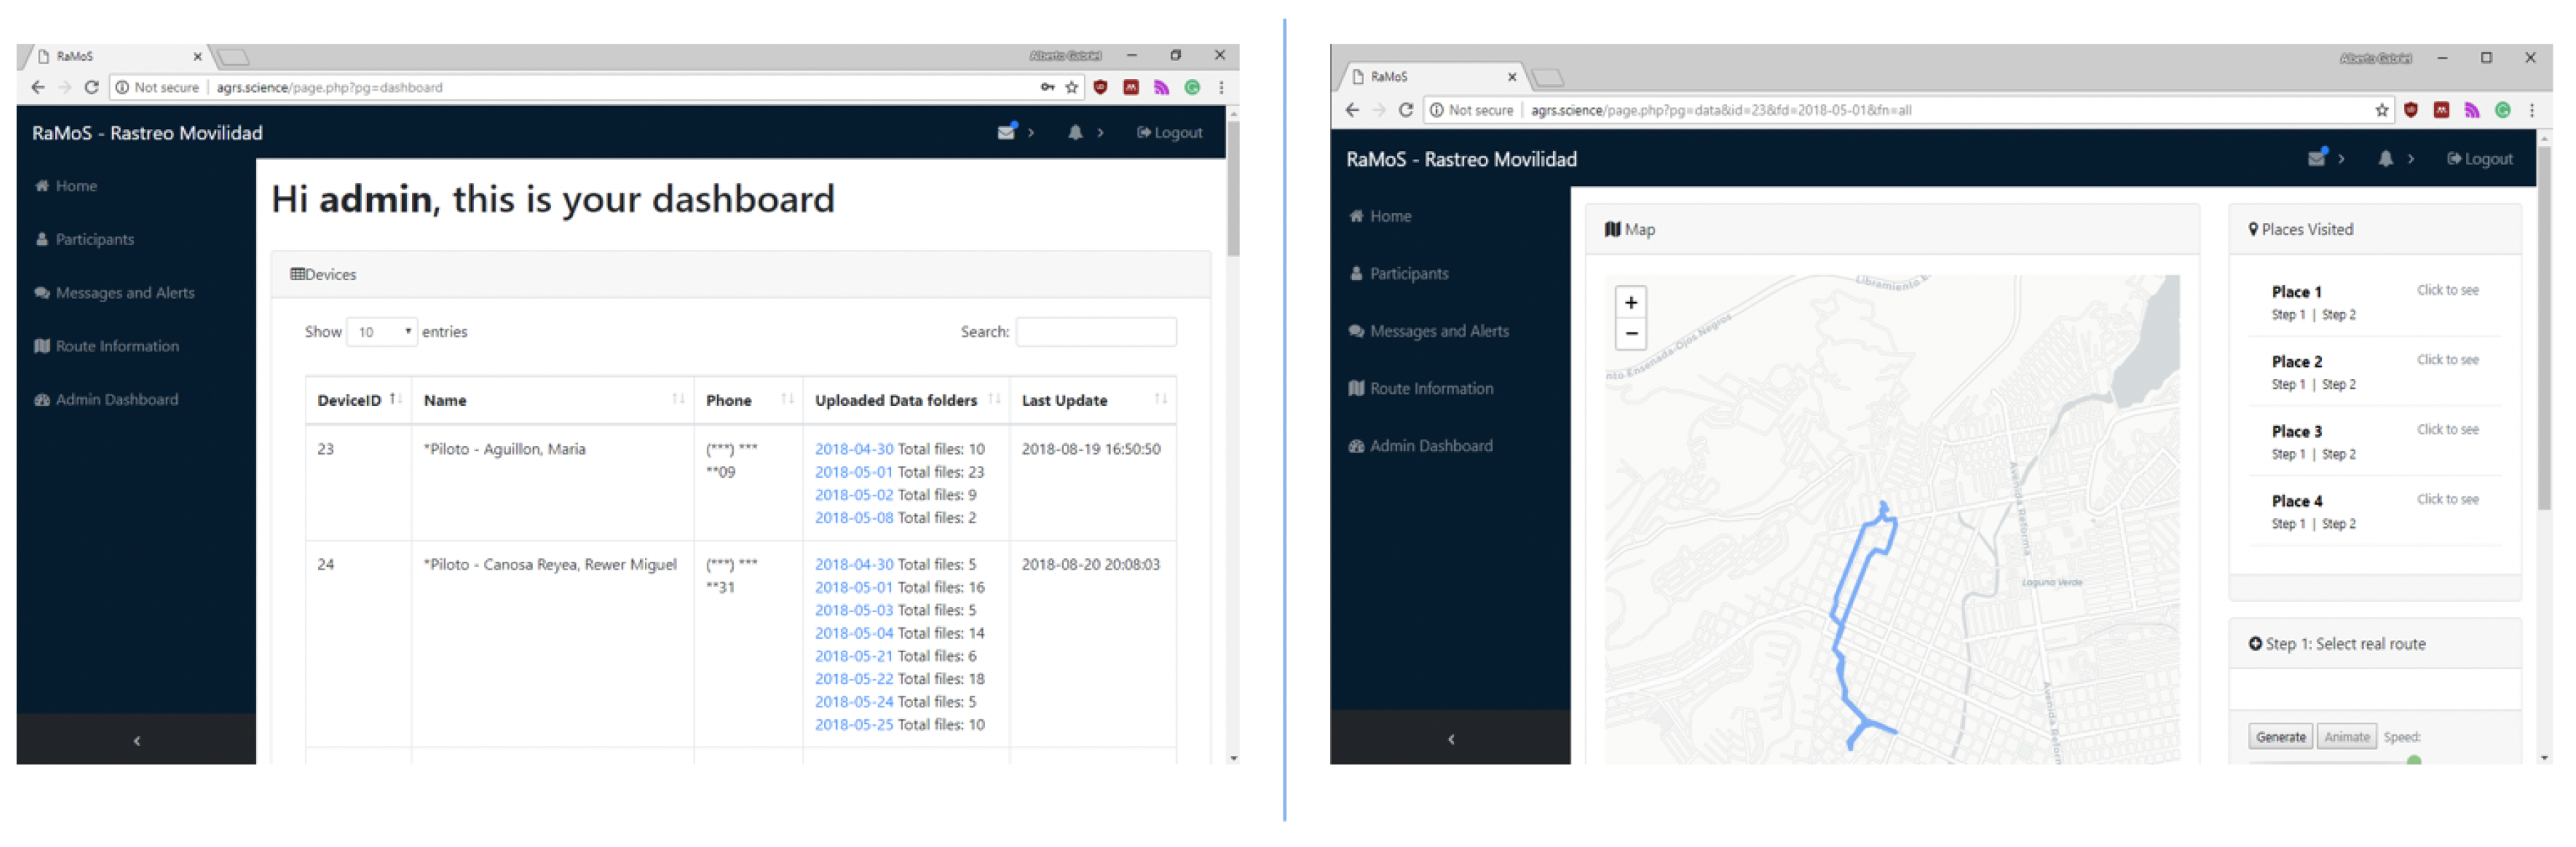
On the server-side, there is a Web application named RaMoS, whose purpose is to collect data from the devices during a crowd-sensing campaign and provide means for analysis and visualization of the data. There are three main components: A Web-based component (rd2) to analyze and visualize mobility data, an always-on application (RaMos.py) that connects to an MQTT server which acts as a broker for messages between the devices and the server, and finally an OSRM based routing engine to generate the expected route between the participant’s algorithm-generated points of interest. The rd2 web component permits the visualization of geo-spatial participant’s routes using the Leaflet JavaScript library and generates a list of points of interest-based on the routes. The always-on application RaMoS.py oversees communicating important information from the server to the devices and negotiating the upload of the data to the server API. Finally, the routing engine provides an API to generate routes between the points of interest, this can be done using the OSRM component or the Google Maps API (
Figure 4).
4. Field Study
We first conducted a pilot test to assess the functionalities of our system, as well as to test it under non-controlled conditions. This test was conducted for 7 days, with 4 participants aged 24 to 38. After this period, we collected the data from the user devices and found out that some users had obtained data for less than 7 days due to application errors. Some users complained about the rapid battery depletion, which led us to adjust the data sampling rate and re-design the user interface to warn about low battery levels. Overall, this pilot test was useful to fine-tune the system and make it more robust for the field deployment.
The field study was conducted in the city of Tijuana, located at the USA-Mexico border. Since the main interest was to design a system adequate to document the mobility of residents of an impoverished and underserved neighborhood, we contacted the center known as La Granja Transfronteriza, ran by the Torolab Collective; they facilitated contact with neighbors of Camino Verde, a community which fits the characteristics needed for our study. It should be emphasized that this is an observational study. Thus we aim only to observe how the residents of an underserved community conduct their daily mobility; at this point, we are not trying to prove any hypothesis or conduct an experiment to control any variables.
4.1. Selection criteria
The first criterion to participate in the study was to be a resident of the Camino Verde neighborhood, so they would be familiarized with the environment and the mobility possibilities; only two participants who don’t live in the neighborhood, but who collaborate in La Granja center, were allowed to participate, as they would also transit inside Camino Verde and would provide a semi-outsider perspective.
A second inclusion criterion was not to own an automotive vehicle. The reason for this was twofold: first, we were most interested in the mobility decisions that people take when having to walk from one place to another, although for longer distances the use of public transportation (if available) could be an option; second, our pilot test showed that using an automobile resulted in exhausting the device’s battery more rapidly, due to the sampling method.
In order to protect the privacy of the participants, an ID was assigned to the tracking devices, but the names (or other identifying characteristics) of the users were never used during the study. The users agreed to this anonymized data collection by signing an informed consent form where the reach and limitations of the study were explained.
The selected participants met with the researchers at a meeting where details of the study were given and where the consent forms were signed. Each participant received a tracking device and was informed that once the data collection period had ended, they would receive the unblocked, fully functional device as a gift. This was part of the incentive model [
12] for the crowdsensing campaign.
4.2. Crowdsensing campaign
The campaign ran for a period of 30 days, where the participants carried the device during their daily activities. Most of them carried it inside their pockets or inside a bag. As previously stated, the user interface was modified so the participants could not interact with the device, other than to watch the screen with information about the current date and time, battery level, and the number of days remaining in the campaign. It is important to note that this refers not to chronological days, but to days with valid, useful data. For instance, if one day the person left the device at home, the system would detect that no mobility data was generated during that day, so it would not count it as valid. In order for a day to be valid, it should have records for at least 8 valid hours, which in turn should display a minimum of 48 minutes of activity; also, hourly mobility should be of at least 250 meters. We chose 250 meters as it is about two blocks. To fulfill this at the end of every hour, we calculate how many meters the person moved, and if this is above the 250-meter baseline we count the hour as valid. At the end of the day, we check to the total amount of hours that are valid, and if this is above 8 hours, we can then count the day as valid. This is a measure to get at least a few hours of valid data a day.
4.3. Campaign Results
From the campaign data collected, we analyzed participant mobility within the city. An initial analysis was only carried out on the first week of data collected from participants; from this analysis, we obtained early insights into the nature of mobility decisions in marginalized environments. Participant
collected 8 days worth of valid data before the first connection to the server. In this period,
moved 14770 meters, with a route average of
= 777.37 meters and a standard deviation
= 1251.5 meters; this is because
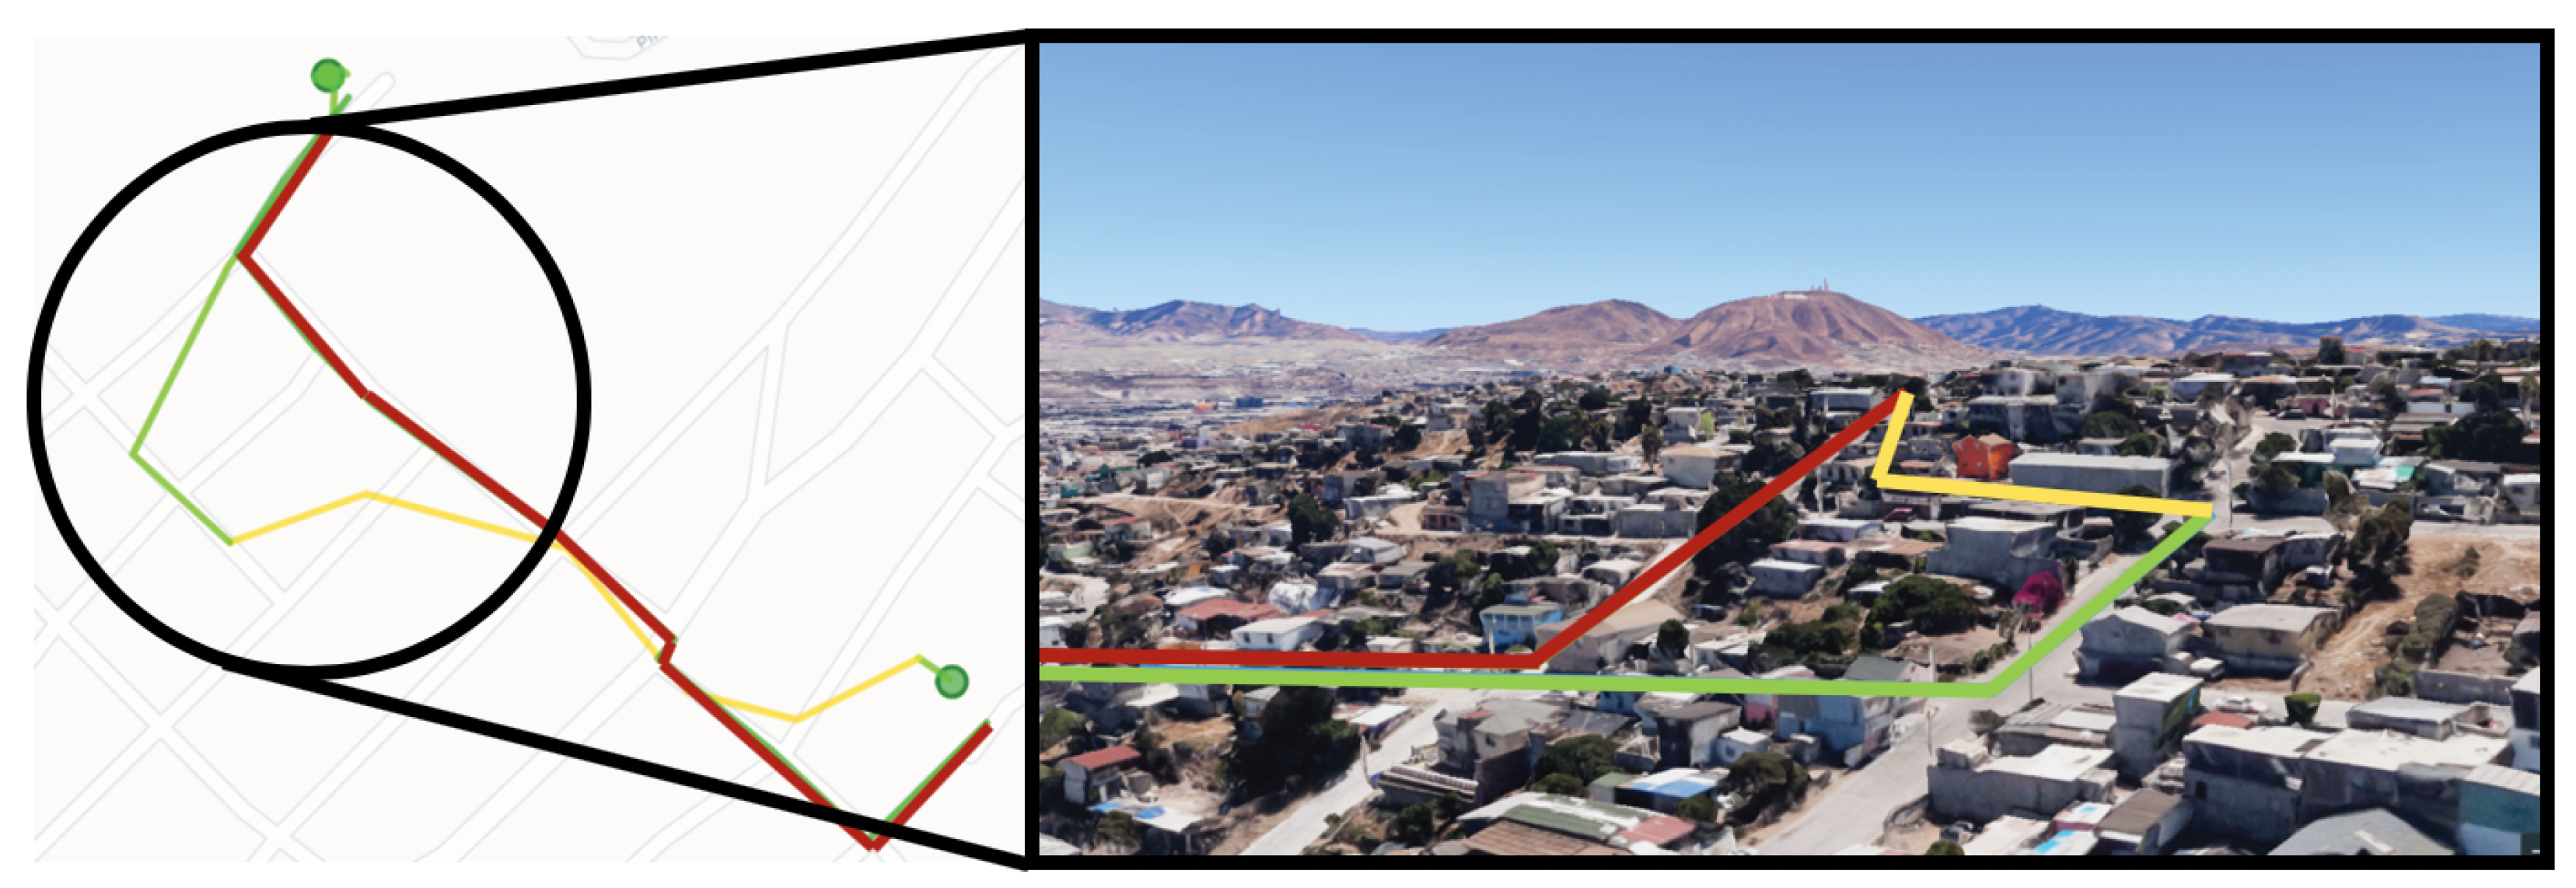
had several short routes and only three long ones from this participant we also could see that in the majority of cases the route suggested by Google was longer than the one the participant took. There were also cases like that of participant
with daily routes outside the neighborhood; in this case, the route included a university campus where many mobility variations could be possible from point A to B, and during the first day, six points of interest were generated, mostly near the campus. It could also be observed that a usual route, as suggested by Google Maps had a length of 8554 meters; in contrast, the actual route taken measured 8661 meters (see
Figure 5). This indicates that it is not always the case that people take the shortest route, as other factors may influence their mobility decisions.
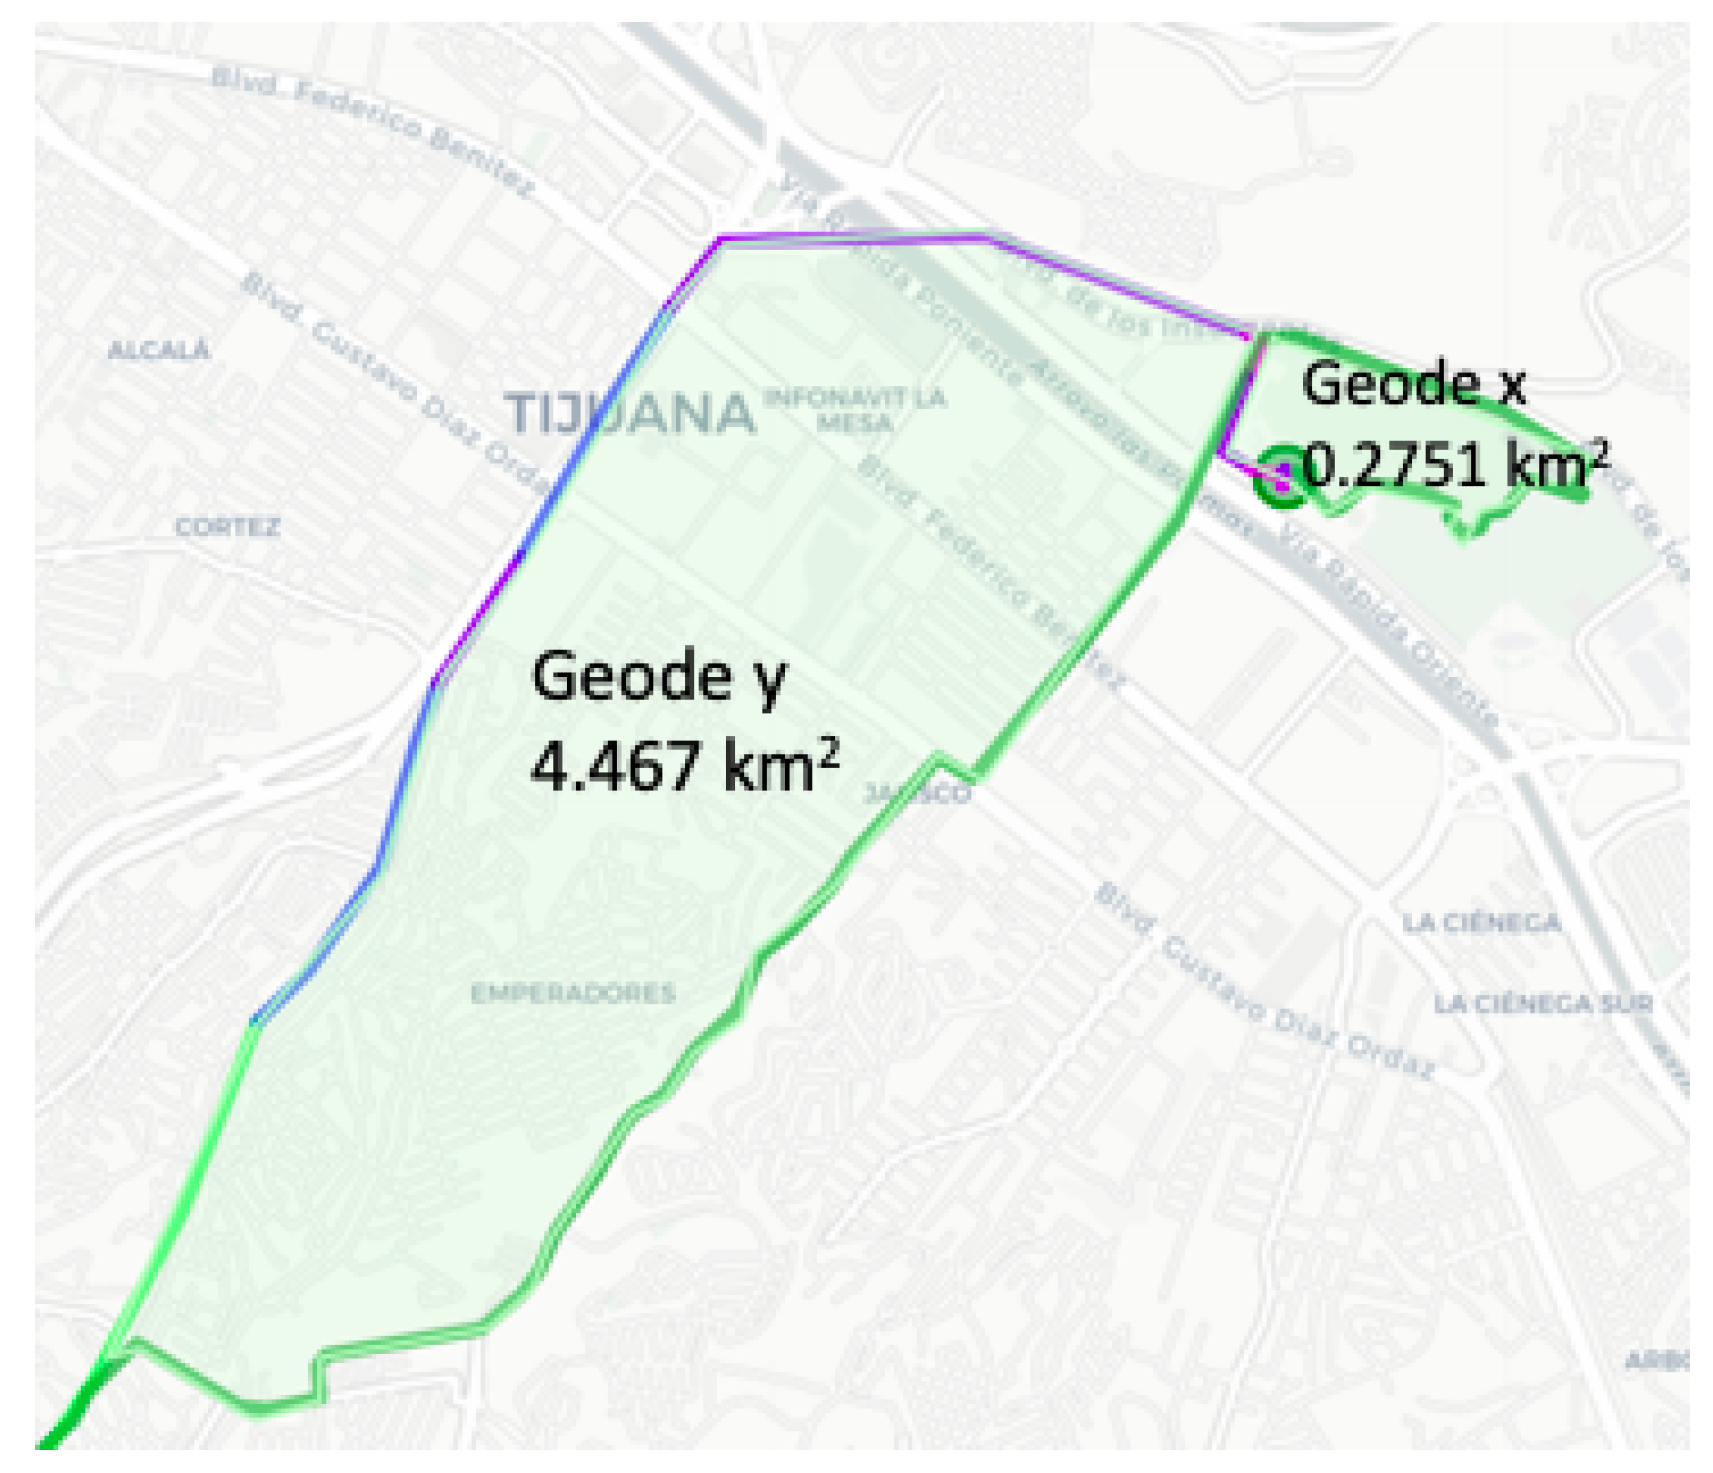
A data analysis ran on our dataset after it had been obtained completely from the user’s devices, taking into account around 494 distinct routes indicates that on average, a route each user took was of 6985 meters while the route suggested by Google was of 5709 meters. We also manually tagged over 600 areas created by the difference between the route traveled by the participant and the route generated by Google Maps. In
Figure 6, we can see a graphical representation of two of these areas, which we called geodes.
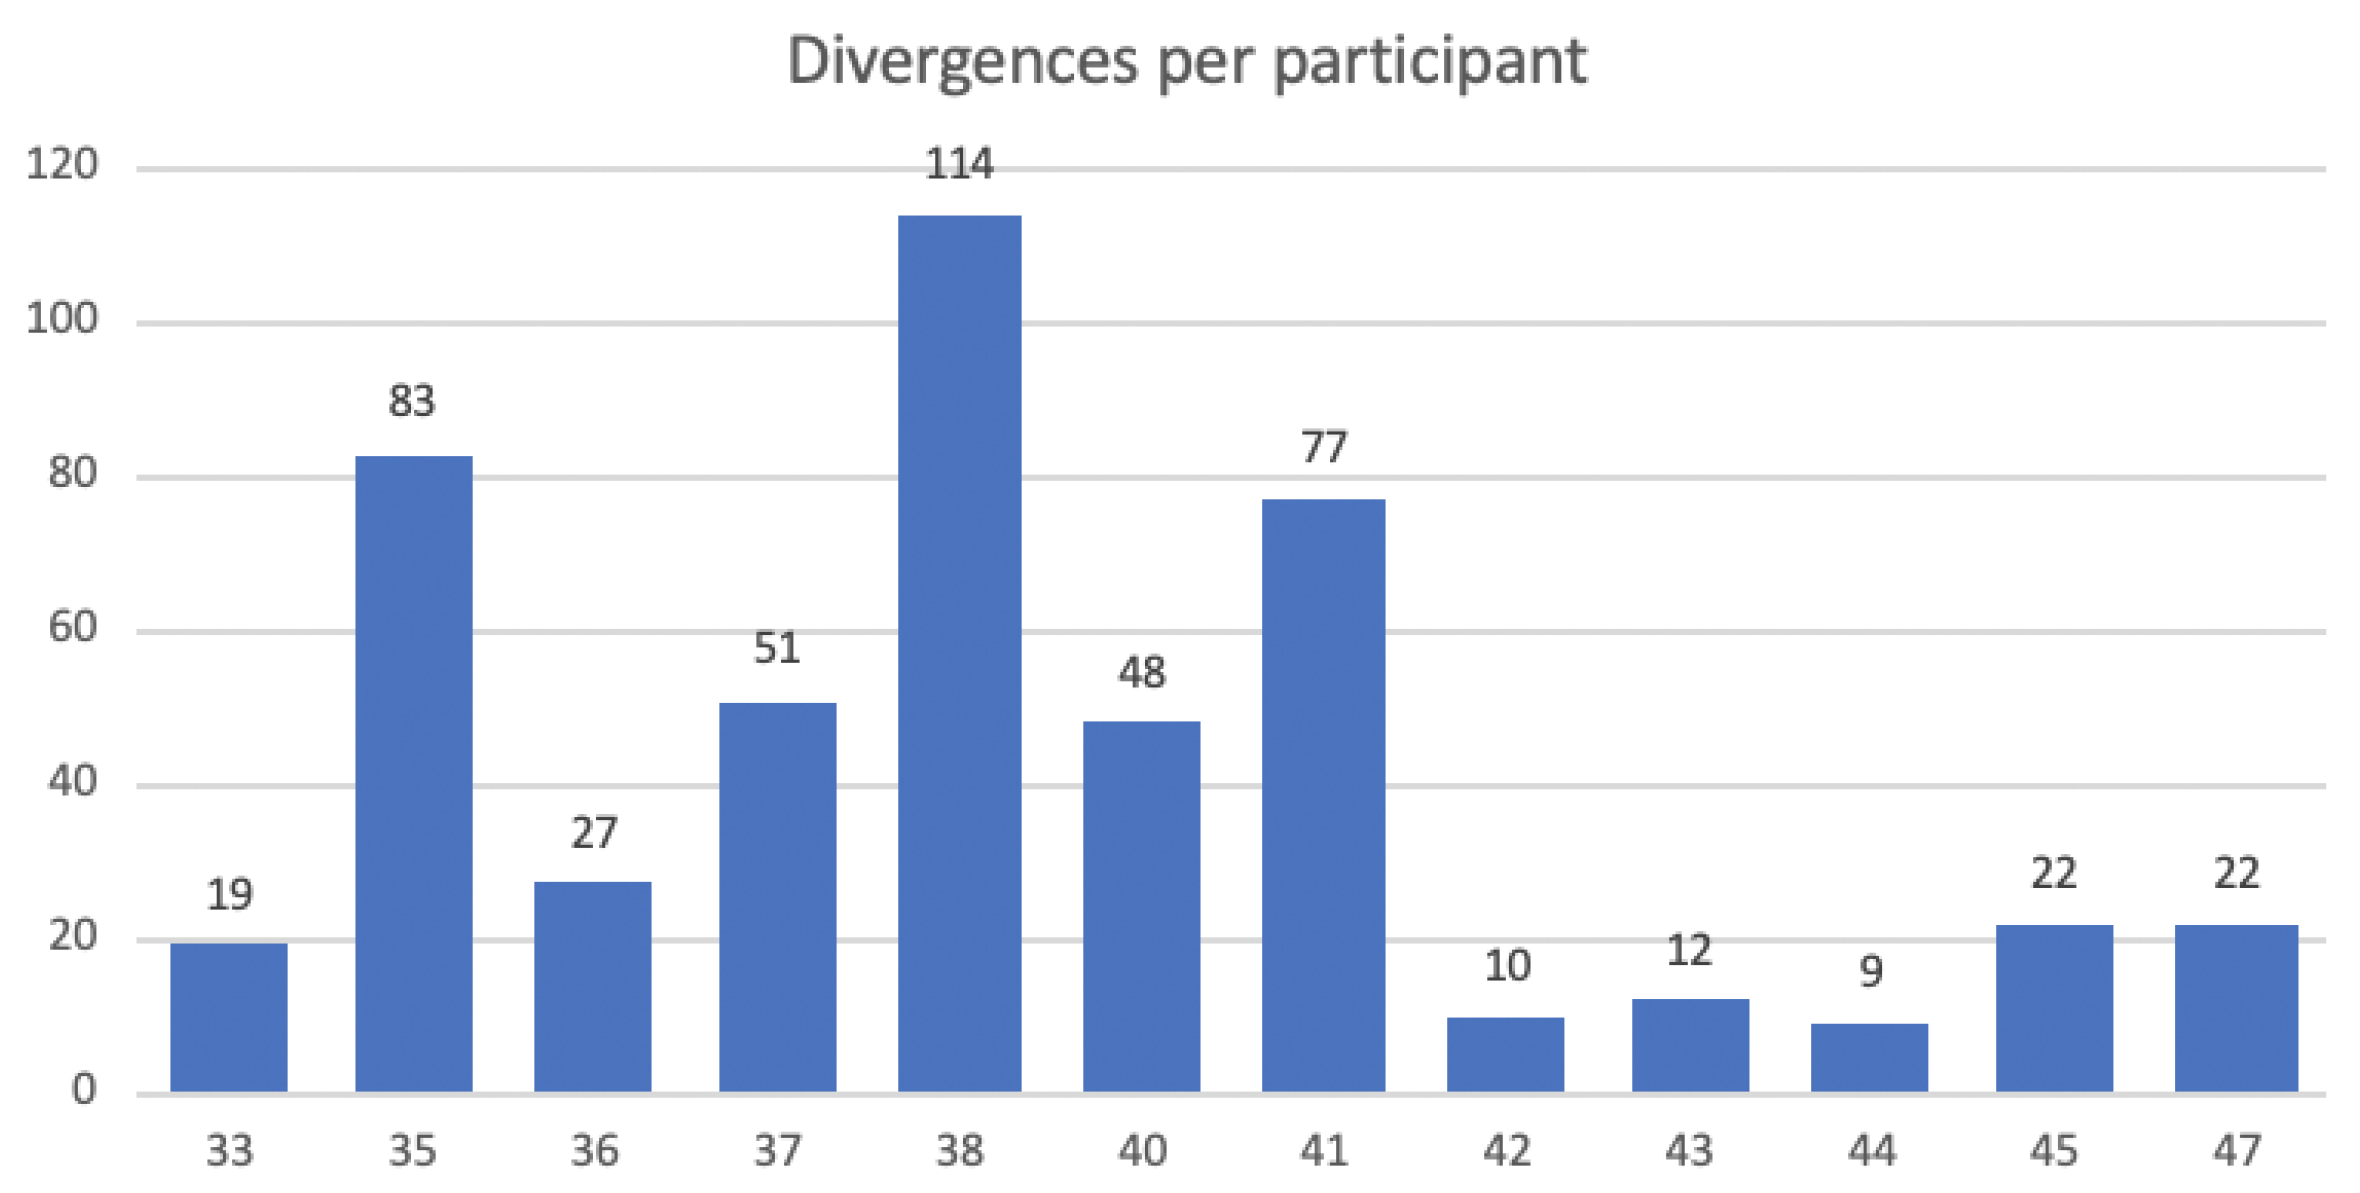
From this, we created a database containing all the geodes. In
Figure 7, we can see the total amount of geodes per participant. While we were only able to obtain 9 geodes from participant
for example, from other participants we were able to obtain as much as 114 geodes. In any case, it is noteworthy that all participants presented multiple divergences during their daily mobility.
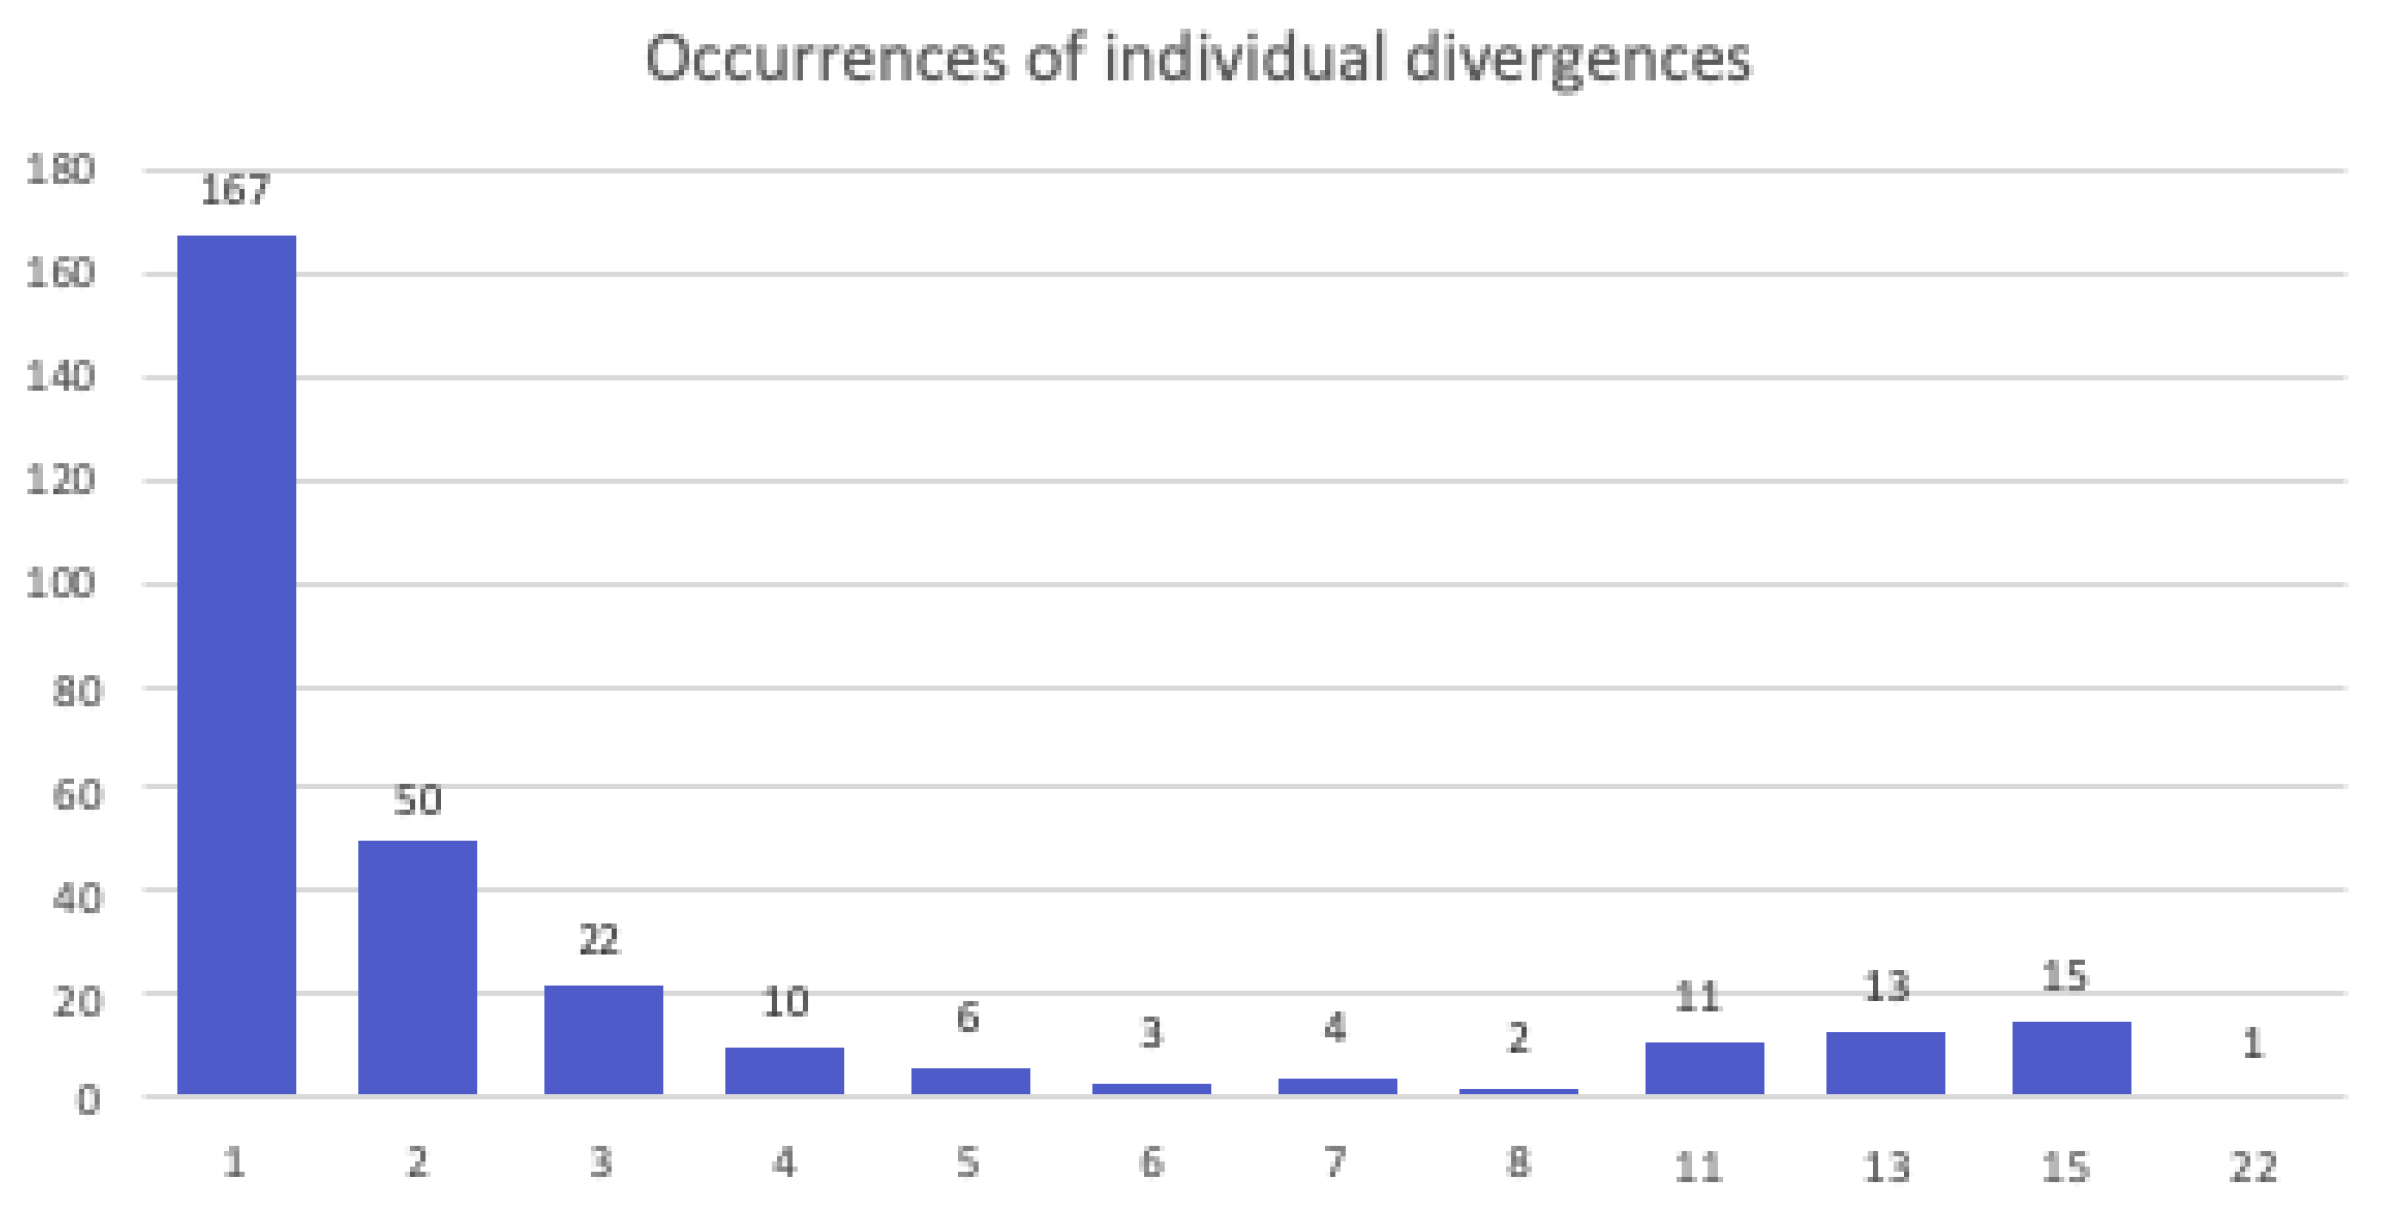
We also wanted to see if there were recurrent divergences, not dependent on the participant. This would allow locating zones that residents systematically avoid, or are unable to cross for some reason. Consequently, from our dataset, we created an array containing the areas of each geode, in order to find the average area and also the average radius; then, we initialized the data set by adding the first geode with the center point (lat, lon) as the key. For each geode, we determined the distance between the center of the points and observed if this was less than the average radius; if it was and there was a 95% similarity between the two areas, we would determine this to be the same geode. Considering that a geode represents a divergence, determining how many times a geode is repeated is equivalent to how many times the correspondent divergence occurs; consequently,
Figure 8 shows the number of occurrences of individual divergences. For instance, reading the graph from left to right, there were 167 divergences that occurred only once, while there were 50 divergences that occurred twice across participants, and so on. We also noticed that there was a significant variation in the areas of some geodes, ranging from over 20 square kilometers for the largest geode to 0.00017 square kilometers for the smallest. Thus, in order to reduce the disparity in our data set, we divided it into two separate sets: one containing small divergences and the other for large divergences.
5. Towards a GeoLock-based Navigation System
As mentioned in
Section 2, current offerings for Navigation Systems lack essential information that could be useful for suggesting possible routes in underserved regions. We are currently working on the design for a route suggestion system based on information collected from users local to the area, such as the information that was collected in our field study.
5.1. Semantic information
Once we had analyzed the data from the crowdsensing campaigns, we observed several patterns (see
Section 4.3) in the mobility of the participating neighbors. In order to try to understand their mobility decisions and how they might be (or not) affected by their environment, we conducted
a posteriori interviews with the participants. In particular, we wanted to understand if the conditions of the neighborhood affect these mobility decisions.
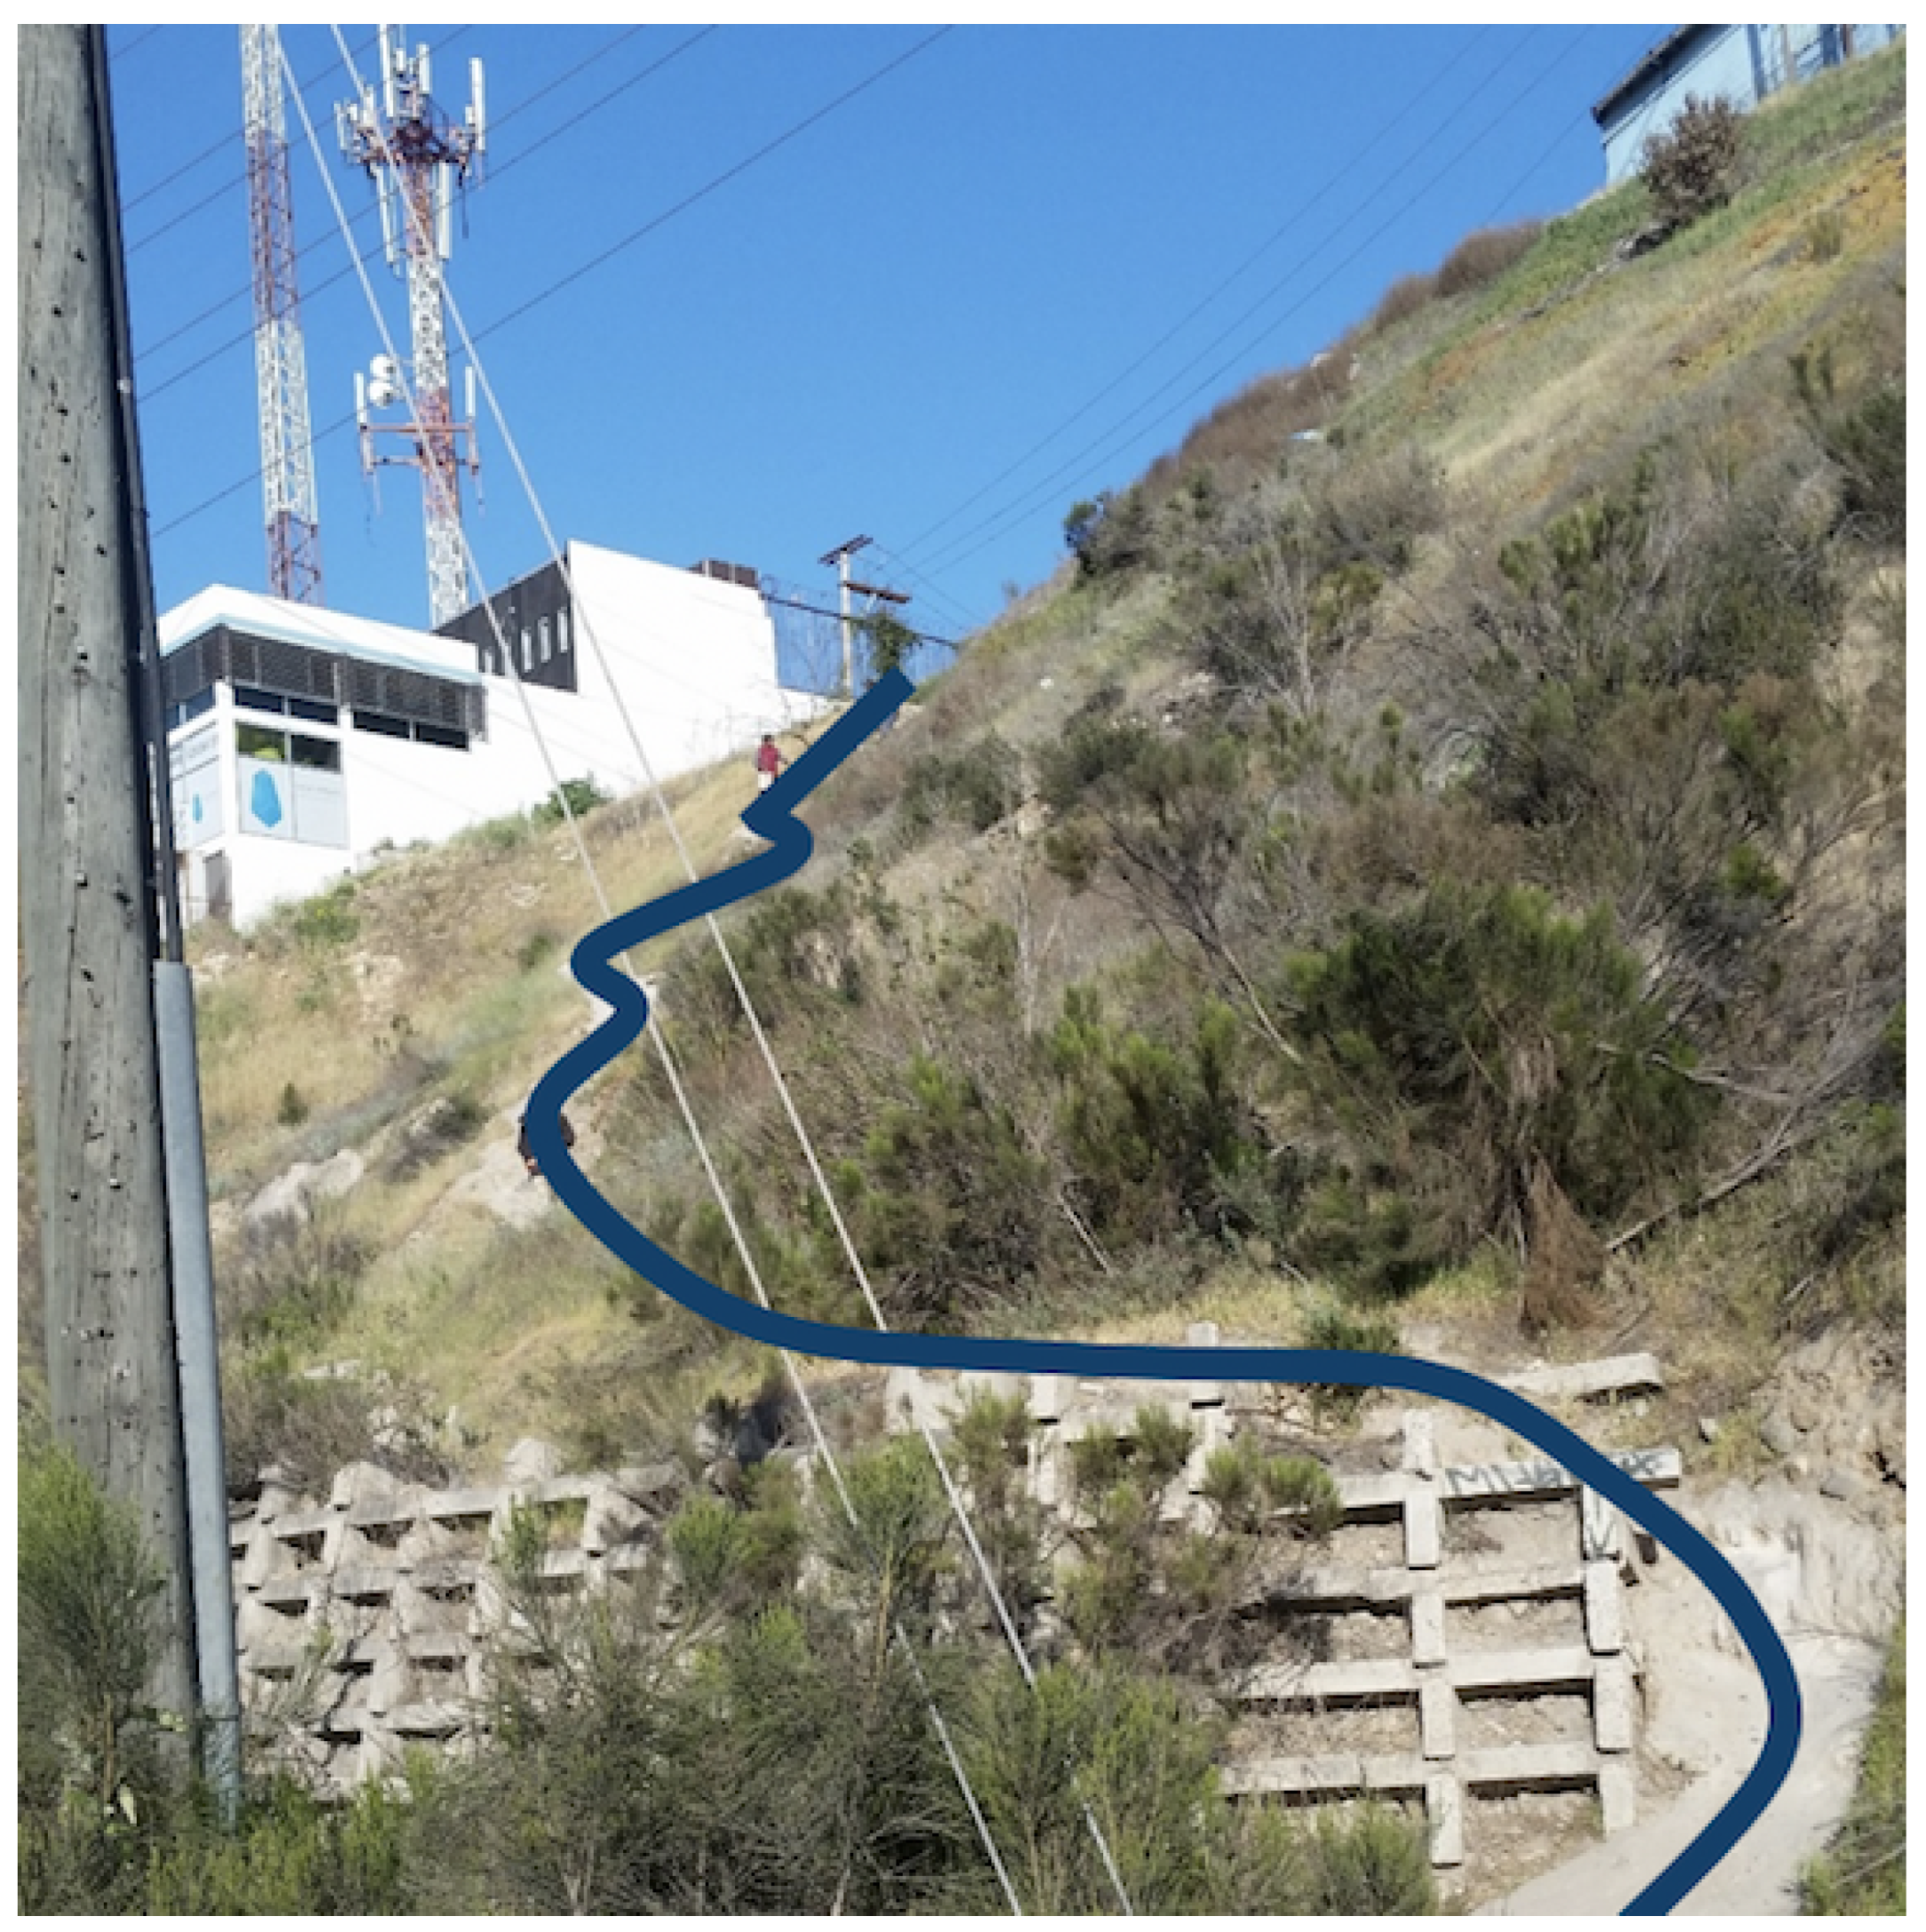
In the case of participants taking a shorter route than those suggested by Google Maps, participants alluded to insider knowledge of the area; for example, the existence of a path or shortcut that has been carved out by the many people who walk by it daily, but that does not exist in the official urban charts. When we talk about a carved out path, it is easy to think of just cutting through a lawn; however, some of these actual paths are much more dangerous (
e.g., Figure 9). In the case of those taking longer routes than the suggested ones, most were attributed to walkability factors, either because the chosen route had pavement or a sidewalk, or often because the traversing hill was less steep (
e.g., Figure 5).
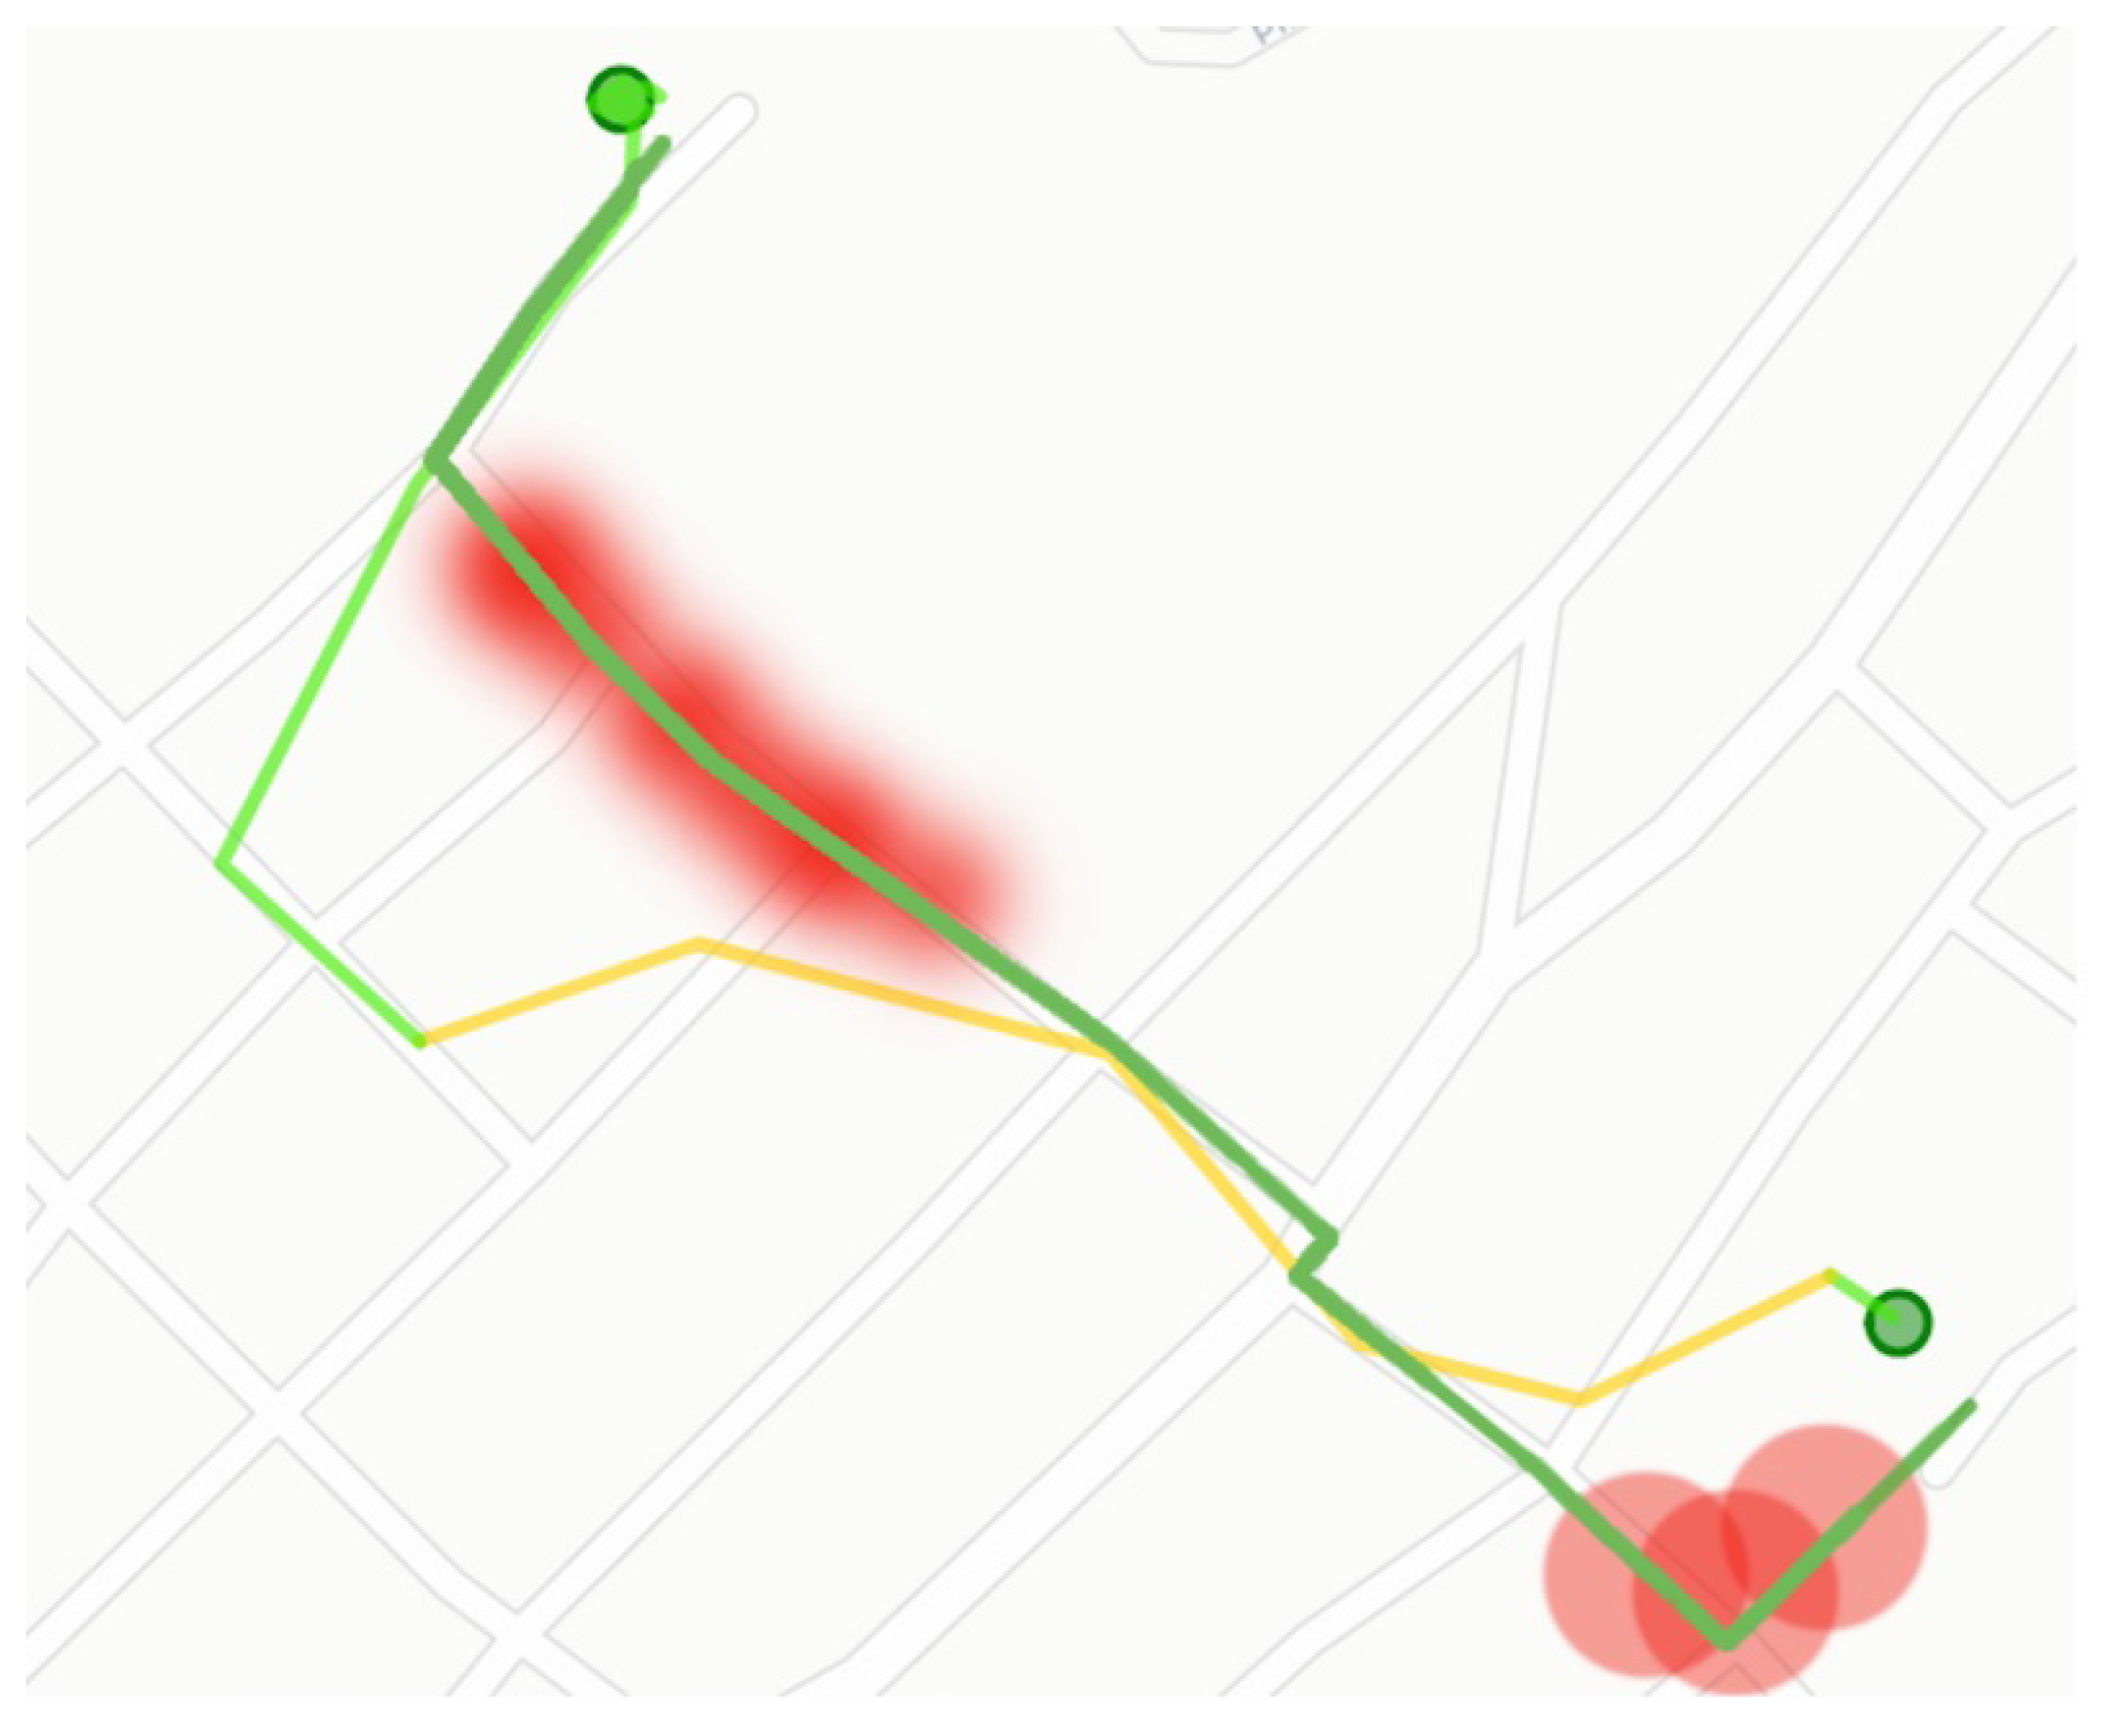
Several participants also stated that avoiding certain spots or zones perceived as insecure was an important factor when deciding which route to take. Furthermore, they detailed that this perception of insecurity can come from the fact that there is a known drug selling point, a place frequented by gangs, a street without lights, a place where landslides occur when it rains, a street with many loose menacing dogs, and other such factors. We collected [
13] this type of geo-located information, and when superimposed on top of some of the routes, they match really well the regions where differences between the suggested and actually taken routes to occur. For instance, in
Figure 10, the red spots indicate zones perceived as insecure; notice how these coincide with the deviations between both routes.
All the local knowledge expressed in the interviews is lacking in current navigation applications. The incorporation of this high-level semantic information into one of these applications would provide more realistic and appropriate route suggestions.
5.2. Criteria for route selection
An important feature of the suggestion system is to allow the user to set specific criteria for route suggestions, similar to options available in other systems such as Google Maps, where a user can set routes to avoid toll roads or highways, for example. We consider the factors that neighbors deemed necessary in the interview, and we incorporate them as criteria for generating routes suggestions. For example, a user might want to avoid certain parts of a route based on the (in)security of the area [
14], the walkability (which we define further on), the closeness to bus routes and many other factors that are not usually considered when calculating routes for users.
The walkability criterion can best be described as a composite attribute that is composed of factors that can either be binary or a spectrum. Some of these factors can be, for example, if a street is paved or not, what the factor of change is in the elevation of the route, and if there is public lighting, among other things. Some of these factors can also be weather and time-dependent. For example, if a street is not paved, it might not pose much trouble to a user; however, if it’s raining that day, taking an unpaved road can result in muddy trouble for the participant. These are all criteria that should be considered when suggesting routes for users.
5.3. GeoLock suggestion app
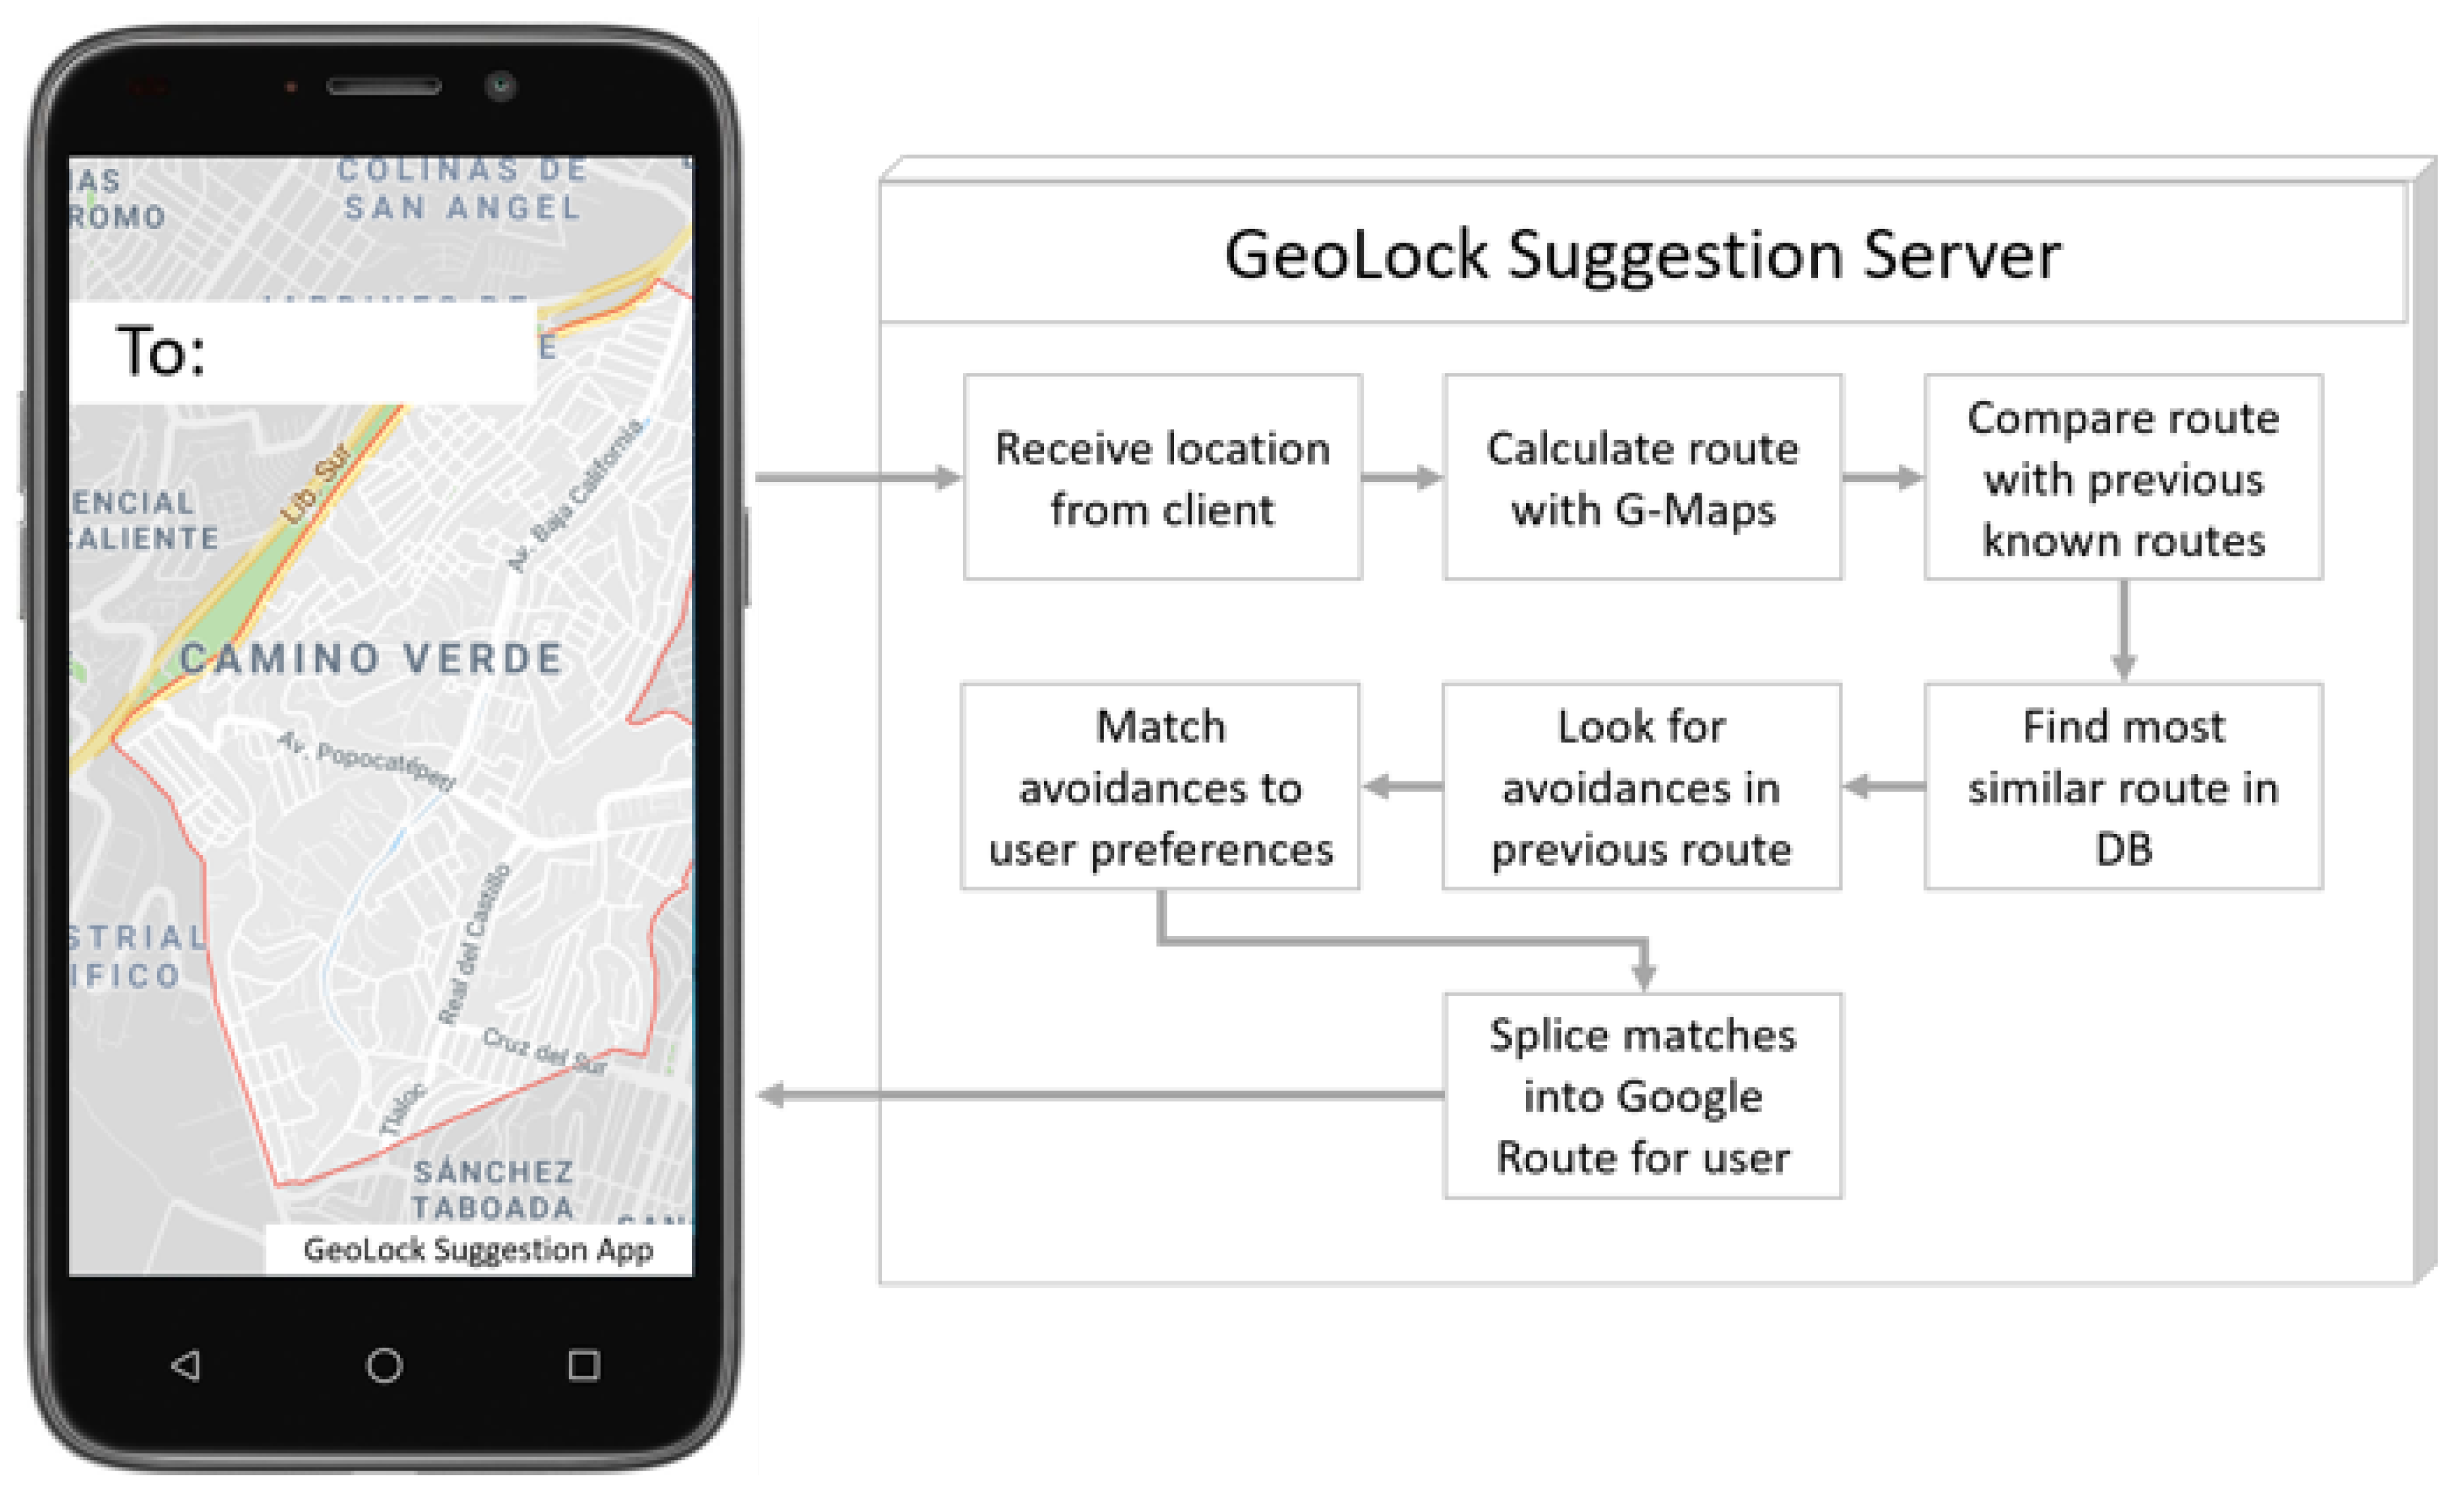
In
Figure 11, we can see an example of a screen of the suggestion app, as well as the flow diagram for its operation. Once a user sets a destination in the GeoLock Suggestions app, an API call is made to the GeoLock Suggestion Server. This API call contains the user’s current location, the destination location, and the user preferences. The location is used to calculate a route using Google Maps routing API; this route is, in theory, the optimal route based on time constraints, as Google Maps usually tries to suggest shortest routes. This route is then compared to previously known routes. For optimizing the previous route lookup, we should be able to filter our database by Country, State, City, the area containing route, and finally, by the center point of the geoid.
Once a similar enough route has been found, this route can be sub-divided and compared to the route suggested by Google to see if there are areas that are different from the one suggested by Google. These areas should be tagged with their scores on our criteria (Walkability, Security, etc.).
6. Conclusions
The geographic environment where urban citizens live affects their subjective well-being [
13]. One aspect of this is how the environment affects their mobility and the decisions they have to make in order to get from one place to another [
15]. We are particularly interested in the most underserved regions of cities, and thus we conducted a study in one of them. We developed a crowdsourcing system with backend servers and frontend mobile devices for this study; the design rationale for the system was based on a contextual study with members of the community. We conducted a crowdsourcing campaign where residents of the Camino Verde community carried the device along with their daily activities, in order to track their daily mobility. This was an observational study, where the goal was to observe the mobility of residents. The results showed that the routes they take differ very often from the routes suggested by applications such as Google Maps. Additional knowledge about the area, obtained from neighbors who live there, helped in understanding how environmental factors affect their mobility decisions. As a consequence of these findings, we are currently working on a system that incorporates this local knowledge to suggest more appropriate routes.

