1. Introduction
In domestic settings, speech interaction is becoming popular due to the appearance of virtual agents accessible through affordable smart speakers and central units, such as Alexa/Amazon Echo, Google Home and Siri. However, there exist many challenges related to the use of these devices [
1,
2]. On the one hand, the intelligibility of the user spoken input is affected by environmental noise, the distance and the position of the user with respect to the device, and obstacles that attenuate the audio signal [
3]. When several devices are present in the environment, it is necessary to orchestrate them, as they may be activated simultaneously, process the signal separately and lead to potentially erroneous interpretations, as they are not aware that there exist other devices that may produce a better recognition result [
4], as well as generate redundant, overlapping or conflicting actions or responses. However, smart assistants are generally designed as stand-alone devices that process the voice commands of the users and act upon the environment autonomously [
5], sometimes activating other connected devices [
6], but which are not aware of or coordinated with other similar speech processing units.
This paper presents a proposal for the coordination of voice-responsive devices in ambient intelligence environments by means of a mechanism based on the ranking of multiple audio sources. The main objective is that all recordings coming from all the devices in the environment are used and the most precise interpretations are ranked first in order to select a single interpretation of the user input. In order to do so, we consider the signal recorded by each device and prioritize the hypotheses generated according to the quality of the acoustic signal received (in terms of loudness, energy, noise, and duration) and the confidence scores generated during speech recognition. Thus, our proposal is independent of the number and type of devices that populate the environment and their location.
The rest of this paper is organized as follows.
Section 2 presents related work.
Section 3 defines the proposed coordination procedure.
Section 4 describes the experimental set up, including a description of the scenario and the audio sources used.
Section 5 discusses the evaluation results and
Section 6 presents the conclusions and future work guidelines.
2. Related Work
Ambient intelligence systems usually comprise a diversity of sensors and devices to collect data and produce changes within the environment. However, when they provide the possibility for speech-based interaction, they usually rely on a single device for capturing the user’s voice commands.
Currently, there are different projects and studies proposing new approaches for ambient intelligence coordinating multiple sensors and devices. These projects present scenarios where users coexist with actuators and receivers of information, but the oral interaction takes place in a usual way, using a single speaking device [
5,
6,
7].
Incorporating multiple voice processing devices or microphones makes it possible to obtain better accuracy in the recognition, as it should be possible to select the one that has a better quality [
8]. In order to do that, it is necessary to compute quality, providing as much flexibility as possible. For example, it would be possible to use the distance of the microphone to the user to compute quality, e.g., considering that the recording from a microphone that is nearer to the user should be given preference compared to the one from another one that is more distant. However, this is not always the case, as the location and the orientation of the user with respect to the microphone (e.g., whether he is talking in the direction to the microphone or backwards) is also relevant and it would also be necessary to know the position of the microphone beforehand, which would make the setting less realistic. In order to avoid these drawbacks, we have established a mechanism that is based on acoustic and speech recognition parameters that can be computed from the acoustic signals without the need of additional information about the environment.
On the other hand, there are some approaches [
8] that propose techniques to analyze and select the best audio source from an environment with multiple microphones. Additionally, projects like [
9] show how useful it is to combine several audio signals in order to produce a clearer speech-to-text transcription with multiple sources. However, although these previous projects prove the utility of using several recording devices instead of the traditional single microphone setup, they are not directly addressing how to apply this advantage in smart environments. Our approach presents how to pool multiple audio signals, scoring the audio streams from distributed devices in the same environment depending on their quality.
There also exist studies that present mechanisms to complement the oral interaction with other non-oral sources [
10,
11,
12,
13] and also describe some of the challenges of coordinating several speaking objects [
4].
In the absence of studies that cover the main topic of this article, we aim to address several of the challenges outlined in [
4], advancing a step further to offer an approach that gives support to the coordination of different distributed audio sources in an environment. With this aim, we propose to solve the overlapping and coordination challenges, polling and ranking several voice signals from multiple devices.
3. Coordination of Multisource Speech Recognition Results
In order to recognize and react upon voice commands in intelligent environments, it is required to connect devices with the capability to listen and respond to them. When these devices are activated, e.g., with a wake-up keyword (e.g., ‘Alexa’ or ‘Hey Google’), they convert the audio stream into text (speech recognition), interpret its meaning and produce a response or execute an action.
In this paper, we propose a new approach for selecting the most reliable speech recognition result in speech-based interaction for ambient intelligence, ranking the inputs from multiple devices located in the environment. The ranking is computed on the basis of an estimation of the reliability of the audio streams captured and the quality of the speech recognition results. This process can be carried out in a decentralized manner, in which each device captures the audio signal, broadcasts it and generates a ranking, or it can be performed by a central device that receives all audio streams and then ranks them.
In the following section, we divide the presentation of the approach into two stages: (i) voice signal quality scoring, and (ii) speech-to-text quality scoring. In the first step, we estimate the quality of the signal obtained by each device considering different audio features. In the second step, we perform speech recognition for each audio and obtain an estimation of the quality of the recognition hypotheses. Both quality scores are aggregated to produce a ranking of all audio sources and select the best positioned as the input of the system.
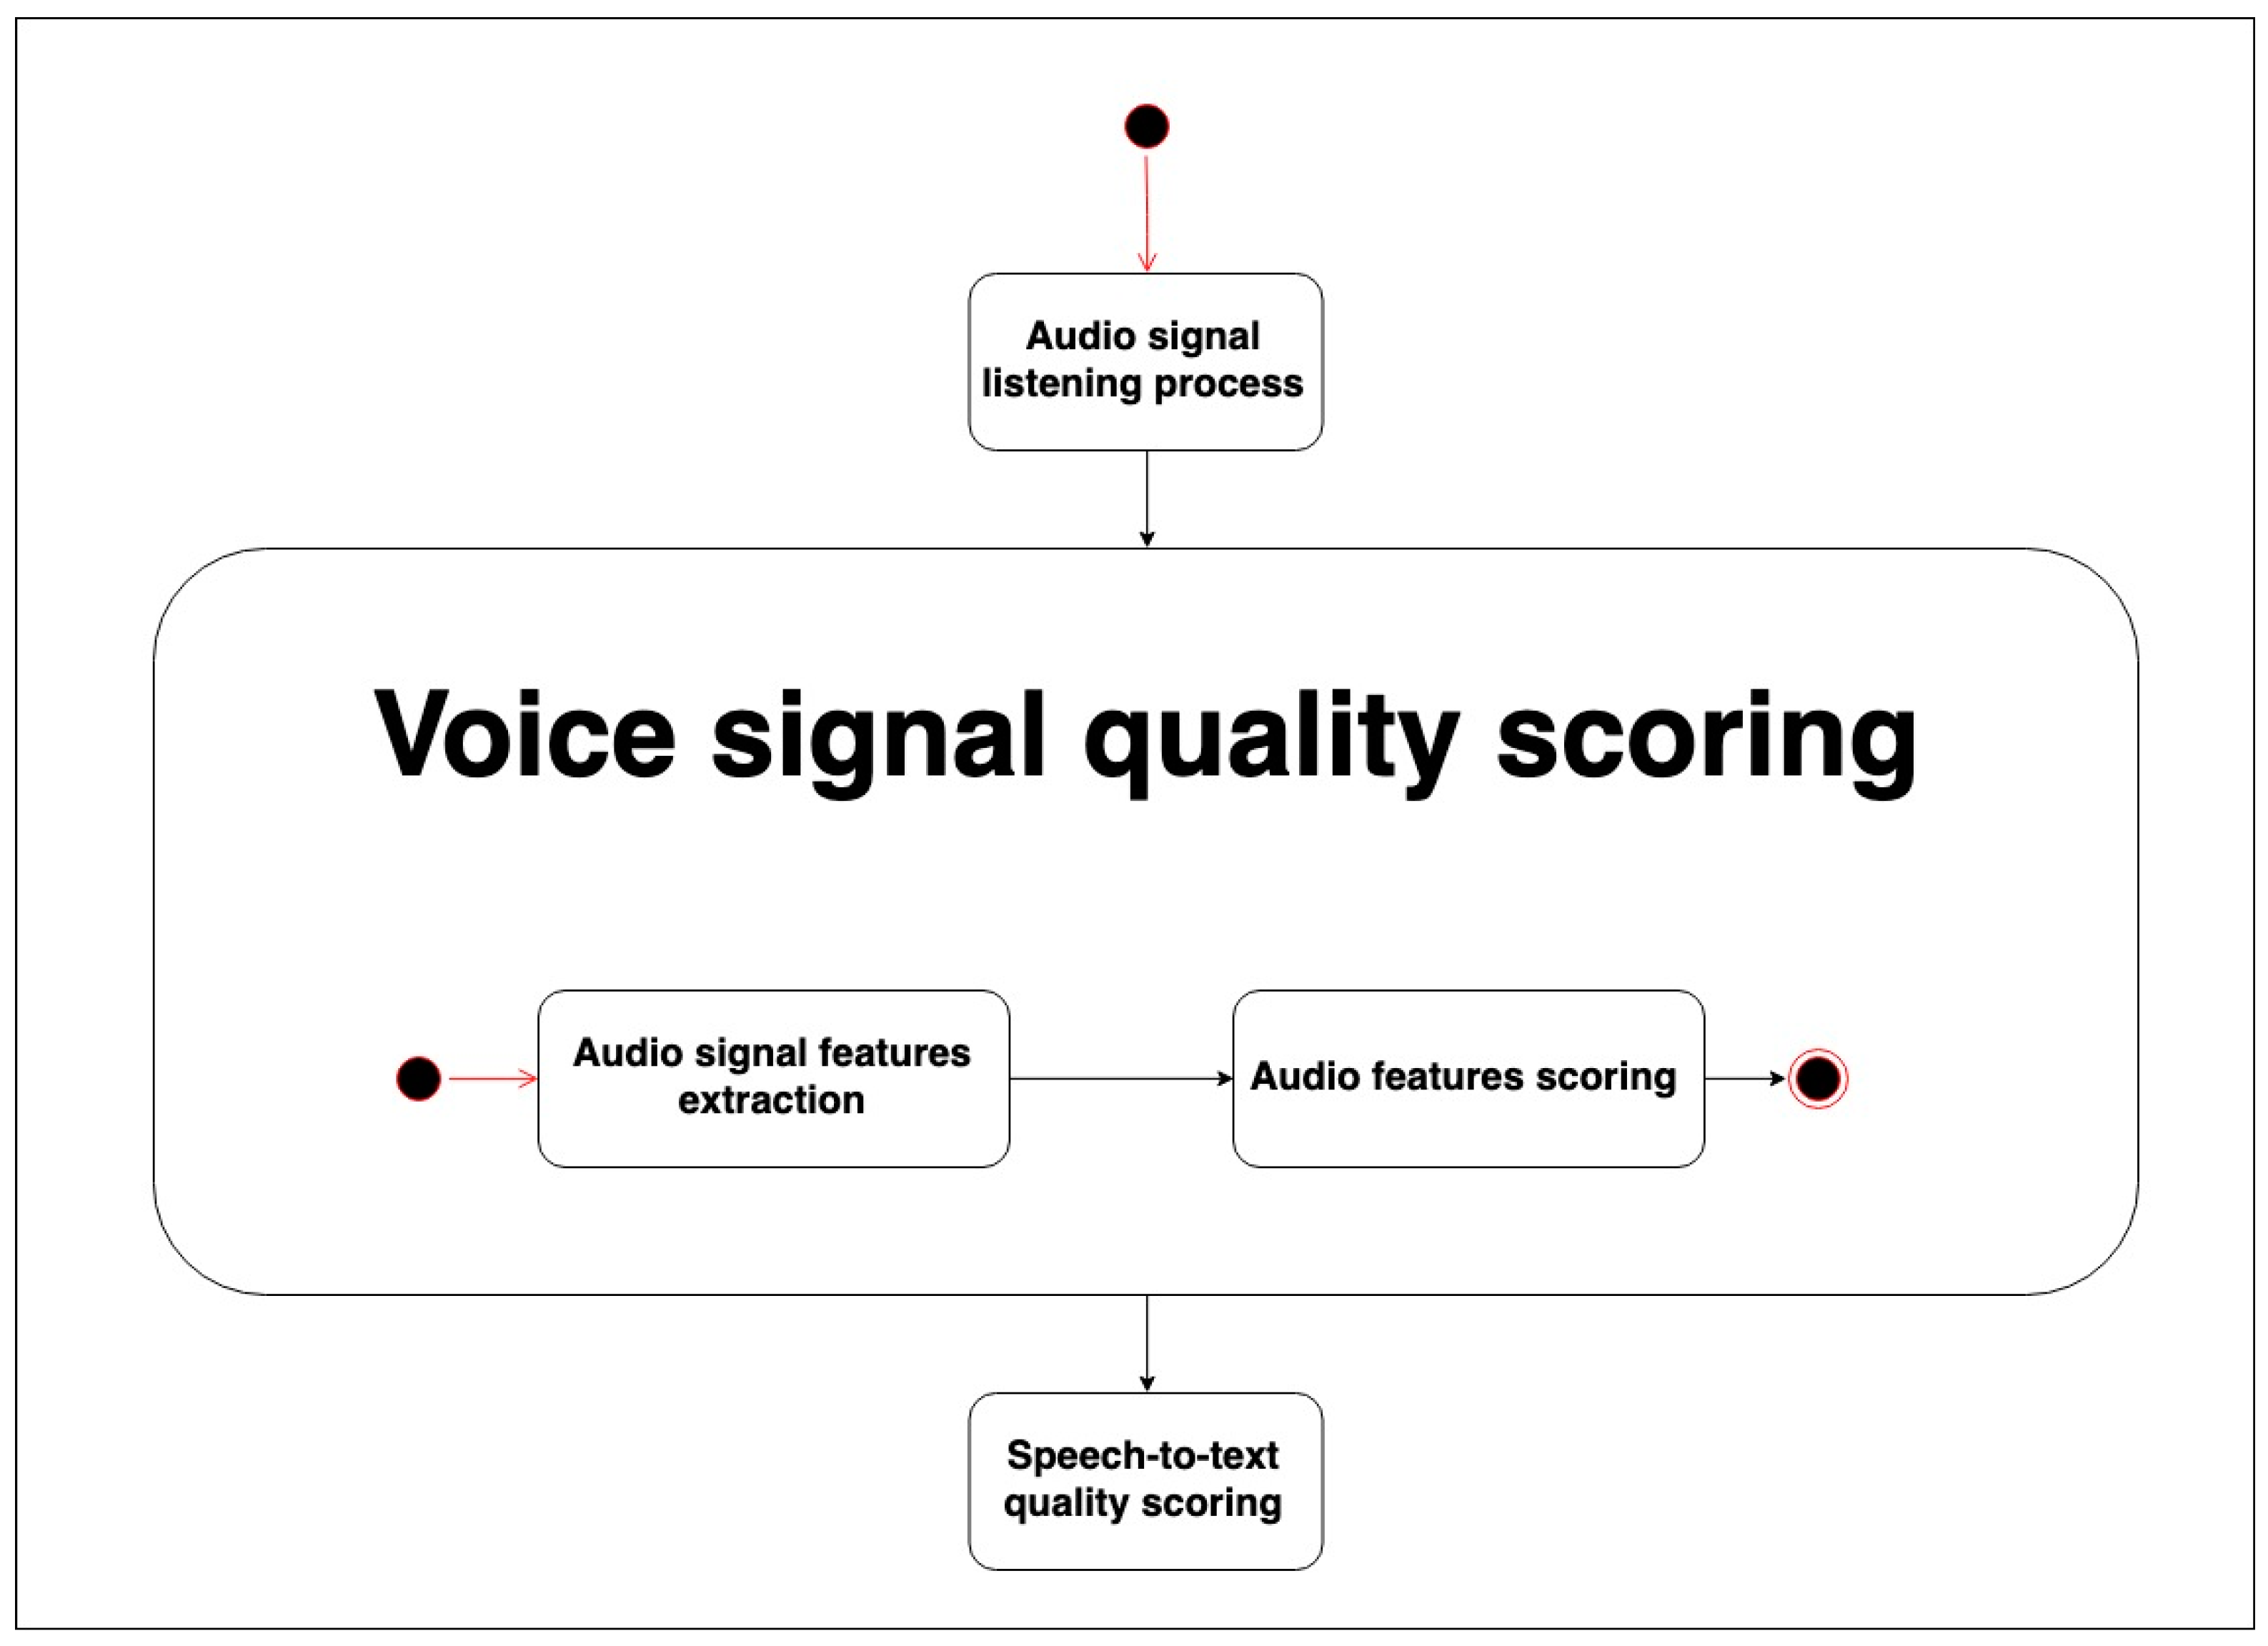
3.1. Voice Signal Quality Scoring
Figure 1 presents a process model of the steps proposed for producing a score that corresponds to an estimation of the quality of the voice signal. Firstly, the device must process the signal (‘Audio signal features extraction’), obtaining the relevant features to be used to estimate the quality, for which we compute the average, maximum and minimum values, and compute the score (‘Audio features scoring’).
3.1.1. Audio Signal Features Extraction
In this step, the audio that each device has captured is processed in order to extract different properties of the audio signal to measure its quality. In order to accomplish this, the audio signal must be divided into frames. Each frame contains information about the different properties of the sound perceived at that particular moment. A frame is composed of a number of samples depending on how many channels the audio signal has. If there is only one channel in the audio (mono sound), a frame is simply a single sample; however, if the audio is stereo, each frame consists of two samples. Every frame is recorded depending on the rate (bit/second) of the audio recorded. The sound rate controls how often the current frame is replaced. For example, a rate of 8000 Hz means that a new frame is played or captured 8000 times per second. The size of the frame can vary depending on how the audio was recorded. In order to identify the best audio signal recorded, we should measure the main audio features by analyzing each frame of the audio. We have focused on the following features:
Loudness: Loudness is the subjective intensity of a sound, and is related to its pressure level, frequency and duration. Thus, loudness refers to how loud or low a sound seems to a listener and is determined by the intensity or the amount of energy in sound waves and measured in decibels (dB) [
14].
Signal Energy: Energy is useful to distinguish silent and voiced segments in the voice signal, as energy increases with sound.
Peaks (noise): A peak is the maximum value reached by the sound pressure. It usually corresponds to the perceived loudness of a particular signal, but mainly describes the maximum values of the amplitude during the sound signal.
Duration: The duration corresponds to the time that the vibrations produced by a sound are maintained.
3.1.2. Audio Features Processing and Scoring
Once we have obtained all the relevant features from the audio signal, we proceed to score the different sources with the aim of assigning higher scores to the signals that have higher quality and therefore are more likely to be correctly interpreted.
The scoring process designed is based on providing unique values or scores to each source. If there are n sources, each of them is ranked according to the four dimensions considered above (loudness, energy, noise and duration). For each dimension, the best source will be assigned the value n, the second one a value of n − 1, etc. Thus, the maximum general score attainable for a source is 4n (scoring n across the four dimensions).
For each dimension, the score is assigned as follows:
Loudness: If a signal has a higher average loudness, it may mean that the source that produces that sound is closer to the device and therefore this signal is more reliable. Therefore, the audio signal that achieves the highest average loudness will obtain the maximum score.
Signal Energy: If the signal has a higher average of energy it may mean that there are not very long silent segments in the signal and therefore the audio may correspond to a command since it indicates that this audio contains a concatenated sequence of words. Consequently, the audio signal that achieves the highest average of energy will obtain the maximum score.
Peaks (noise): When the variance in the peaks of a particular signal is very different from the average variance of the other signals acquired in the environment, it can indicate that it may be complicated to differentiate the different phonemes in that content [
15]. For that reason, the audio getting the highest score will be the one with the lowest peak average and the closest compared with the average of all the other audios.
Duration: Finally, with this property, we want to detect whether the signal was too low and just detected a few words, but not all the content of the voice command, and also the reverse case when the signal has recognized more words by mistake compared with the real voice commands. Consequently, the signal obtaining the maximum score will be the one with the closest duration to the most representative value, obtained by comparing the interquartile range of all signal durations.
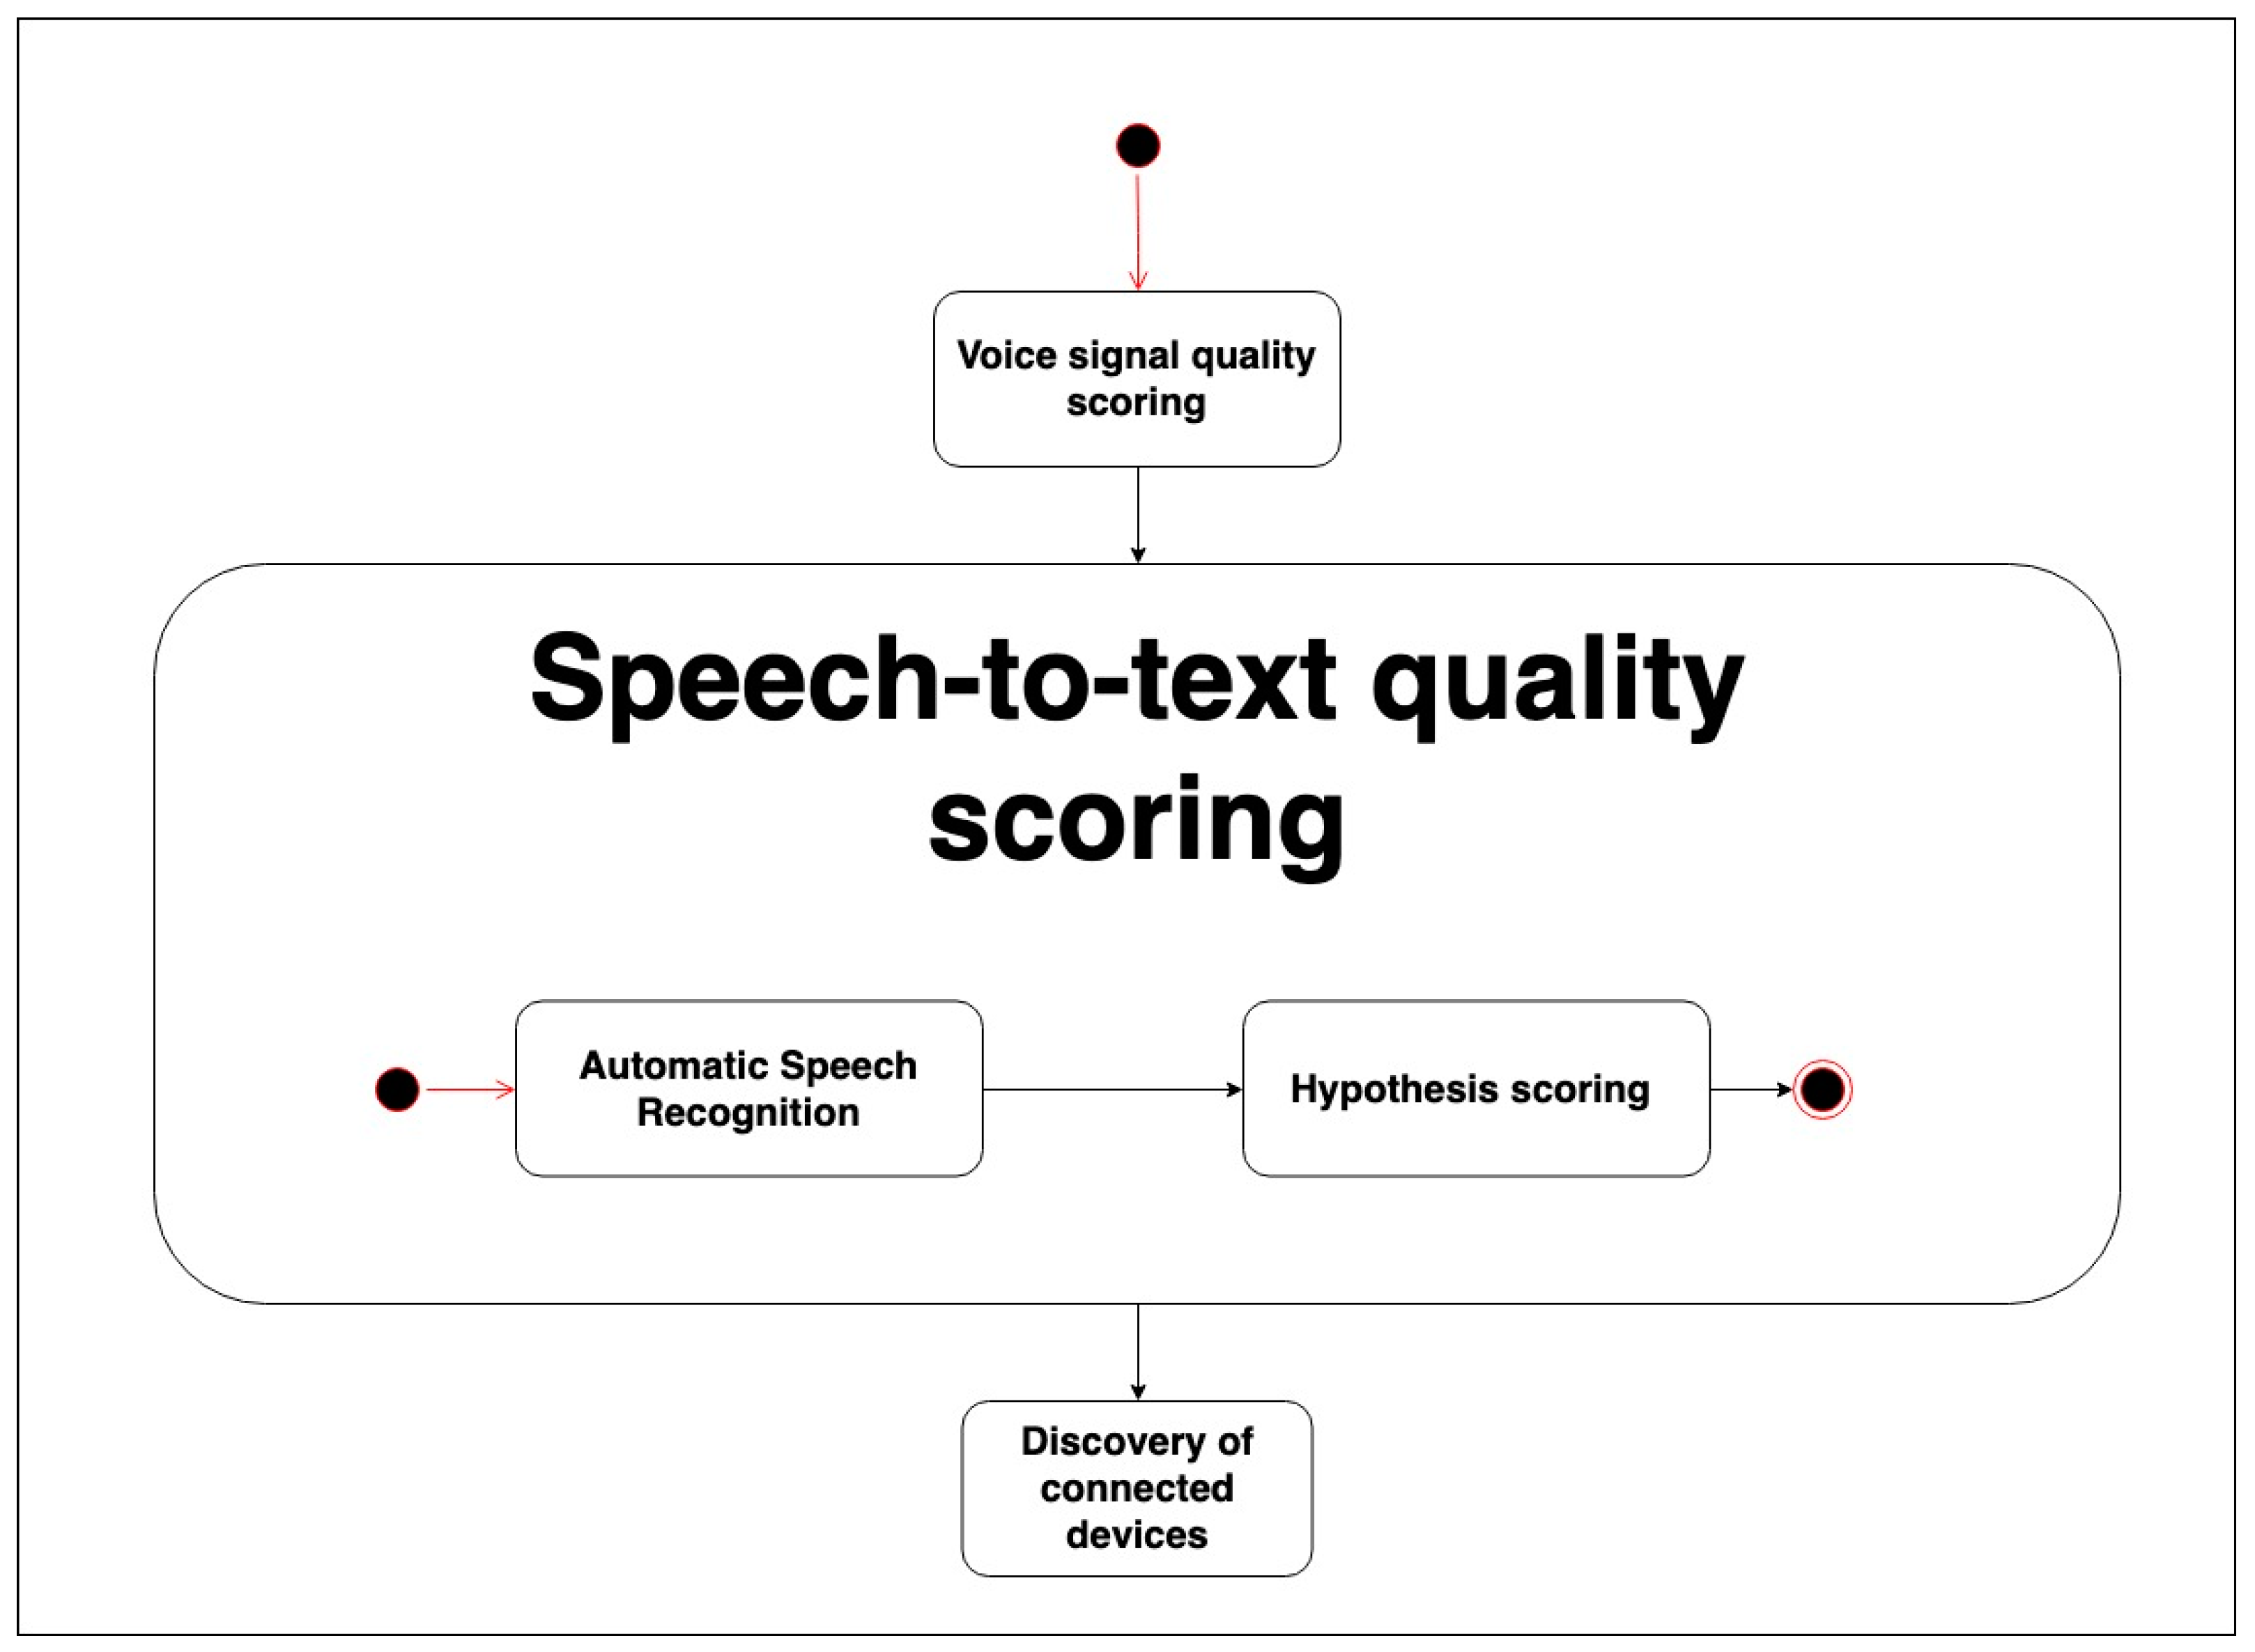
3.2. Speech-to-Text Quality Scoring Process
In this stage (see
Figure 2), the audio signal is processed by an Automatic Speech Recognition (ASR) software (‘Automatic Speech Recognition’) that takes the signal as the input and produces a list of the best recognition hypotheses and their confidence values. Our approach is independent of the ASR software employed, and also of whether disparate ASR systems are used to process the acoustic inputs in different devices. Finally, all these extracted data are processed, compared and scored in the (‘hypothesis scoring’) process.
3.3. Hypothesis Scoring Process
In this step, we assign scores, again considering a score scale with unique values across several dimensions using the following criteria:
General confidence value. The general confidence value indicates with what probability all the words in the hypothesis have been correctly recognized in an interval from 0 (worst case) to 1 (best case). Therefore, in this case, the signal that contains the highest general confidence value will presumably be the closest option to be correct and therefore will obtain the maximum score.
Minimum confidence value in a recognized word. In this case, all the confidence values of the identified words are compared, locating the words that contribute the lowest values to the hypothesis they belong to. This may indicate that although the speech recognition system may have assigned a high confidence to a particular hypothesis, if any of the words included in it have a very low confidence value, it is very likely that this hypothesis is not completely correct.
Length. With this property, we want to detect whether the hypothesis correspond to only part of the voice command (only detected a few words) or, conversely, when the signal was longer and for that reason, the ASR produced a longer hypothesis with too many words. Consequently, the best hypothesis will be the one with the closest length of words compared with the interquartile range of the other hypotheses.
4. Experimental Setup
In order to evaluate our proposal, we have performed a validation process to check whether the approach produces effective rankings, reducing the error rates when compared to when the ASR is performed by a single device regardless of its location.
In order to perform and validate the implementation of the described procedure, we have defined a scenario that represents in the most general way the situations where a user would communicate with an environment with several listening devices. This way, we only take into account a constraint, i.e., that the scenario presents different sources of audio reception (at least two), whereas other factors can vary, including (1) the number of devices, (2) the quality of the microphones, (3) their location in the environment and (4) the speech recognizer used.
4.1. Description of the Scenario
We have tested our approach with the Distant-speech Interaction for Robust Home Applications (DIRHA) corpus [
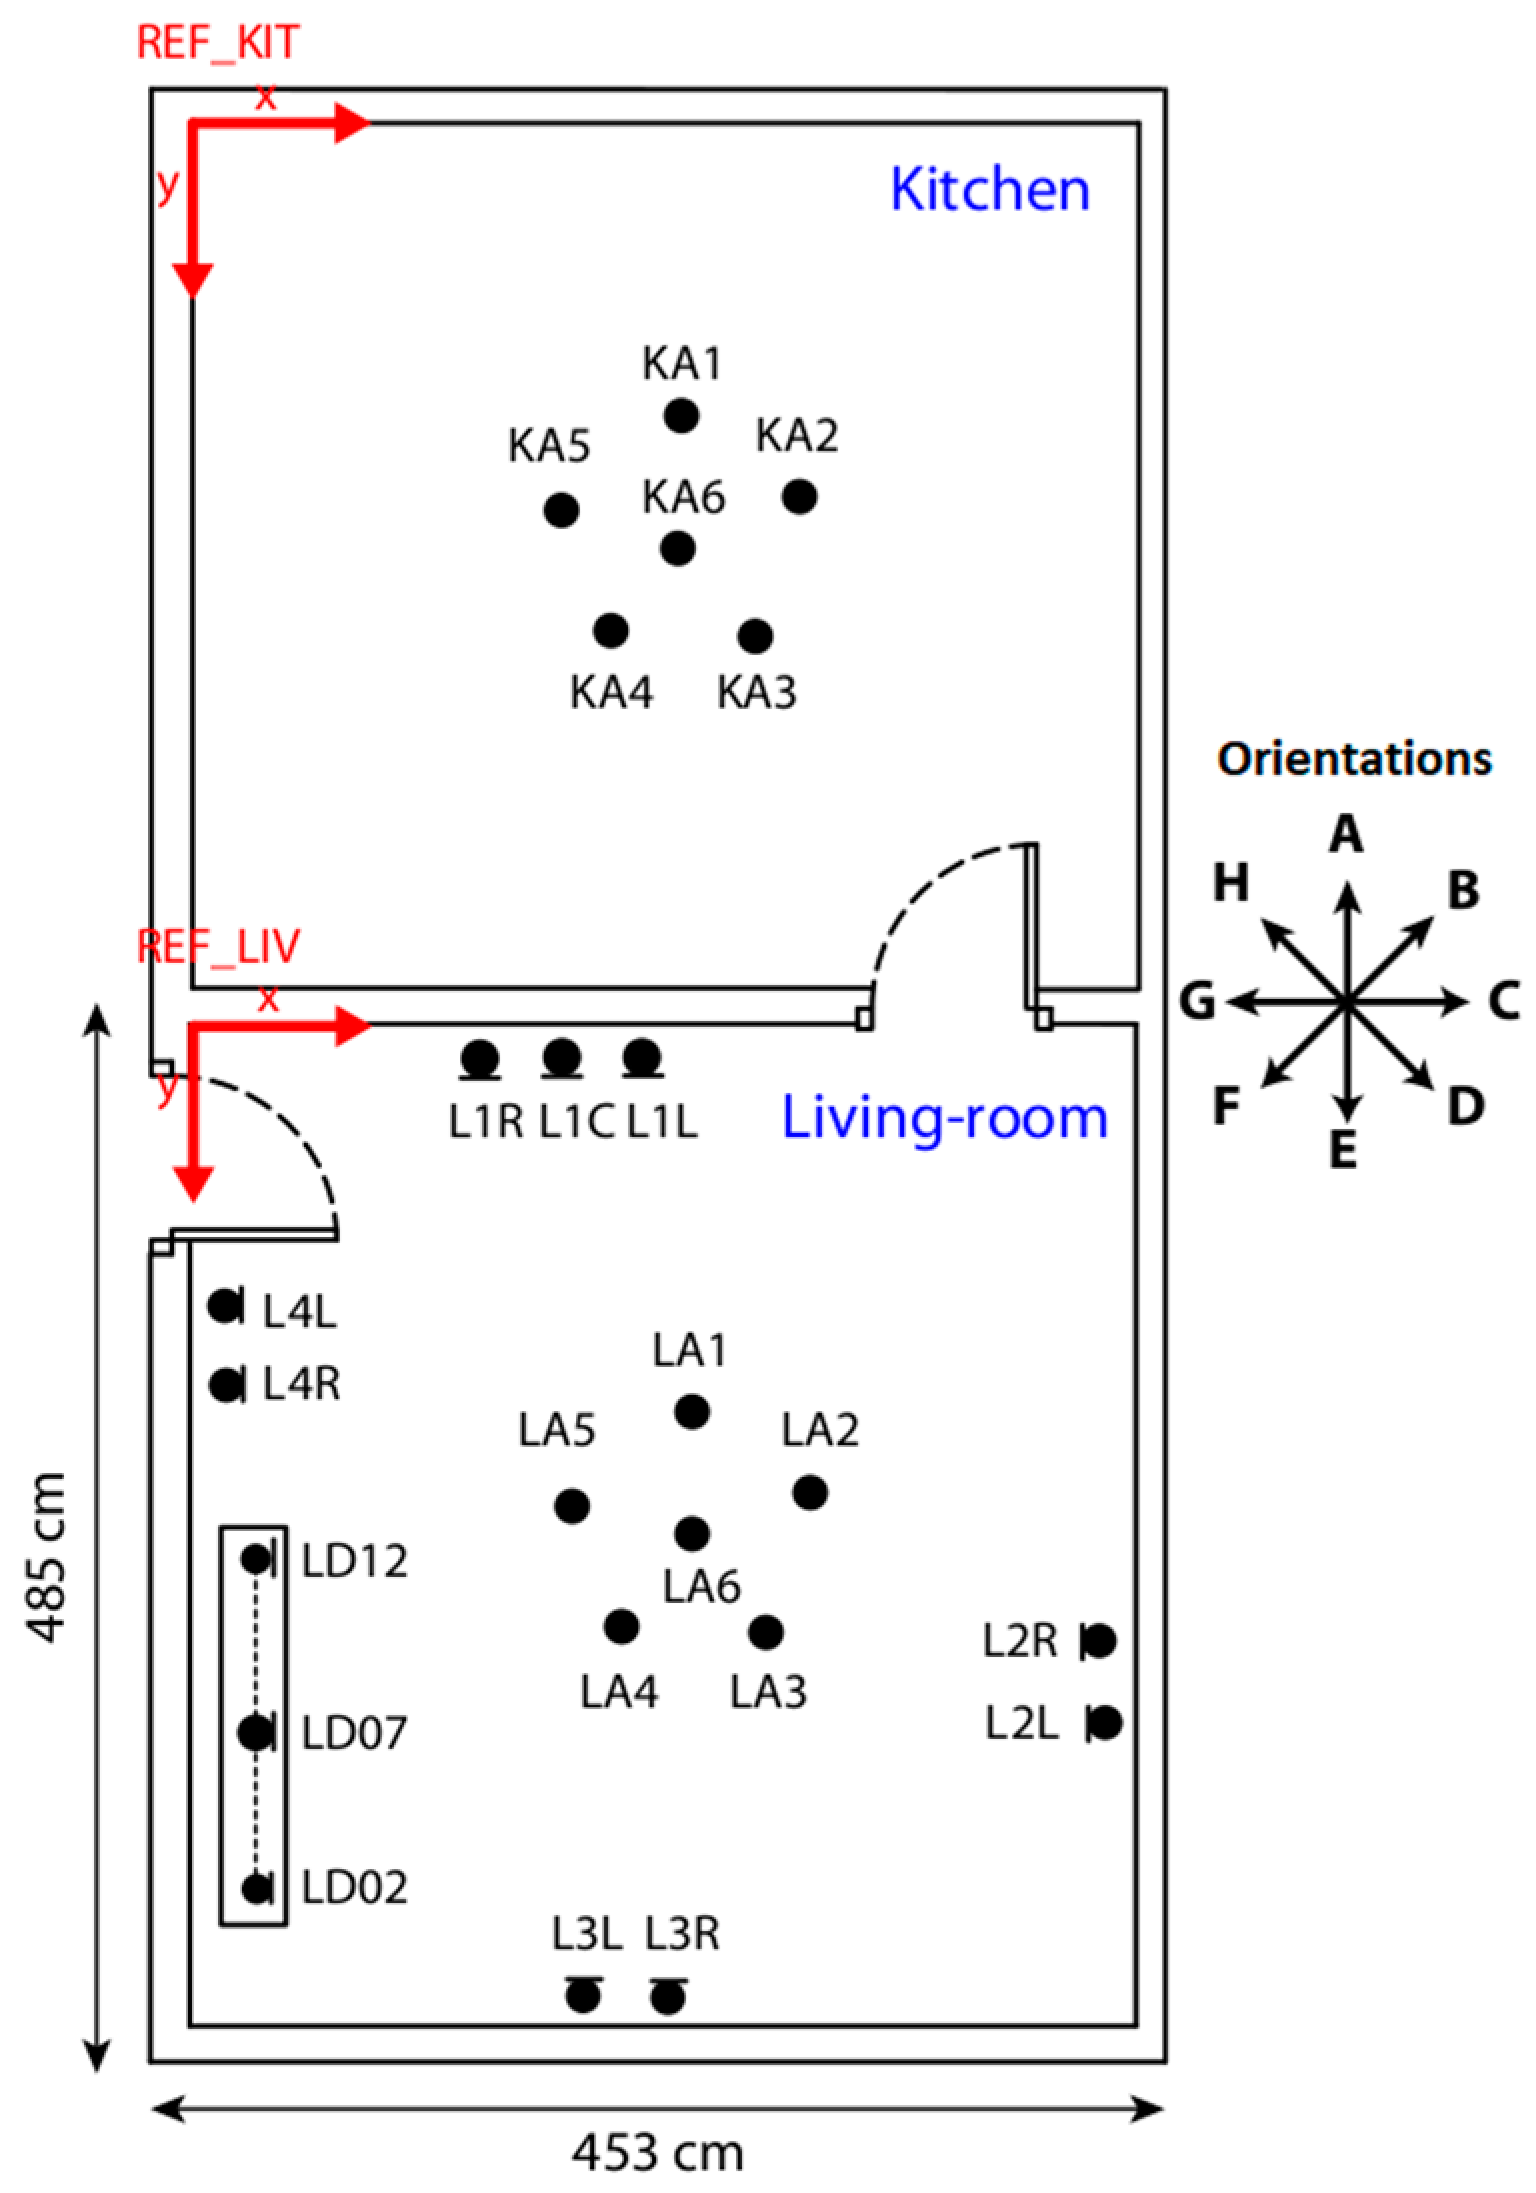
16], released to the research community by the DIRHA research project, which focused on the development of voice-enabled automated home environments. The corpus is comprised of recordings based on distant-speech interaction. In the corpus, different microphones were installed in different rooms and the resulting multi-channel audio recordings captured multiple audio events, including voice commands or spontaneous speech, and a variable amount of reverberation and background noise. The corpus comprises 192 audio signals corresponding to different phrases recorded in the setting depicted in
Figure 3, where numerous microphones were placed in several points of two adjoining rooms.
For each audio signal, this corpus provides files with information about the original sentence pronounced, and all the audio recorded for each microphone according to a single sentence.
This scenario consists of two rooms in which microphones are placed labeled with an ID and with information about its exact location. These microphones are placed in different locations within both rooms. The rooms are separated by a wall and a door communicates them. The first room is a furnished ‘living room’ that has 18 microphones, and the second room is a ‘kitchen’ with 6 microphones.
4.2. Description of the Validation Process
The validation process has considered the DIRHA audio corpus composed of audios and the textual interpretations that have been pronounced and recorded by several audio sources located in the scenario described in
Section 4.1.
For
voice signal quality scoring (
Section 3.1) we have implemented a script with which to analyze the audio sources extracting all the audio features to perform the proposed quality analysis. We have processed all audios in the corpus using OpenSmile [
16], a specialized software to analyze audio speech parameters. This library allows defining a configuration file that contains all the parameters and features to be extracted from the audios as explained in
Section 3.1.
After that, for
speech-to-text quality scoring (
Section 3.2) we used the Google Cloud speech-to-text speech [
17] recognition engine to extract the textual interpretation.
Once the information from the audio stream was extracted, we applied the scoring procedure explained in
Section 3 using the implemented script. The script performed the calculation of the scores for each audio and its interpretation according to the parameters described in
Section 3 producing a list with the n-best signals.
Afterwards, we compared the list of the scores and the hypotheses produced with the reference texts used to record the DIRHA corpus. With this comparison, we could identify whether each input source derived in a text hypothesis matching the text pronounced by the user in the audio. Additionally, we calculated the average Word Error Rate (WER) for each sample.
This way, we could determine when a specific microphone recorded an audio that could not be transcribed to text correctly, producing a hypothesis that differs to what the user said. In order to test our procedure, we compared these results with the list produced by our script, checking whether high scored inputs correspond with microphones that obtained good results.
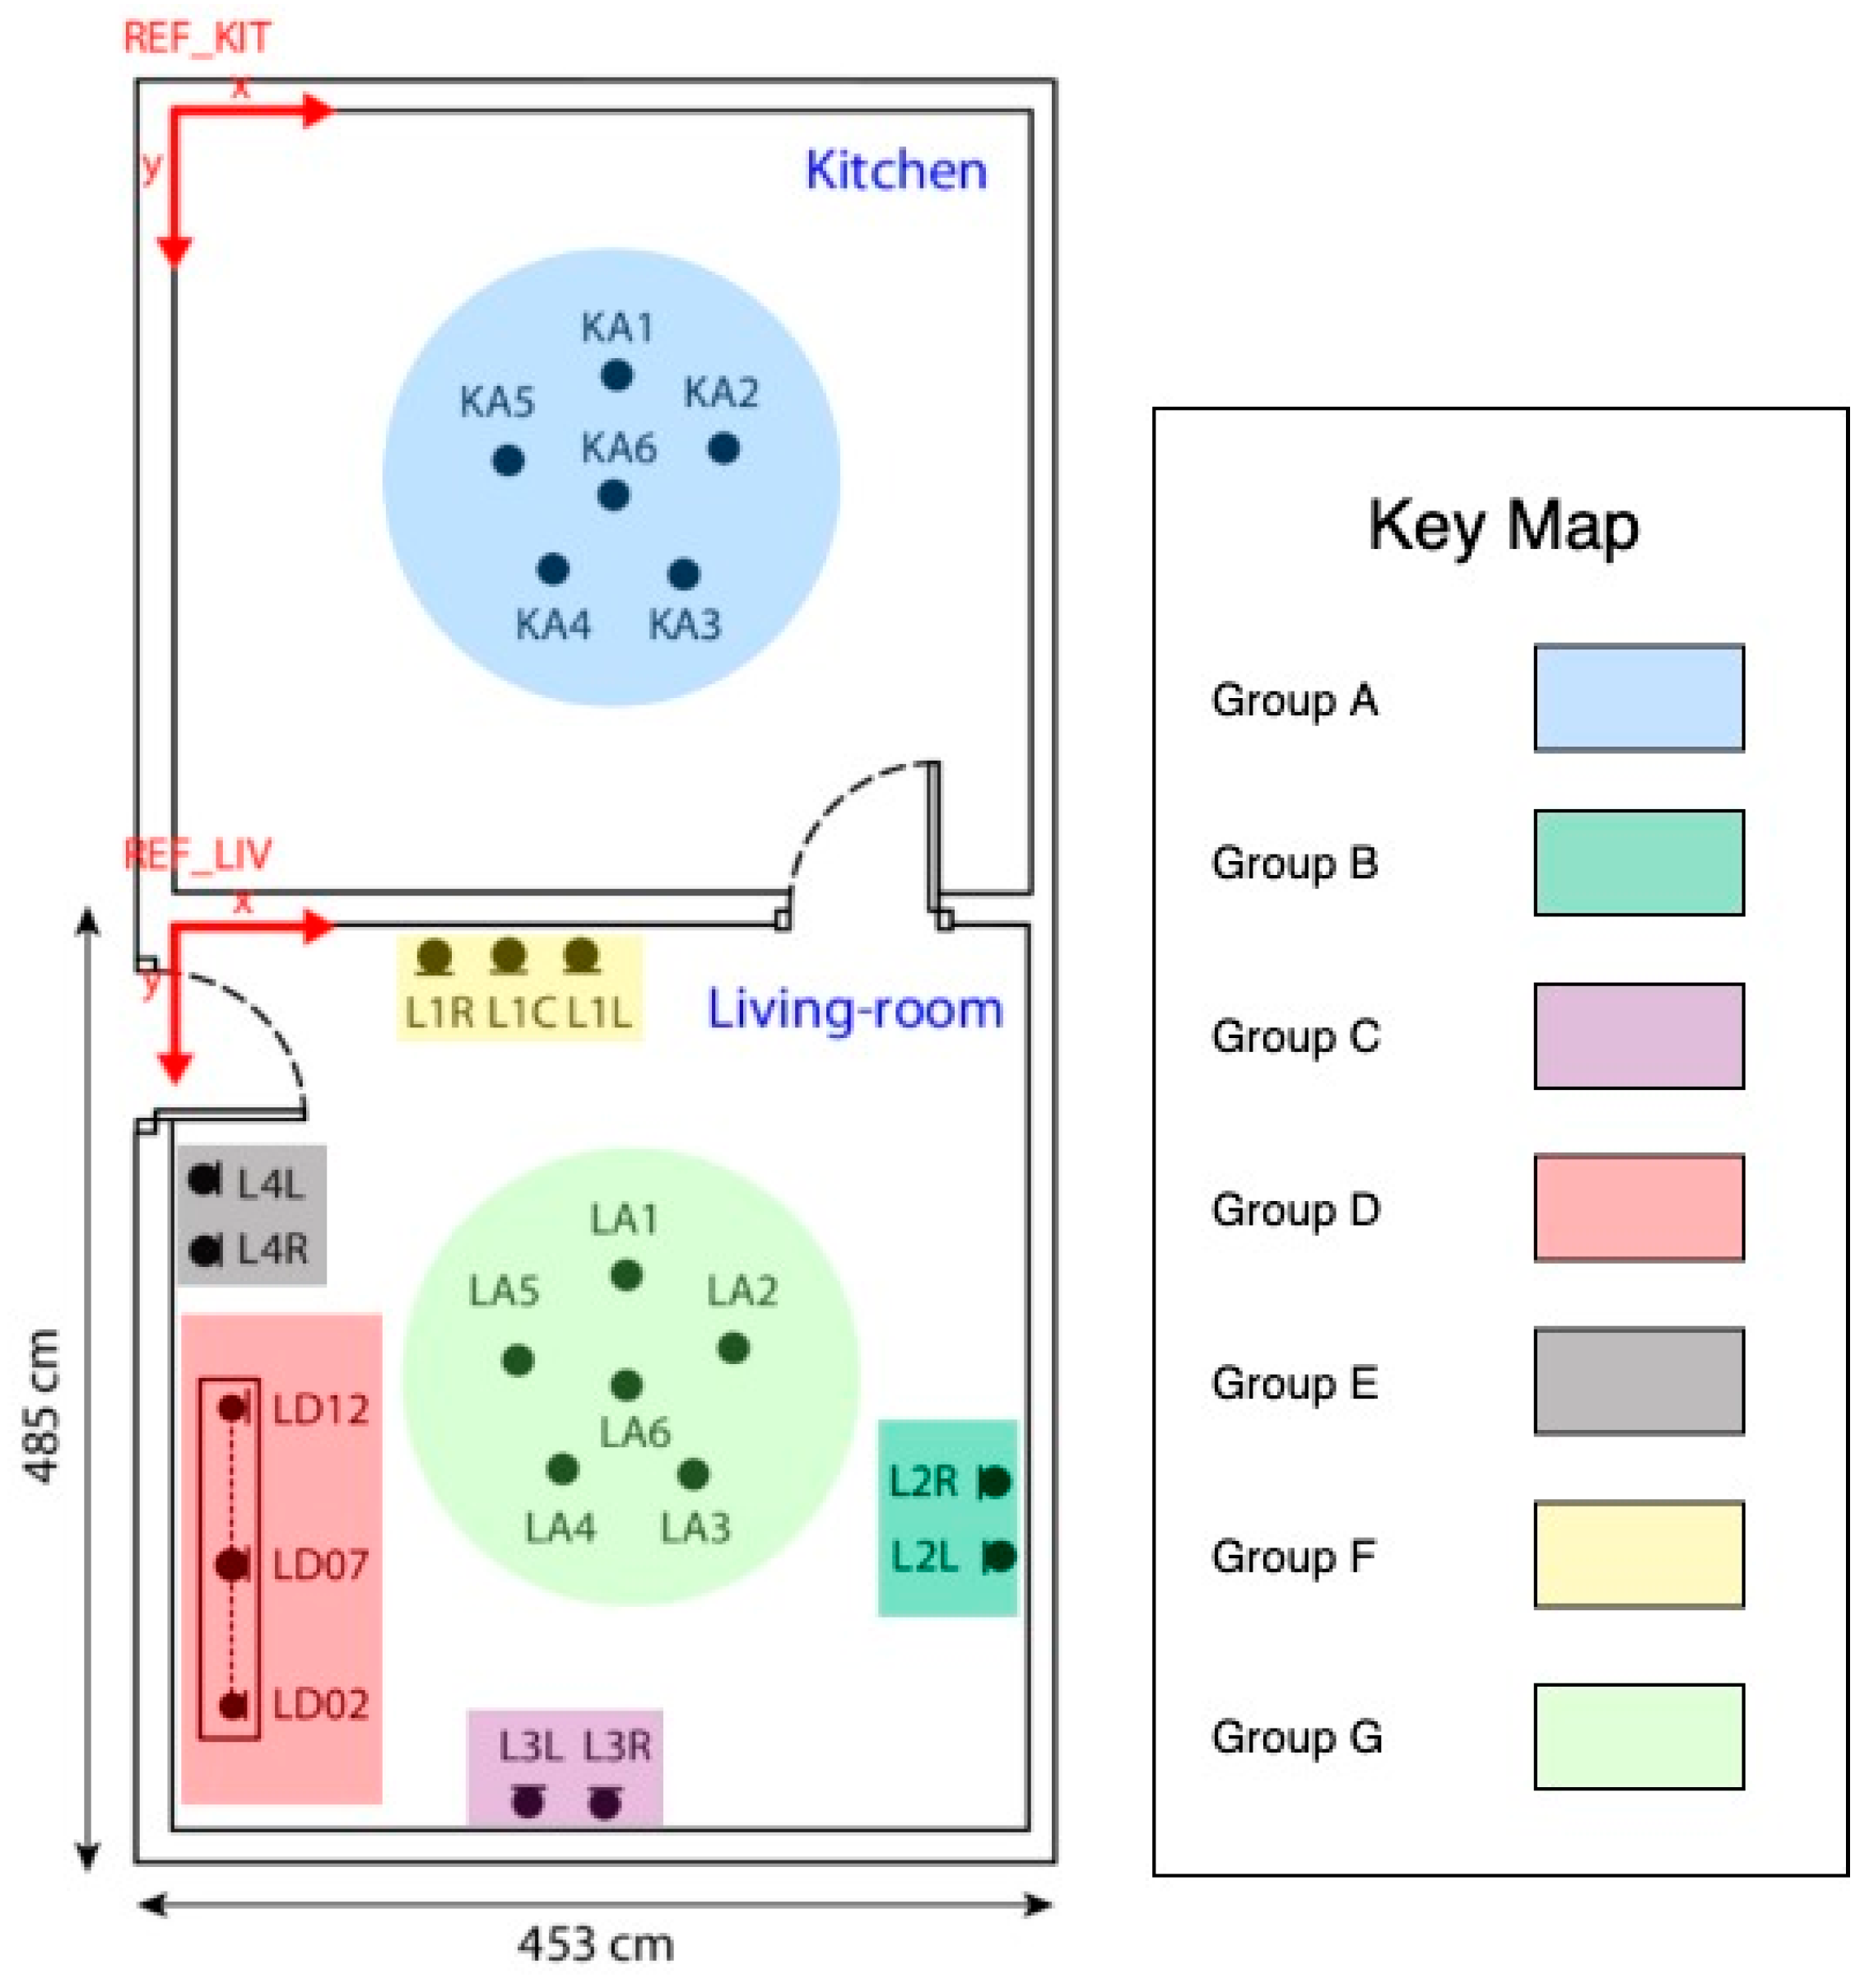
Our baseline is the result of each isolated microphone. Then, we analyze the scenario that includes multiple sources obtained from microphone groups. In order to validate our proposal with different numbers of microphones and microphone locations, we have created groups of microphones as described in
Figure 4. As the groups had to encompass audios of heterogeneous quality, we previously identified the microphones that produced recognition errors. A recognition error occurs when the text transcription obtained for the audio recorded by a particular microphone does not match with what the user said, producing an incorrect interpreted sentence. Finally, we evaluate the proposal using all microphones.
4.3. Summary of Our Approach
First, we extract the audio features using OpenSmile (audEERING
TM, Gilching, Germany) to score the quality of the signal of all the recordings perceived by the microphones. To perform the extraction, we implemented a configuration file to divide the audio into frames and later on select which features we want to extract. Once this is done with each signal, we proceed to analyze the results of the extraction of the audio features using our script. The extracted properties are analyzed, and the data are compared according to the criteria of
Section 3.1 and
Section 3.2. The next step consists of sending the audio streams to the Google Cloud speech-to-text service (or any other ASR) to obtain their transcriptions into text. This service sends a list of the hypotheses and their confidence parameters with which the scoring process will be carried out as explained in
Section 3.3. Finally, an ordered list of recognition hypotheses is generated, where the first positions correspond to higher scored ones.
5. Results
We have analyzed 192 sentences in the corpus. Every sentence had been recorded by 24 microphones in quiet and noisy conditions within the described scenario, producing 4608 audios that have been processed. Once analyzed, we made a comparison of the results obtained with the original sentences pronounced by the subjects. With these original phrases that were included in the corpus, we could check the number of hypotheses that successfully matched the original sentence. After obtaining the comparative table, we have calculated the Word Error Rate (WER) in the hypothesis produced.
Table 1 shows the average WER results obtained with the speech recognizer for all the audios recorded by each single microphone. Then, we created the groups explained in
Figure 4 and applied our approach to rank the different microphones in the group in order to select the best quality input and computed the WER comparing the best ranked hypothesis with the reference text. The results, shown in
Table 2 (check
Table 3 for the meanings of the abbreviations), show that with our approach the errors have decreased compared to the isolated microphone setting (
Table 1).
As can be observed in
Table 2, if the user voice commands were processed by each microphone in isolation, they would produce 255 interpretation errors. This shows the relevance of using our approach to be able to employ multiple microphones and select the best quality input. In
Table 2, we can see how groups E and D, which include microphones that produced errors, were able to reduce the error rate after the scoring process was applied. That happens because our approach allows to increase the number of recordings in order to process voice commands, adding every recording performed by each microphone in the group. For example, microphone L4L had 192 recordings, and L4R 192. After applying our procedure, we can analyze 192 + 192 recordings to determine the best audio streams with the highest quality.
As can be seen in
Table 2, the results obtained are positive, given that the error rates are low. In the corpus used, the audios obtained come from different sources that are not usually too distant between them. Therefore, the error rates are relatively low, making it possible to satisfactorily use different nearby sources obtaining a much more robust hypothesis.
In this experiment we have also verified that the user’s distance to the recording sources is not correlated for all cases, i.e., not always the closest microphone to the user provides the best quality input. This shows that acoustic features may provide more reliable information than the microphone location, as they allow also considering the orientation of the speaker and the attenuation produced by other objects in the environment as another important variable.
6. Conclusions
Although current environments with voice assistants are not yet mature enough, they are being incorporated into our daily lives. In a future where it will be normal to live in environments with numerous devices with an oral interface, it is necessary to face the different challenges related to the identification of the most reliable source of information and interaction and provide a coherent and coordinated response or reaction.
In this paper, we have presented an approach for the coordination of speech recognition devices in environments with more than one device with oral interaction capabilities. We present a scoring and selection process of the audio features and speech recognition hypotheses obtained through the different inputs in order to identify the best recognition hypothesis. We consider factors such as loudness, signal energy, surrounding noise, duration and recognition confidence measures. Altogether, they make it possible to improve the overall recognition accuracy by ranking the inputs and select the one with highest quality score.
Consequently, we can highlight the benefits of this procedure, insomuch as the present proposal offers:
Independence of the number of devices in the environment (minimum of two).
Independence of the position of the microphones and the users that interact with them.
Independence of the quality of the devices and their microphones.
Independence of the automatic speech recognition engine used.
Although this is a step towards achieving interaction and cooperation between devices in ambient intelligence scenarios, there are still other challenges such as designing development standards to fully compatibilize all agents, applying methods such as the one proposed in this article or other methods, for the negotiation or bargaining of information between all connected devices.
For future work, we will define a method to generate and coordinate the system response, avoiding overlapping action and responses from multiple devices.
Author Contributions
Conceptualization, A.B.-G., Z.C., M.N. and K.B.; methodology, A.B.-G., M.N., Z.C. and K.B.; investigation, A.B.-G.; data curation, Z.C. and A.B.-G.; formal analysis, Z.C. and A.B.-G.; funding acquisition, M.N., Z.C. and K.B.; project administration, M.N. and Z.C.; resources, M.N. and A.B.-G.; software, A.B.-G. (software development and implementation), M.N., Z.C. and K.B. (design and testing); supervision, M.N., Z.C., and K.B.; validation, A.B.-G., Z.C., M.N., and K.B.; visualization, A.B.-G.; Writing—Original Draft A.B.-G., Z.C., M.N. and K.B.; Writing—Review and Editing, A.B.-G., Z.C., M.N. and K.B.
Funding
This research has received funding by the project DEP2015-70980-R of the Spanish Ministry of Economy and Competitiveness (MINECO) and European Regional Development Fund (ERDF), the European Union’s Horizon 2020 research and innovation programme under grant agreement No. 823907 (‘Mental health monitoring through interactive conversations’, MENHIR Project), as well as, received inputs from the COST Action IC1303 AAPELE.
Conflicts of Interest
The authors declare no conflict of interest.
References
- Ruiz-Zafra, A.; Noguera, M.; Benghazi, K.; Ochoa, S.F. A Model-Driven Approach for Wearable Systems Developments. Int. J. Distrib. Sens. Netw. 2015, 11, 637130. [Google Scholar] [CrossRef]
- Ruiz-Zafra, A.; Benghazi, K.; Mavromoustakis, C.; Noguera, M. An IoT-Aware Architectural Model for Smart Habitats. In Proceedings of the 2018 IEEE 16th International Conference on Embedded and Ubiquitous Computing (EUC), Bucharest, Romania, 29–31 October 2018; pp. 103–110. [Google Scholar] [CrossRef]
- Hansen, J.H.L. Analysis and Compensation of Stressed and Noisy Speech with Application to Robust Automatic Recognition. Ph.D. Thesis, Georgia Institute of Technology, Atlanta, GA, USA, 1988. [Google Scholar] [CrossRef]
- Lippi, M.; Mamei, M.; Mariani, S.; Zambonelli, F. Coordinating distributed speaking objects. In Proceedings of the 2017 IEEE 37th International Conference on Distributed Computing Systems (ICDCS), Atlanta, GA, USA, 5–8 June 2017; pp. 1949–1960. [Google Scholar] [CrossRef]
- Ábalos, N.; Espejo, G.; López-Cózar, R.; Callejas, Z.; Griol, D. A multimodal dialogue system for an ambient intelligent application in home environments. In Proceedings of the International Conference on Text, Speech and Dialogue, Brno, Czech Republic, 6–10 September 2010; Springer: Berlin/Heidelberg, Germany, 2010; pp. 491–498. [Google Scholar] [CrossRef]
- Heinroth, T.; Denich, D.; Schmitt, A. Owlspeak-adaptive spoken dialogue within intelligent environments. In Proceedings of the 2010 8th IEEE International Conference on Pervasive Computing and Communications Workshops (PERCOM Workshops), Mannheim, Germany, 29 March–2 April 2010; pp. 666–671. [Google Scholar] [CrossRef]
- Vacher, M.; Istrate, D.; Portet, F.; Joubert, T.; Chevalier, T.; Smidtas, S.; Meillon, B.; Lecouteux, B.; Sehili, M.; Chahuara, P.; et al. The sweet-home project: Audio technology in smart homes to improve well-being and reliance. In Proceedings of the 2011 Annual International Conference of the IEEE Engineering in Medicine and Biology Society, Boston, MA, USA, 30 August–3 September 2011; pp. 5291–5294. [Google Scholar] [CrossRef]
- Wolf, M.; Nadeu, C. Channel selection measures for multi-microphone speech recognition. Speech Commun. 2014, 57, 170–180. [Google Scholar] [CrossRef]
- Yoshioka, T.; Chen, Z.; Dimitriadis, D.; Hinthorn, W.; Huang, X.; Stolcke, A.; Zeng, M. Meeting transcription using asynchronous distant microphones. In Proceedings of the Interspeech, Graz, Austria, 15–19 September 2019. [Google Scholar]
- Morgan, N. Deep and Wide: Multiple Layers in Automatic Speech Recognition. IEEE Trans. Audio Speech Lang. Process. 2012, 20, 7–13. [Google Scholar] [CrossRef]
- Bellegarda, J.R.; Kanevsky, D. Automatic Recognition of a Consistent Message Using Multiple Complimentary Sources of Information 1996. Available online: https://patents.google.com/patent/US5502774A/en (accessed on 20 July 2019).
- Benítez-Guijarro, A.; Callejas, Z.; Noguera, M.; Benghazi, K. Introducing Computational Semantics for Natural Language Understanding in Conversational Nutrition Coaches for Healthy Eating. Proceedings 2018, 2, 506. [Google Scholar] [CrossRef]
- Benítez-Guijarro, A.; Ruiz-Zafra, Á.; Callejas, Z.; Medina-Medina, N.; Benghazi, K.; Noguera, M. General Architecture for Development of Virtual Coaches for Healthy Habits Monitoring and Encouragement. Sensors 2019, 19, 108. [Google Scholar] [CrossRef] [PubMed]
- Zwicker, E. Subdivision of the Audible Frequency Range into Critical Bands (Frequenzgruppen). J. Acoust. Soc. Am. 1961, 33, 248–248. [Google Scholar] [CrossRef]
- Jiang, T.; Wu, Y. An Overview: Peak-to-Average Power Ratio Reduction Techniques for OFDM Signals. IEEE Trans. Broadcast. 2008, 54, 257–268. [Google Scholar] [CrossRef]
- Cristoforetti, L.; Ravanelli, M.; Omologo, M.; Sosi, A.; Abad, A.; Hagmüller, M.; Maragos, P. The DIRHA simulated corpus. In Proceedings of the LREC, Reykjavik, Iceland, 26–31 May 2014; pp. 2629–2634. [Google Scholar]
- Speech Recognition with Cloud Speech-to-Text|Cloud Speech-to-Text API. Available online: https://cloud.google.com/speech-to-text/ (accessed on 20 July 2019).
© 2019 by the authors. Licensee MDPI, Basel, Switzerland. This article is an open access article distributed under the terms and conditions of the Creative Commons Attribution (CC BY) license (http://creativecommons.org/licenses/by/4.0/).


