1. Introduction
The current paradigm of intelligent transport systems (ITS) is based on the continuous observation of what is happening in the transport network and the continuous processing of data coming from these observations. This facilitates the fulfilment of the objectives of transport systems, which are the improvement of safety, environmental sustainability and the fulfilment of mobility needs [
1]. To this end, ITS must provide the resources to analyze what is happening in the transport network, which implies the handling and processing of a massive amount of data. The purpose of this data management and processing is to extract non-trivial and useful information that is implicit in these data. For this reason, data mining and big data are fields increasingly used in transportation engineering [
2].
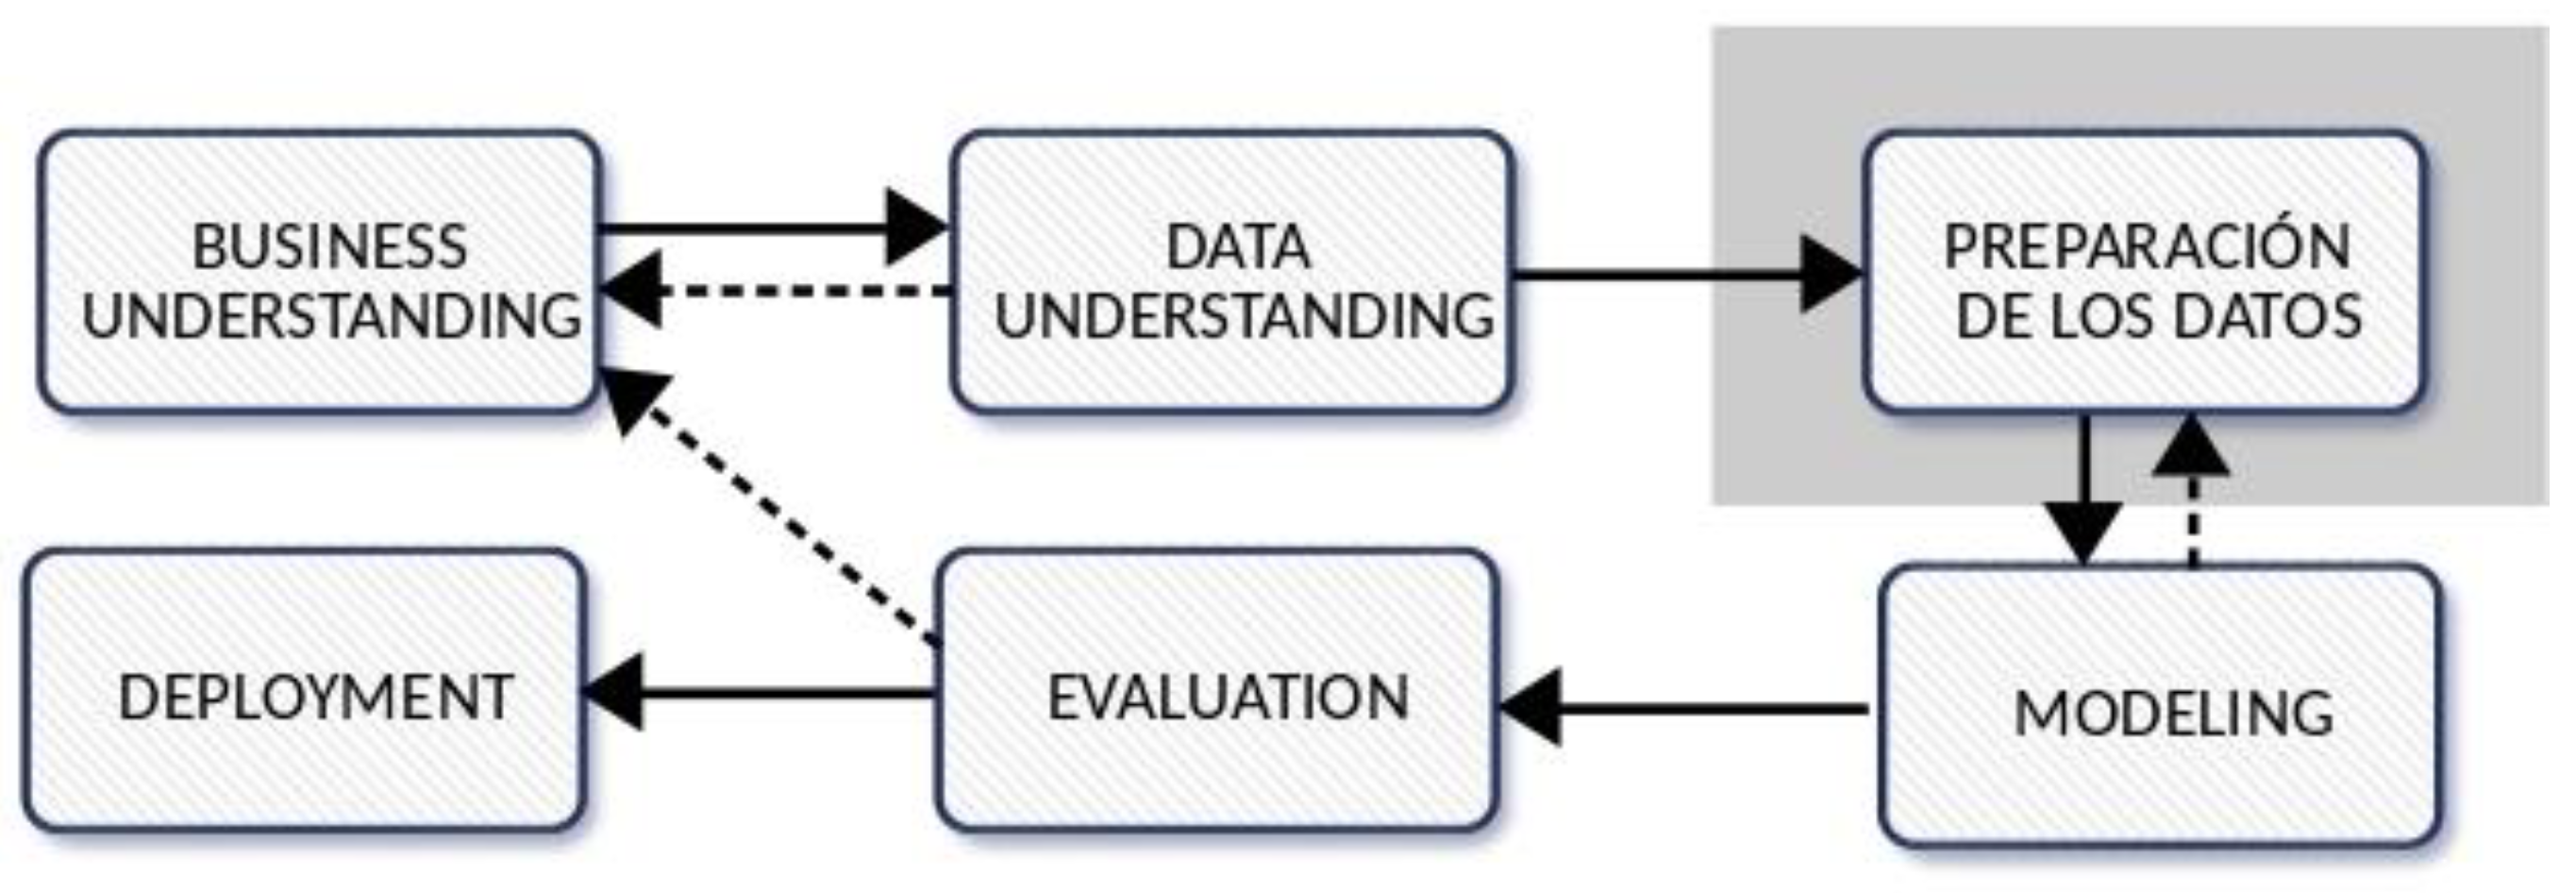
According to classical methodology CRISP-DM [
3], for the development of data mining projects, the related processes are grouped into six main phases that are presented in
Figure 1, where the continuous lines between phases make the project move forward and the discontinuous ones make it move backwards and replant strategies as a consequence of the results obtained. In their adaptation to the ITS, the tasks contemplated in each of them can be summarized as follows:
Business understanding. Determination of the objectives of the data mining project, which may be of various kinds: prediction of demand or evaluation of the quality of service, among others.
Data understanding. Exploration of the available data, fundamentally related to the definition of the transport network, the planning of services, and those registered in the systems installed on board the vehicles (such as positioning and payment systems), identifying quality problems and selecting those that allow the proposed objective to be reached.
Data preparation. Construction of the data set to be modeled, cleaning, merging and selecting data, and defining subsets when necessary.
Modeling. Application of techniques to obtain new knowledge from the data set created in the previous phase to describe the data in the form of intelligible patterns (such as behavior patterns of travel times) or to predict the behavior of any of the factors analyzed (such as demand).
Evaluation analysis of the new knowledge found and verification that it corresponds to the initially set objective.
Deployment. Application of new knowledge found through the adjustment of service planning policies or transportation system resources.
In any data mining project, the costliest phase, in terms of time required for its execution, is the data preparation phase [
4]. This contribution presents a framework whose objective is to facilitate the phases of data preparation and knowledge modeling in the context of data mining projects for road-based mass transit systems. The main contribution of this work is that, starting from realistic data requirements and based on standard specifications of transport data models, a common framework is proposed in which to develop machine learning or statistics processes, whose aim is the continuous improvement of public transport.
Figure 1 shows the classical methodology of a data mining project and contextualizes the framework proposed in the data preparation phase.
In addition to this introductory section, this article is organized into five more sections. The next section is dedicated to related works. The third section presents the formal model used for the proposed framework design. The framework is presented in the fourth section, focusing this description on the data handled. The fifth section is dedicated to presenting a use case. The main conclusions are presented in the sixth section.
2. Related Works
The review presented in this section is focused on those works in which data mining techniques are proposed to face relevant challenges of mass transit systems. According to the main source of data used, these works can be divided into two groups. The first group is made up of those that use payment systems as the main data source. The works that use the data provided by the positioning systems constitute the second group.
Below are works from the first group. In [
5] data from contactless smart card-based payment systems are modeled to obtain the profiles and habits of travelers. Key to this proposal are the data that identify travellers and those that specify the details of travellers’ trips, e.g., origin and destination stops, and the date and time at which the journeys are made. In [
6] data from payment systems are used to measure the use of transport infrastructure, based on data describing the basic aspects of trips made on the transport network: origin, destination, date and time. In [
7] data are handled in order to provide personalised information services. There is another group of works for demand predicting. These works use time series obtained from the data provided by the payment systems to carry out the predictions. In [
8] statistical techniques are used to predict short-term demand, and in [
9] neural networks. These works use data describing the trips: origin, destination, date and time of the trip. In [
10] the spatial and temporal behaviour of travellers is studied using clustering techniques.
Positioning data is processed using data mining techniques in order to reach different goals. In [
11], through clustering techniques developed by the authors, the demand and traffic conditions on the operations performance are analysed. Also, using clustering techniques, in [
12] a methodology, based on vehicle GPS data, for improving the design of the transport network is proposed, covering detection and classification of stops, generation of the routes and estimation of the times of passage through the stops. In [
13] a new metric is proposed to assess bus punctuality using vehicle positioning data. In [
14] the causes of irregularities in service planning are analysed. In [
15], clustering techniques and ad-hoc metrics are used to process vehicle positioning and passenger movement data in order to evaluate the quality of service. Finally, there is a bibliography describing different travel time prediction techniques. In [
16] neural networks are used, in [
17] a vector support machine, in [
18] classification techniques, in [
19] clustering techniques, in [
20] time series statistical techniques and in [
21] state models. In all these works, the basic data used by the different methods are the position of the vehicle and the instant in which this position was acquired. Subsequently, these data are related to transport operations carried out by vehicles.
3. Formal Conceptualization
A line of a road-based mass transit system is the first entity to be formalized. For the purposes of the framework, a Line is defined as systematic, scheduled route travelled by public transport vehicles. Systematic means that the bus always follows the same path and pre-established stops that do not vary. Scheduled means that there is a schedule that establishes when the buses must run the route. In the formalization, L represents a generic line, and a specific line is specified by means of the notation Li, where the subscript i is a value, normally integer, that uniquely identifies the line.
The operation of a line by a public transport vehicle shall be termed a Line Service. The set of Line Services of Li are specified by the notation Ei, where i is the identifier of the line. In the model, time is specified by the notations T and t. T is used to represent a time interval and t to represent a time instant. All Line Services by line Li made over a period of time T are named by the notation Ei,T. Similarly, a Line Service that begun at a time instant t is specified by the notation ei,t.
Stops on the route of
Li are specified by the notation
Si. The section of the route that runs from one stop to the next is called a
Route Segment or
Arc (see
Figure 2).
In the context of road-based mass transit systems, the
Travel Time (
TT) in a
Line Service of
Li is the result of the sum of two times:
Dwell Time,
DT, and
Nonstop Running Time,
RT.
DT represents the time that the vehicle is stationary at stops for passengers to board or alight from the vehicle.
RT represents the time taken by the vehicle to go from one stop on the route to the next. If a route has
N stops, then the total
TT of a line service is:
Finally, the term Arrival Time is the time at which the vehicle arrives at that stop.
4. Framework Model
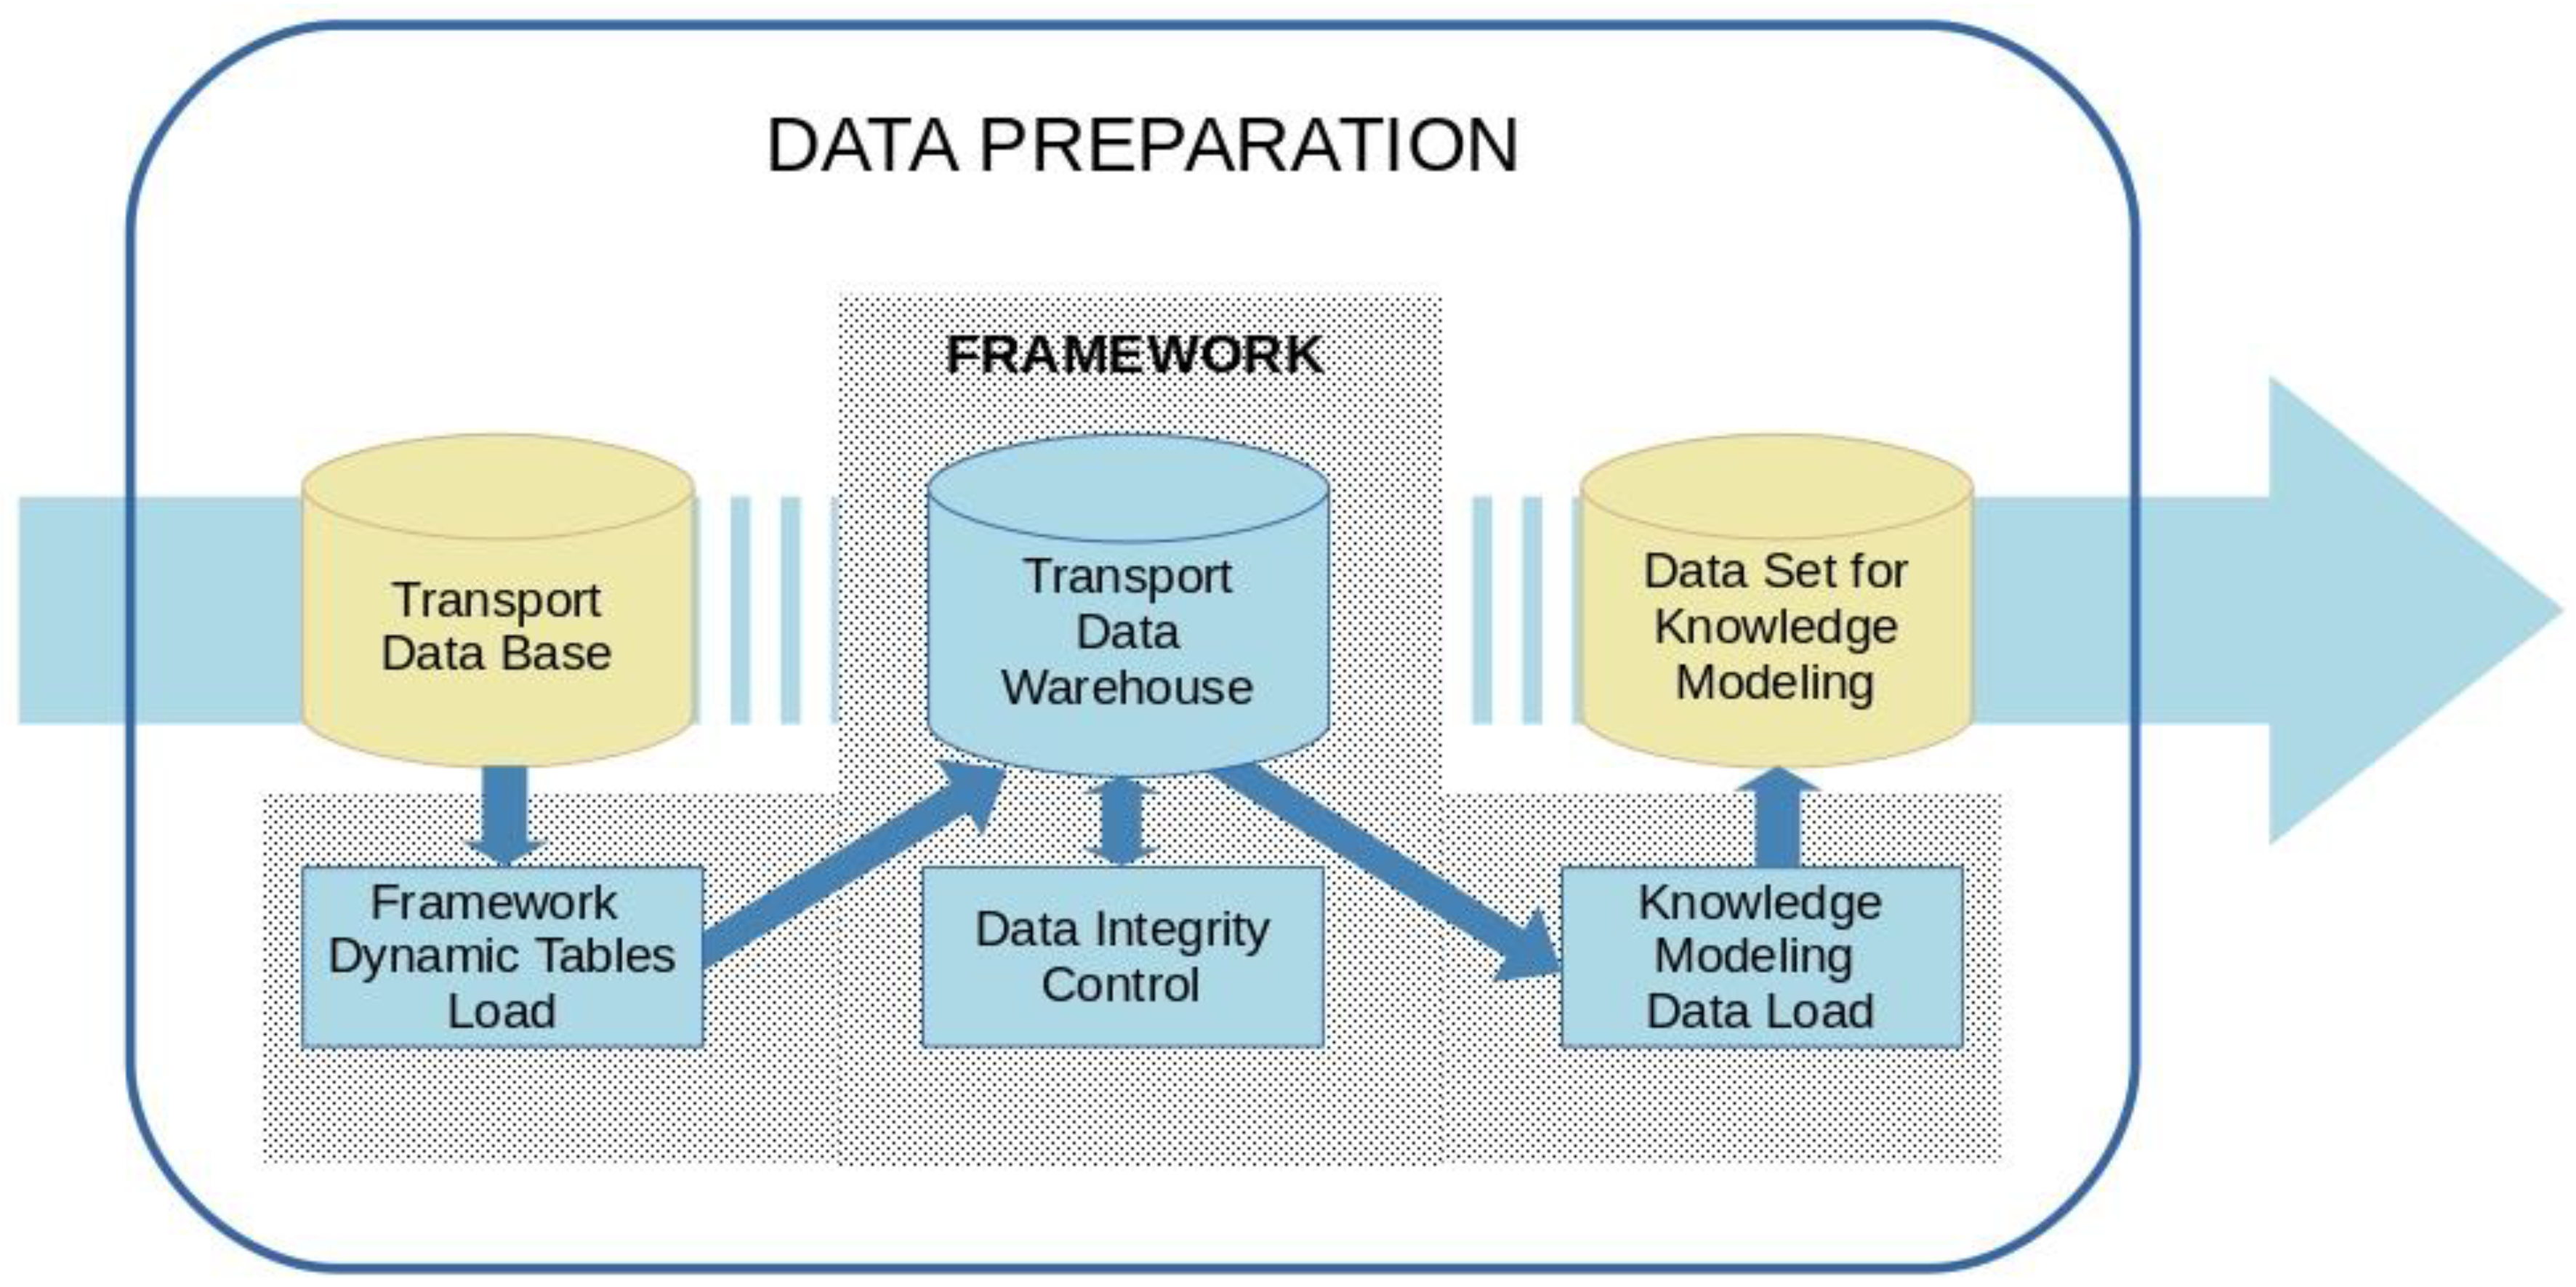
The proposed framework for the above-mentioned data preparation phase is described below. This is shown in
Figure 3, where, on the one hand, the essential data sets in this phase appear in yellow (i.e., the initial data set extracted from the TDB, and the resulting data set, which will intervene in the next phase of knowledge extraction) and, on the other hand, in blue are the elements that constitute this proposal, formed by a new dynamic data structure and three new processes: data loading, data validation and generation of the set to be modeled. All of them are detailed below distinguishing between data module and process module.
4.1. Data Module
This module consists of two components. The first is made up of data obtained from the transport database (TDB) provided by the transport operator. The second component is made up of dynamic data tables generated by the framework processes accessing the TDB. Therefore, this module assumes the typical functionality of the data warehouse systems and is therefore called transport data warehouse (TDWH).
4.1.1. TDB Data
The data entities constituting this element are those related to transport network design, service scheduling and production.
The entities belonging to the transport network design are space entities. They represent the deployment of the transport network in a geographical area. Basically, these are:
Bus stops and relevant points of the transport network. The framework assumes the geographical specification GPS as positioning model. Therefore, each entity of this type is located geographically by latitude, longitude and altitude.
Arc of the transport network. This is a relationship between two points in the transport network, indicating that there is a road that connects them without passing through another node. The specification of each arc entity is composed of an identifier, the point of origin of the road, the point of destination, the type of road used (street, road, dual carriageway, etc.) and the length.
Line route, which is represented in an orderly sequence of arcs, determining the path to be systematically made by the public transport vehicles. Each entity of a line route type is represented by a unique code associated with a line path and an arc’s n-tuple of the transport network.
The scheduling entities specify the transport operations that are carried out, when these must be carried out, where these must be carried out and the resources that must be used (vehicle and driver). The entities of this type used by the framework are the following:
Line service. This refers to an expedition that travels a planned route, starting in an instant of time. The specification of a line service is carried out by means of the scheduled start time, the estimated duration and the code of the route to be travelled.
Service. This entity is composed of a set of operations ordered in time. The specification of each service entity consists of a code that uniquely identifies the service, the vehicle that must perform the service, the driver and the instant in which it should begin.
Service scheduling. This entity is composed of all the services that are scheduled during a period T. The specification of this entity is composed of a code that identifies the scheduling, the first calendar day of T and the last calendar day of this period.
Finally, the framework uses tree entities related to production:
The realization of a line service. Its representation is composed of the following attributes: instant when the line service started, instant of completion, vehicle that performed the route, driver, the line route and the line service identifiers.
The movements of travellers are used by the framework. These entities are obtained from the payment systems, reflecting the trips made in line services. Each entity of this type has the following attributes: instant of time in which the movement occurred (check-in or check-out), type of payment used, amount, identifier of the line route, origin and destination stops, terminal in which the movement and vehicle have been registered.
The positioning of the vehicles during the realization of a line service. The framework assumes that public transport vehicles have an automatic localization system (
AVL). This assumption is not very restrictive, because nowadays
AVL systems are commonly used. The structure of the
AVL register is shown in
Table 1.
4.1.2. TDWH data
The use of the dynamic data tables of this component allows two objectives to be reached. The first, to be able to reproduce relevant events in any node or arc of the transport network and second, from this reproduction, to obtain useful and dynamic data used by the knowledge modelling process. The relevant events contemplated in the current implementation of the framework are:
Travellers who in a time instant start a trip at a stop on a route of a line service, performed by a given vehicle.
Travellers who in a time instant end a trip at a stop on a line service route, made by a given vehicle.
For each line service route performed, RT and DT times.
The framework processes access the TDB data previously described, obtain the data representing the previous events and, from these data, generate the records of the different TDWH tables.
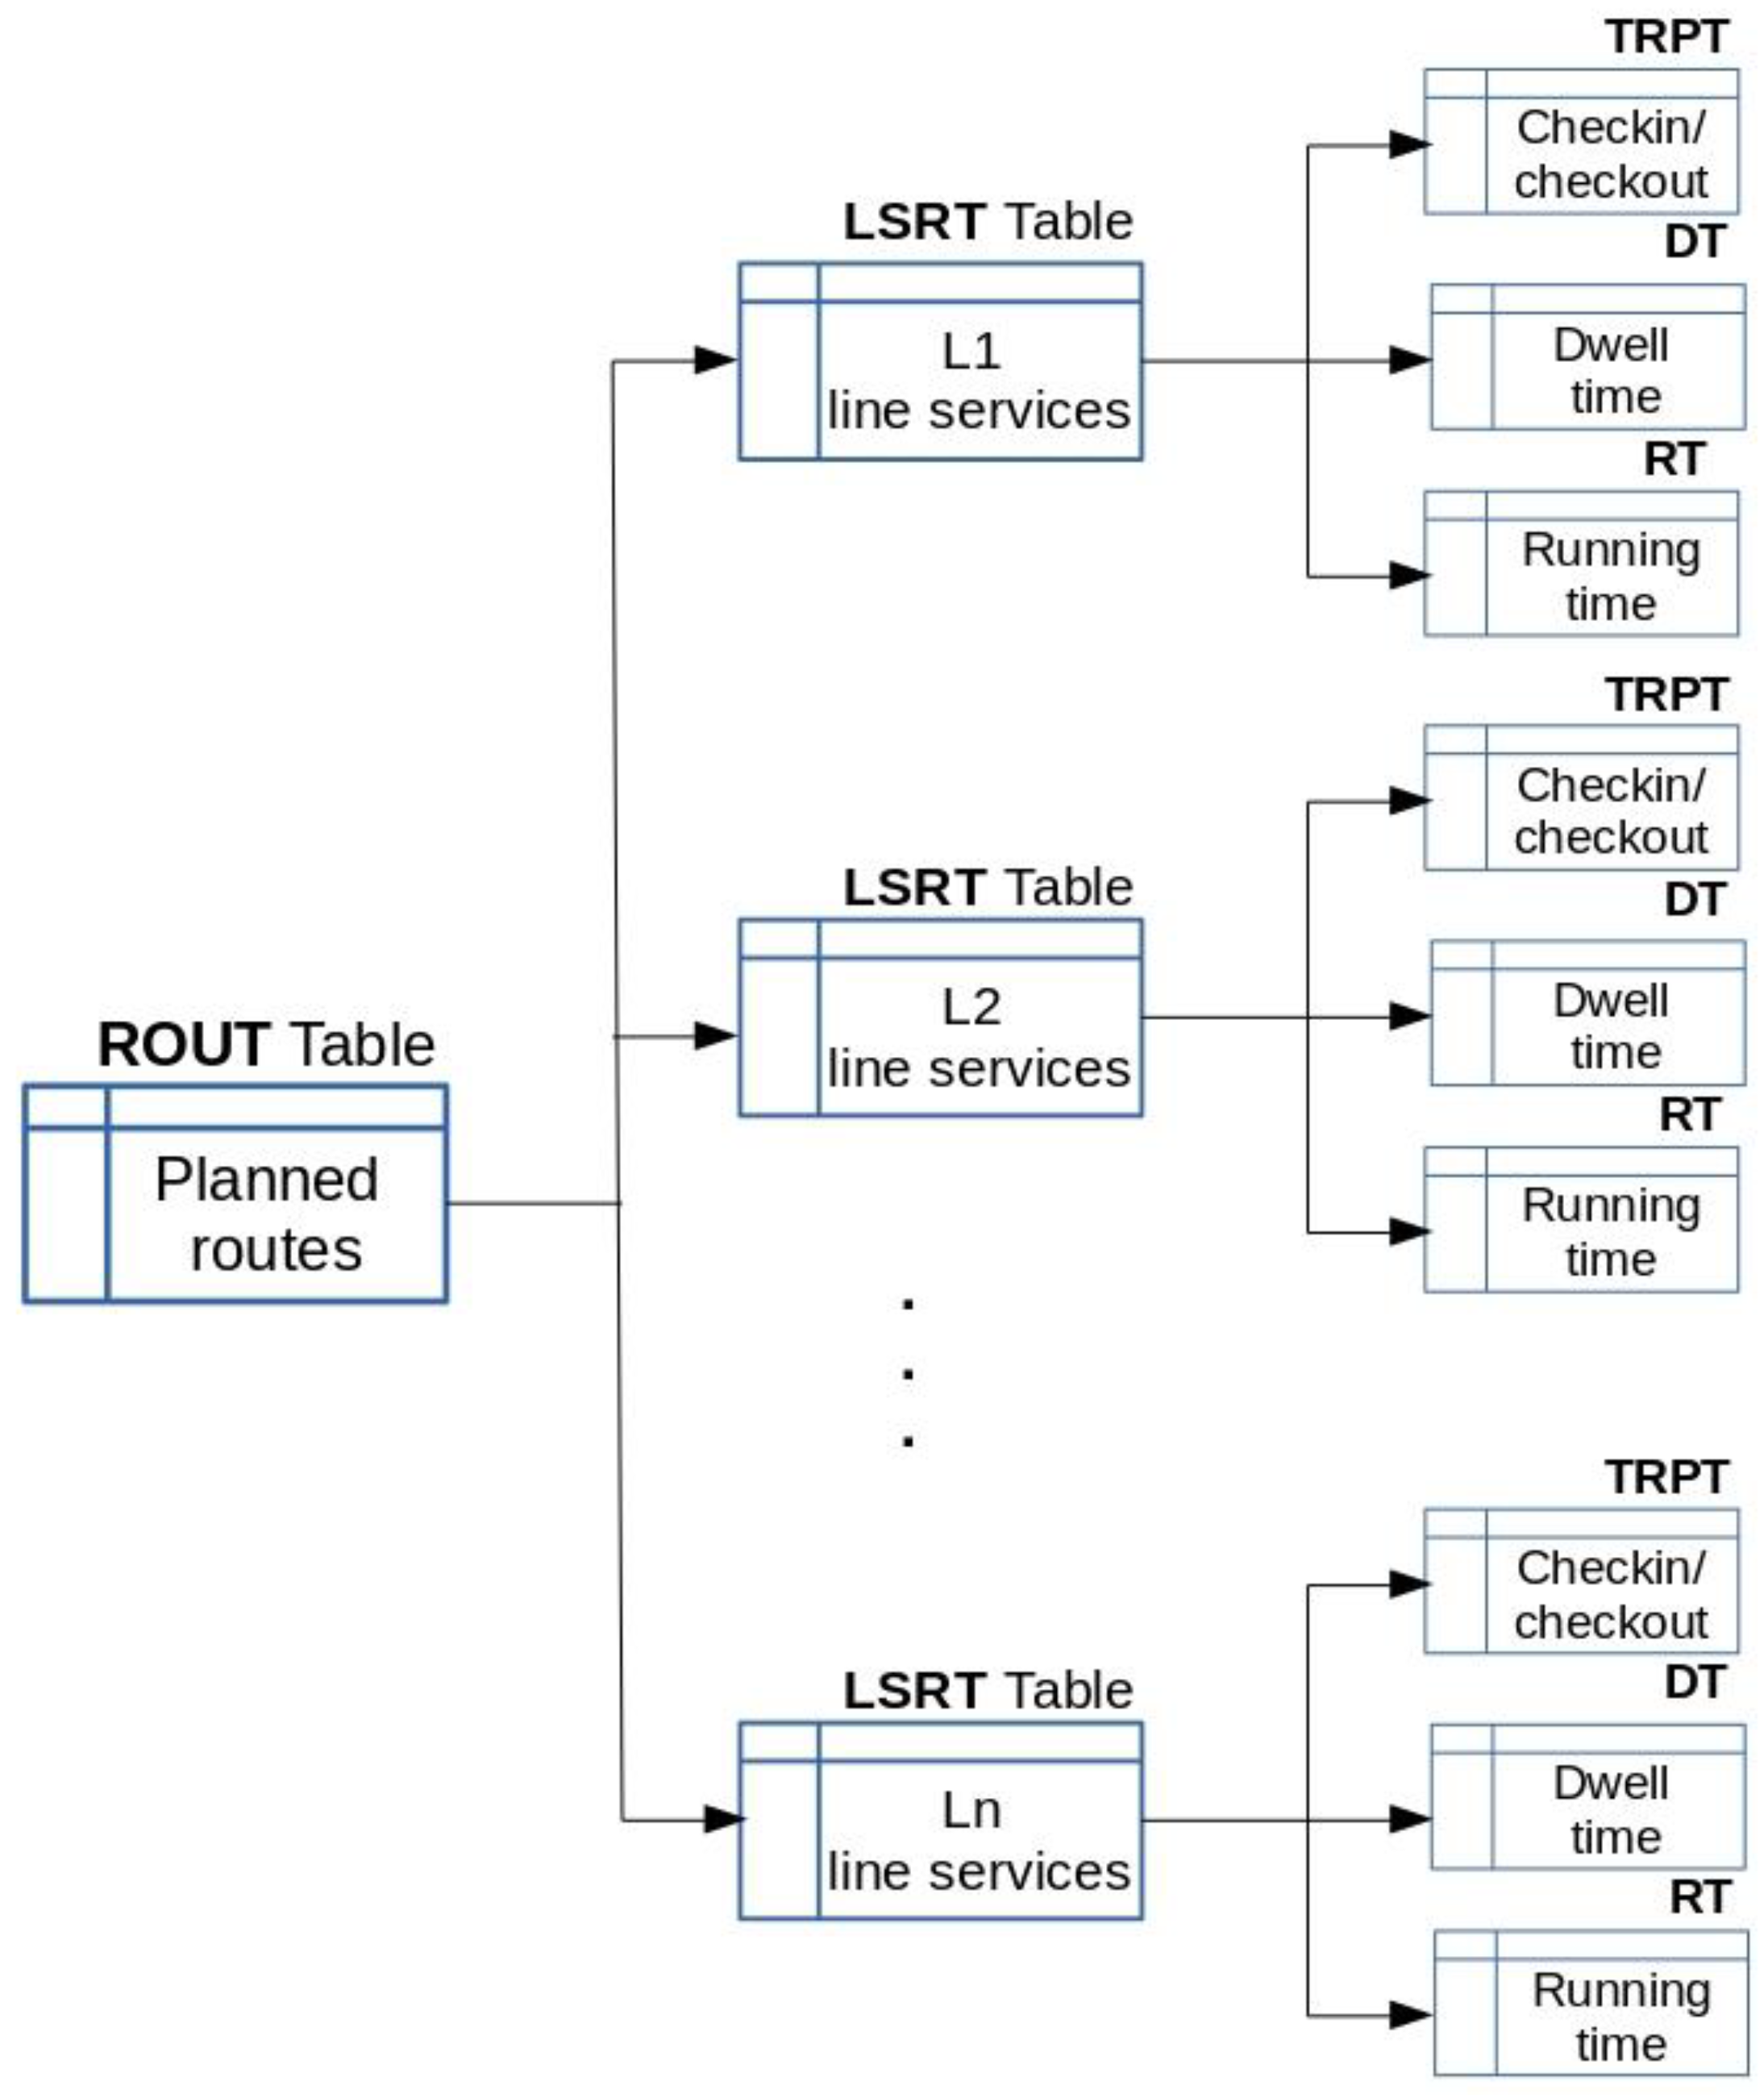
Figure 4 shows the schema of the dynamic tables and
Table 2 shows the data fields of the records of these tables. The line service entity is the entity from which these dynamic tables are generated. The different planned routes are represented in
ROUT; each record in this table represents a planned route in the transport network (Route Code field), and each route has a line field associated with it. As the path of a route can change, the Version field is used to record the different versions of a route. Each line service performed is represented by a
LSRT record that contains the Route Code field, the Starting Instant field and the Termination Instant field.
ROUT is generated from the service planning registered in the TDB. Tables LSRT, TRPT, RT and DT are obtained from the production records stored in TDB.
Each TRPT record represents a trip made by a public transport user, recording the payment medium identifier (Card Code field), the route (Route Code field), the vehicle (Vehicle field), the Departure Stop Code field, the Arrival Stop Code field and the time instants in which the check-in (Check-In Instant field) and the Check-out (Check-Out Instant field) were made. These data are provided by the payment systems used. The data of this table are especially useful for data mining processes that aim to know the behaviour of demand, the habits of travellers and the use of resources (vehicles, stops and stations) by users.
Each RT record reflects the time taken by a vehicle (Vehicle field) to cover each segment (Segment field) of the route (Route Code field) of the line service that started at a time instant (Service Line Starting Instant), which is the nonstop running time between each pair of stops (Nonstop Running Time field). Each DT record represents the dwell time of a vehicle (Vehicle field) at each stop (Stop field) of the route (Route Code field) in a line service that began in a time instant (Line Service Starting Instant field). The data stored in the RT and DT tables are especially relevant for data mining projects related to the TT, such as the TT forecasting or the reliability evaluation of the service scheduling.
4.2. The Processes
Framework procedures are classified into three types. The first type is responsible for generating the records of the dynamic tables. They are scripts that by means of Structured Query Languag (SQL) sentences consult the TDB. The second type has the objective of guaranteeing the integrity of the data sets used by the knowledge modelling techniques that are implemented. Finally, the third type of procedures are responsible for generating the data sets used by the knowledge modelling techniques.
In a data mining project, ensuring the integrity of the data sets used is a requirement. In the proposed framework, data integrity control is performed in two phases. In the first phase, each data record is analysed individually in order to eliminate those with erroneous or incoherent data. The causes of these errors are of two types: malfunction of the devices that produce the data or errors in the manual procedures in which these data are generated. Given the importance of factors of spatial and temporal nature in the knowledge to be modeled, the control of errors in data related to vehicle positions and the time instants in which events are recorded is a key factor. The detection of erroneous or low-quality positioning measurements is performed by the field that indicates the quality of the GPS measurement, however, there are other positioning errors that are related to external factors, for example environmental factors, which produce errors in GPS measurements that are more difficult to detect.
The second phase of data set validation is more complex, since it consists of an analysis of completeness and consistency in data related to transport entities. For example, in an analysis of the TT of the services of a line, it is necessary to guarantee that the considered routes travelled by the vehicles coincide with the planed route and, therefore, to discard from the analysis those routes which, for different reasons, for example, works, accidents, events, etc., do not coincide with the planned route. In this case, there is a process of validation of the line service routes that verifies that the reproduced routes coincide with those planned.
5. Use Case
The proposed framework has been used to analyse interurban transport on the island of Gran Canaria. This analysis has made it possible to obtain knowledge about different important variables such as demand, punctuality and TT of the different routes and corridors of the transport network of the mentioned island.
The following describes how the framework has been used to obtain data that have allowed the analysis of TT on two important routes of the transport network. These routes are the routes identified by L1 and L303. The routes start from the most populated city on the island, the city of Las Palmas de Gran Canaria, and run through, in the first case, the most populated, tourist, commercial and industrial centres on the island and, in the other, residential and regional areas. Therefore, they are routes in which there are a large number of passenger movements, implying a large number of registers. The objective was to know the behaviour of TT and to develop a model for predicting this travel time.
The details and results of this study were presented in [
22] where
TT behaviour was analysed throughout 2015. We now present the data obtained by the proposed framework that made this study possible.
The number of GPS readings used for
TT analysis for each analysed line are shown in
Table 3. Of a total of 51,499,404 GPS records that were generated throughout the vehicle fleet in 2015, 2038668 were applied from line
L1 and 615813 from line
L303, being validated by the integrity control processes described in the previous section.
For the two lines analysed, 11,847 line services of line L1 and 9887 line services of line L303 were planned. These data were obtained by consulting the ROUT and LSRT tables, whose records were generated by the framework script processes querying the TDB. From the data records representing vehicle, start time and the end time of each line service, all the trips made in the line services of lines L1 and L303 throughout 2015 were reproduced, based on the GPS readings acquired in those line services. The data integrity verification processes, described in the previous section, analysed each of the reproduced routes to check whether the route was complete and matched the planned path. As a result of this verification, 8419 routes on line L1 and 7862 on line L303 were selected as valid. For each of these valid routes, by means of an analysis of the sequence of GPS readings, the instants of arrival at each bus stop were obtained, resulting in 58,933 arrival time data for line L1 and 39,310 arrival time data for line L303. These arrival time data were the data sets used by the knowledge modelling techniques to analyse the TT.
Specifically, the TT profiles of the line services of the analysed routes were generated. For each reconstructed route of line services, using the RT table of the framework, an n-tuple containing the TT was generated in each of the selected stops of the route. Each of these n-tuples represented the TT profile of the associated performed travel. Different clustering techniques were applied to classify the whole set of TT n-tuples obtained, the K-medoids technique with Manhattan as distance-based similarity metric being the one that produced the best results.
From these results, a
TT prediction method based on
TT similarity patterns (
PSM) was developed [
21]. The method consists of assuming that in a line service that is being carried out, the
TT from the last stop that has been passed to the next one, is equal to the
TT that indicates the pattern (medoid) with the behaviour most similar to the profile of the
TT observed since the beginning of the expedition.
Data were generated from the
RT table to measure the accuracy of the prediction method, which was compared with two alternative methods widely used as baseline in short-term
TT prediction work: prediction based on mean
TT (
AVG) and prediction based on a multilayer perceptron neuronal network (
ANN). Using the data provided by the
RT table, the mean
TT of the
AVR technique was calculated and, for the
ANN method, learning and validation datasets were created.
Table 4 shows the results obtained with the three methods in path
L1 and
Table 5 in path
L303. The values shown in the tables are the Mean Absolute Percentage Error (MAPE) values obtained by applying the different methods, where the best ones are highlighted in bold.
6. Conclusions
In data mining projects, the costliest phase, in terms of the time required for completion, is the phase that aims to prepare the data that will be used by knowledge modelling techniques. When the project requires the management of a large volume of data, such as those developed in the contexts of mass transit systems, the time required for this phase grows exponentially. In this paper, a framework for facilitating this phase of data preparation in data mining projects for road-based mass transit systems has been presented. This framework has been used for the analysis of very important aspects in this type of transit system: in the analysis of demand and in the analysis of the TT, specifically in its prediction, and in the evaluation of the punctuality of the services. The case of use presented in this article corresponds to the development of the TT prediction model, and served to compare the developed model, PSM, with two other alternative techniques: AVG and ANN. Considering the different nature and amount of data required by each of these techniques, which were obtained using the proposed framework, it is concluded that it achieves the objective of providing a data environment that facilitates the execution of knowledge modeling techniques in the context of data mining projects for road-based mass transit systems, constituting an environment independent of the modeling techniques used. Finally, there are indications that there is a future line of research to be considered, which is the possibility of automating data mining processes to run on a constant basis for the continuous improvement of service quality.

 ,
, 

