Proceeding Paper

Applying a Two-Layer Quadrupole Model for Quantitative Thermography at Overload-Induced Delaminations in GFRP †

by
Jan P. Müller
1,
Giuseppe Dell’Avvocato
2 and
Rainer Krankenhagen
1,*
1
Bundesanstalt für Materialforschung und -prüfung (BAM), Richard-Willstätter-Str 11, 12489 Berlin, Germany
2
Politecnico di Bari, Sezione Progettazione Meccanica, Via Japigia 182, 70125 Bari, Italy
*
Author to whom correspondence should be addressed.
Presented at the 15th International Workshop on Advanced Infrared Technology and Applications (AITA 2019), Florence, Italy, 17–19 September 2019.
Proceedings 2019, 27(1), 40; https://doi.org/10.3390/proceedings2019027040
Published: 10 October 2019

Abstract

:
The applicability of 1D-quadrupole-model on the depth estimation of overload-induced delaminations is tested in this contribution. While classical 1D-methods like Pulsed Phase Transformation and Thermographic Signal Reconstruction determine the depth of a defect by one parameter, a two-layer quadrupole model provides two parameters: depth and thermal resistance. In addition, the convectional losses at the surfaces may be considered. The defect investigated is a large-scale delamination in glass fibre reinforced polymer generated by tension overload.

1. Introduction

1D-models have been proven successful in determining the depth of hidden flaws investigated by active thermography, i.e., with methods like pulsed phase transformation (PPT) [1] and thermographic signal reconstruction [2]. These models process the data quite fast and deliver a depth map of defects hidden in samples. But they also have some drawbacks: they evaluation procedures ensuring a high quality of the depth estimations depend on the parameters of the acquisition, for example the sampling rate. In addition, depth estimations by PPT and TSR depend on the size of the defect [3], since the heat flows around the defect and creates deviations in the thermographic signal. This is valid for retractions, e.g., flat bottom holes as well as for delaminations. When investigating deeper defects in material with low heat conduction, convectional heat losses alter the TSR and PPT signals and cannot be neglected. Some extensions considering these points exist [4]. The quantitative evaluation of PPT in terms of defect depth requires a scaling variable. This needs to be determined individually for each defect type [1].
An interesting alternative approach is the use of parametrized 1D-simulations with the quadrupole method. It handles different material layers, a thermal resistance in-between the layers, thermal losses at the surface of the sample [5]. Using non-linear regression methods, the parameters of the simulation can be adjusted by comparing simulation and experimental data, as shown for 1-layer systems [6,7] and two layer systems [7]. In the publication of Feuillet et al. [7], artificial delaminations were manufactured by introducing PTFE (Teflon) inlays in carbon fibre reinforced plastics. The thermal signal of the delaminations were mainly be modelled by the thermal properties of PTFE, which differ from the air contained in an ordinary delamination. In this work, an air-filled delamination in glass fibre reinforced polymer (GFRP) is investigated, resembling more readily the thermal properties of real world delaminations.
Table 1. Thermal and material properties to the material, determined within the VITCEA-project. The methods are described in Ref. [8].
Thermal and Material PropertyValue (Room Temperature)Measurement Method [8]
thermal diffusivity (in-depth) 2.2 · 10 7 m 2 / s calculated
thermal conductivity (in-depth) 0.40   W   /   mK hot disk
heat capacity 1150   J / kg   K adiabatic calorimeter
density 1.60   g / cm ² dimensions and weight

2. Materials and Methods

2.1. Specimen

The specimen has been produced and investigated within the framework of the VITCEA project. A 5.1 mm thick plate has been made of 16 UD-layers, using the glass fibre-reinforced polyamide PA 12 GF 60 (a thermoplastic material). The plate having the dimensions 240 × 50 mm2 was created with a quasi-isotropic stacking layout (45°, 0°, −45°, 90°). A notch with 5.3 mm width was milled into the sample, having a depth of 1.75 mm. The overload-induced delaminations were manufactured using a conventional load testing machine with 100 kN [9]. This way, an air-filled delamination could be created starting in a defined depth. The thermal properties of the material are given in Table 1. Since the material is semi-transparent, the even side of the specimen has been coated by matte black liquid rubber spray (mibenco).

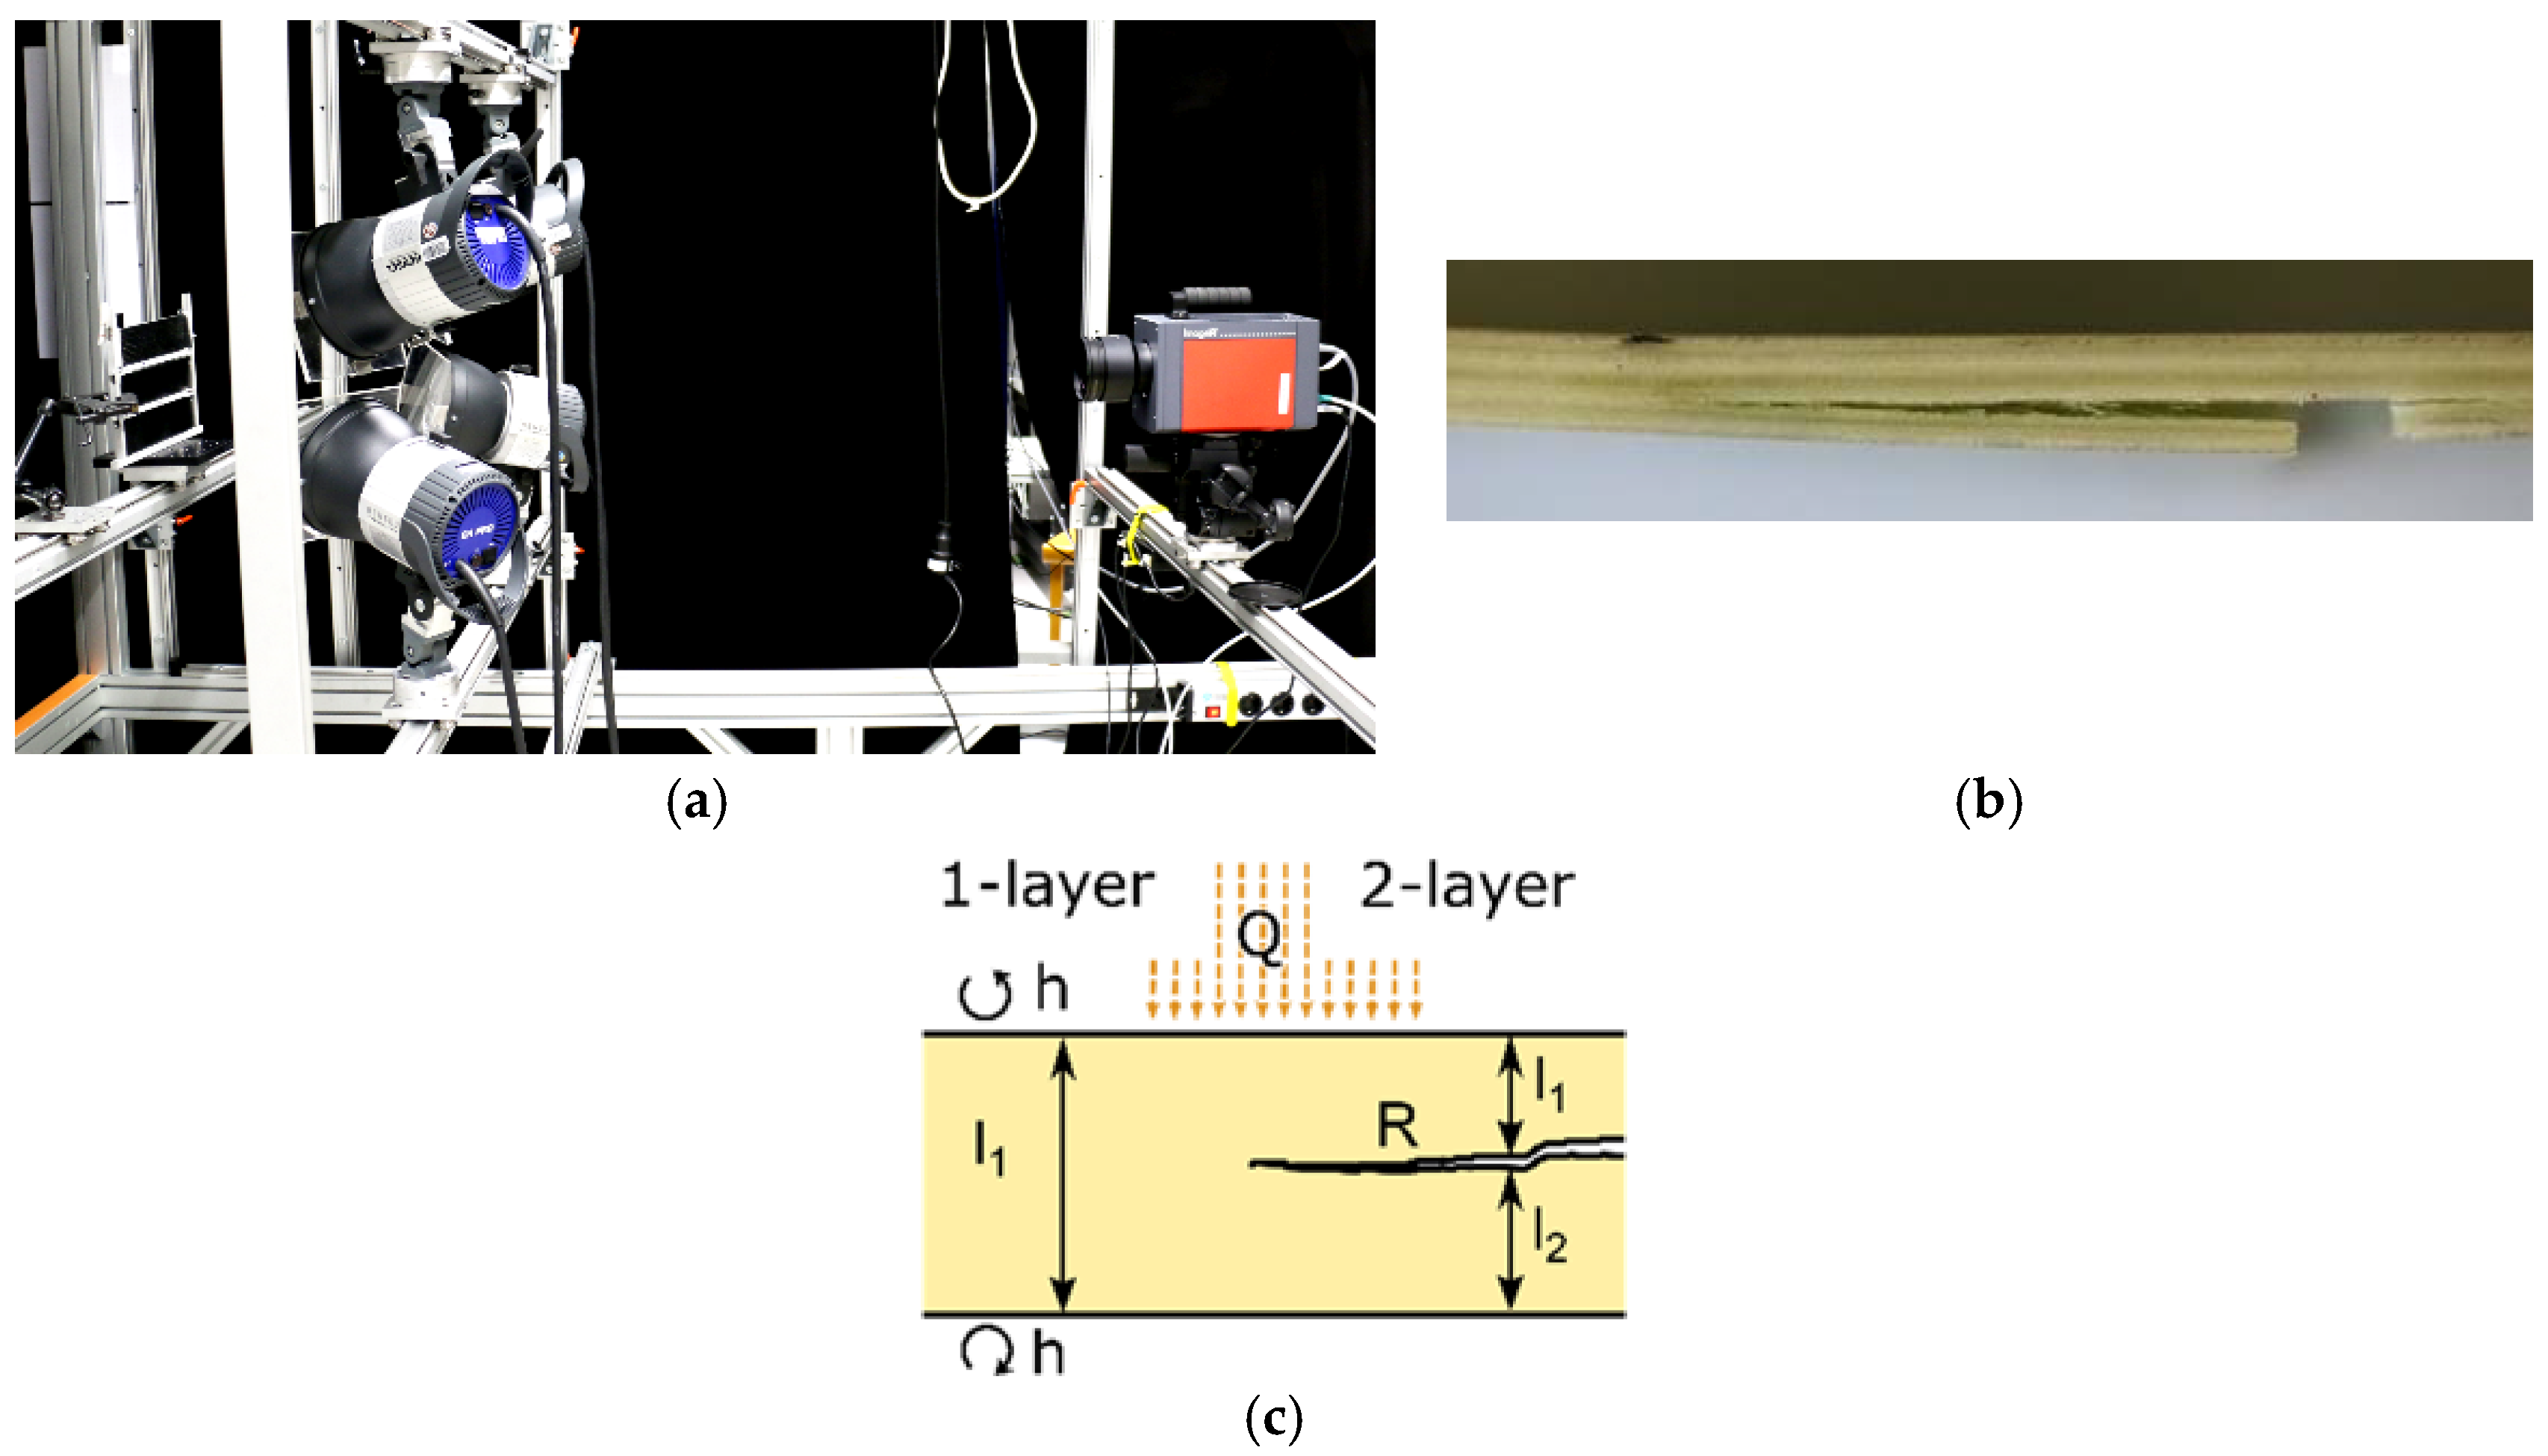
2.2. Thermographic Setup and Evaluation of Data

The specimen was investigated by flash thermography in reflection geometry, the set-up is shown in Figure 1. Four flash lamps using 6 kJ electrical energy (Hensel Studio Technik, EH Pro 6000) simultaneously irradiated the sample (distance 40 cm, angle 40°), with acrylic glass filtering the heat radiation. The flashes were aligned to create an as possible homogeneous heating. The specimen was mounted in a frame together with two other ones and was carefully thermally insulated using foam. The irradiated energy of the flash lamps at the surface of the specimens was measured using a PVC-plate, as described in Ref. [10], it reached 8.0 kJ / m 2 . The surface-temperature of the GFRP-plate was recorded for 2500 s at a frame rate of 10 Hz by a MWIR-camera (InfraTec ImageIR 8300), at a NETD of 25 mK. An integration time of 640 µs, a calibration range of 0–60 °C, and a subframe of 640 × 512 px2 were used. The camera equipped with a 50 mm lens (f/2.0) was placed 170 cm from the sample, leading to a FOV of 9° × 7°.
The main idea is to apply the quadrupole method with two layers to all individual pixels. Then, the particular parameters can be displayed in a map. The thickness of the first layer corresponds to the depth of a delamination if there is one. First of all, a background image was subtracted. To eliminate drifting thermal images, a correction was carried out. Pulsed phase thermography [11] was applied to distinguish the sound regions of the sample from the defect ones. To carry out regressions, the noise of the thermographic signal was reduced by temporal and spatial averaging. The spatial mean of a 5 × 5 px2 region of interest (ROI) was taken and the frames were logarithmically decimated by temporal averaging 1 to 100 frames, leaving 350 frames. A 1D-quadrupole model, described in Ref. [12] was optimized for a robust regression procedure. One or two layers are covered by the model, as sketched in Figure 1c. The irradiation density Q , the convection h , as well as the layer thicknesses l 1 and l 2 are considered, in addition to the material parameters in Table 1. Between two layers, a thermal resistance R is modelled—the delamination is threated as thermally thin, without modelling an extra layer. All lateral heat flows are neglected within this model. All data processing was carried out with MATLAB.

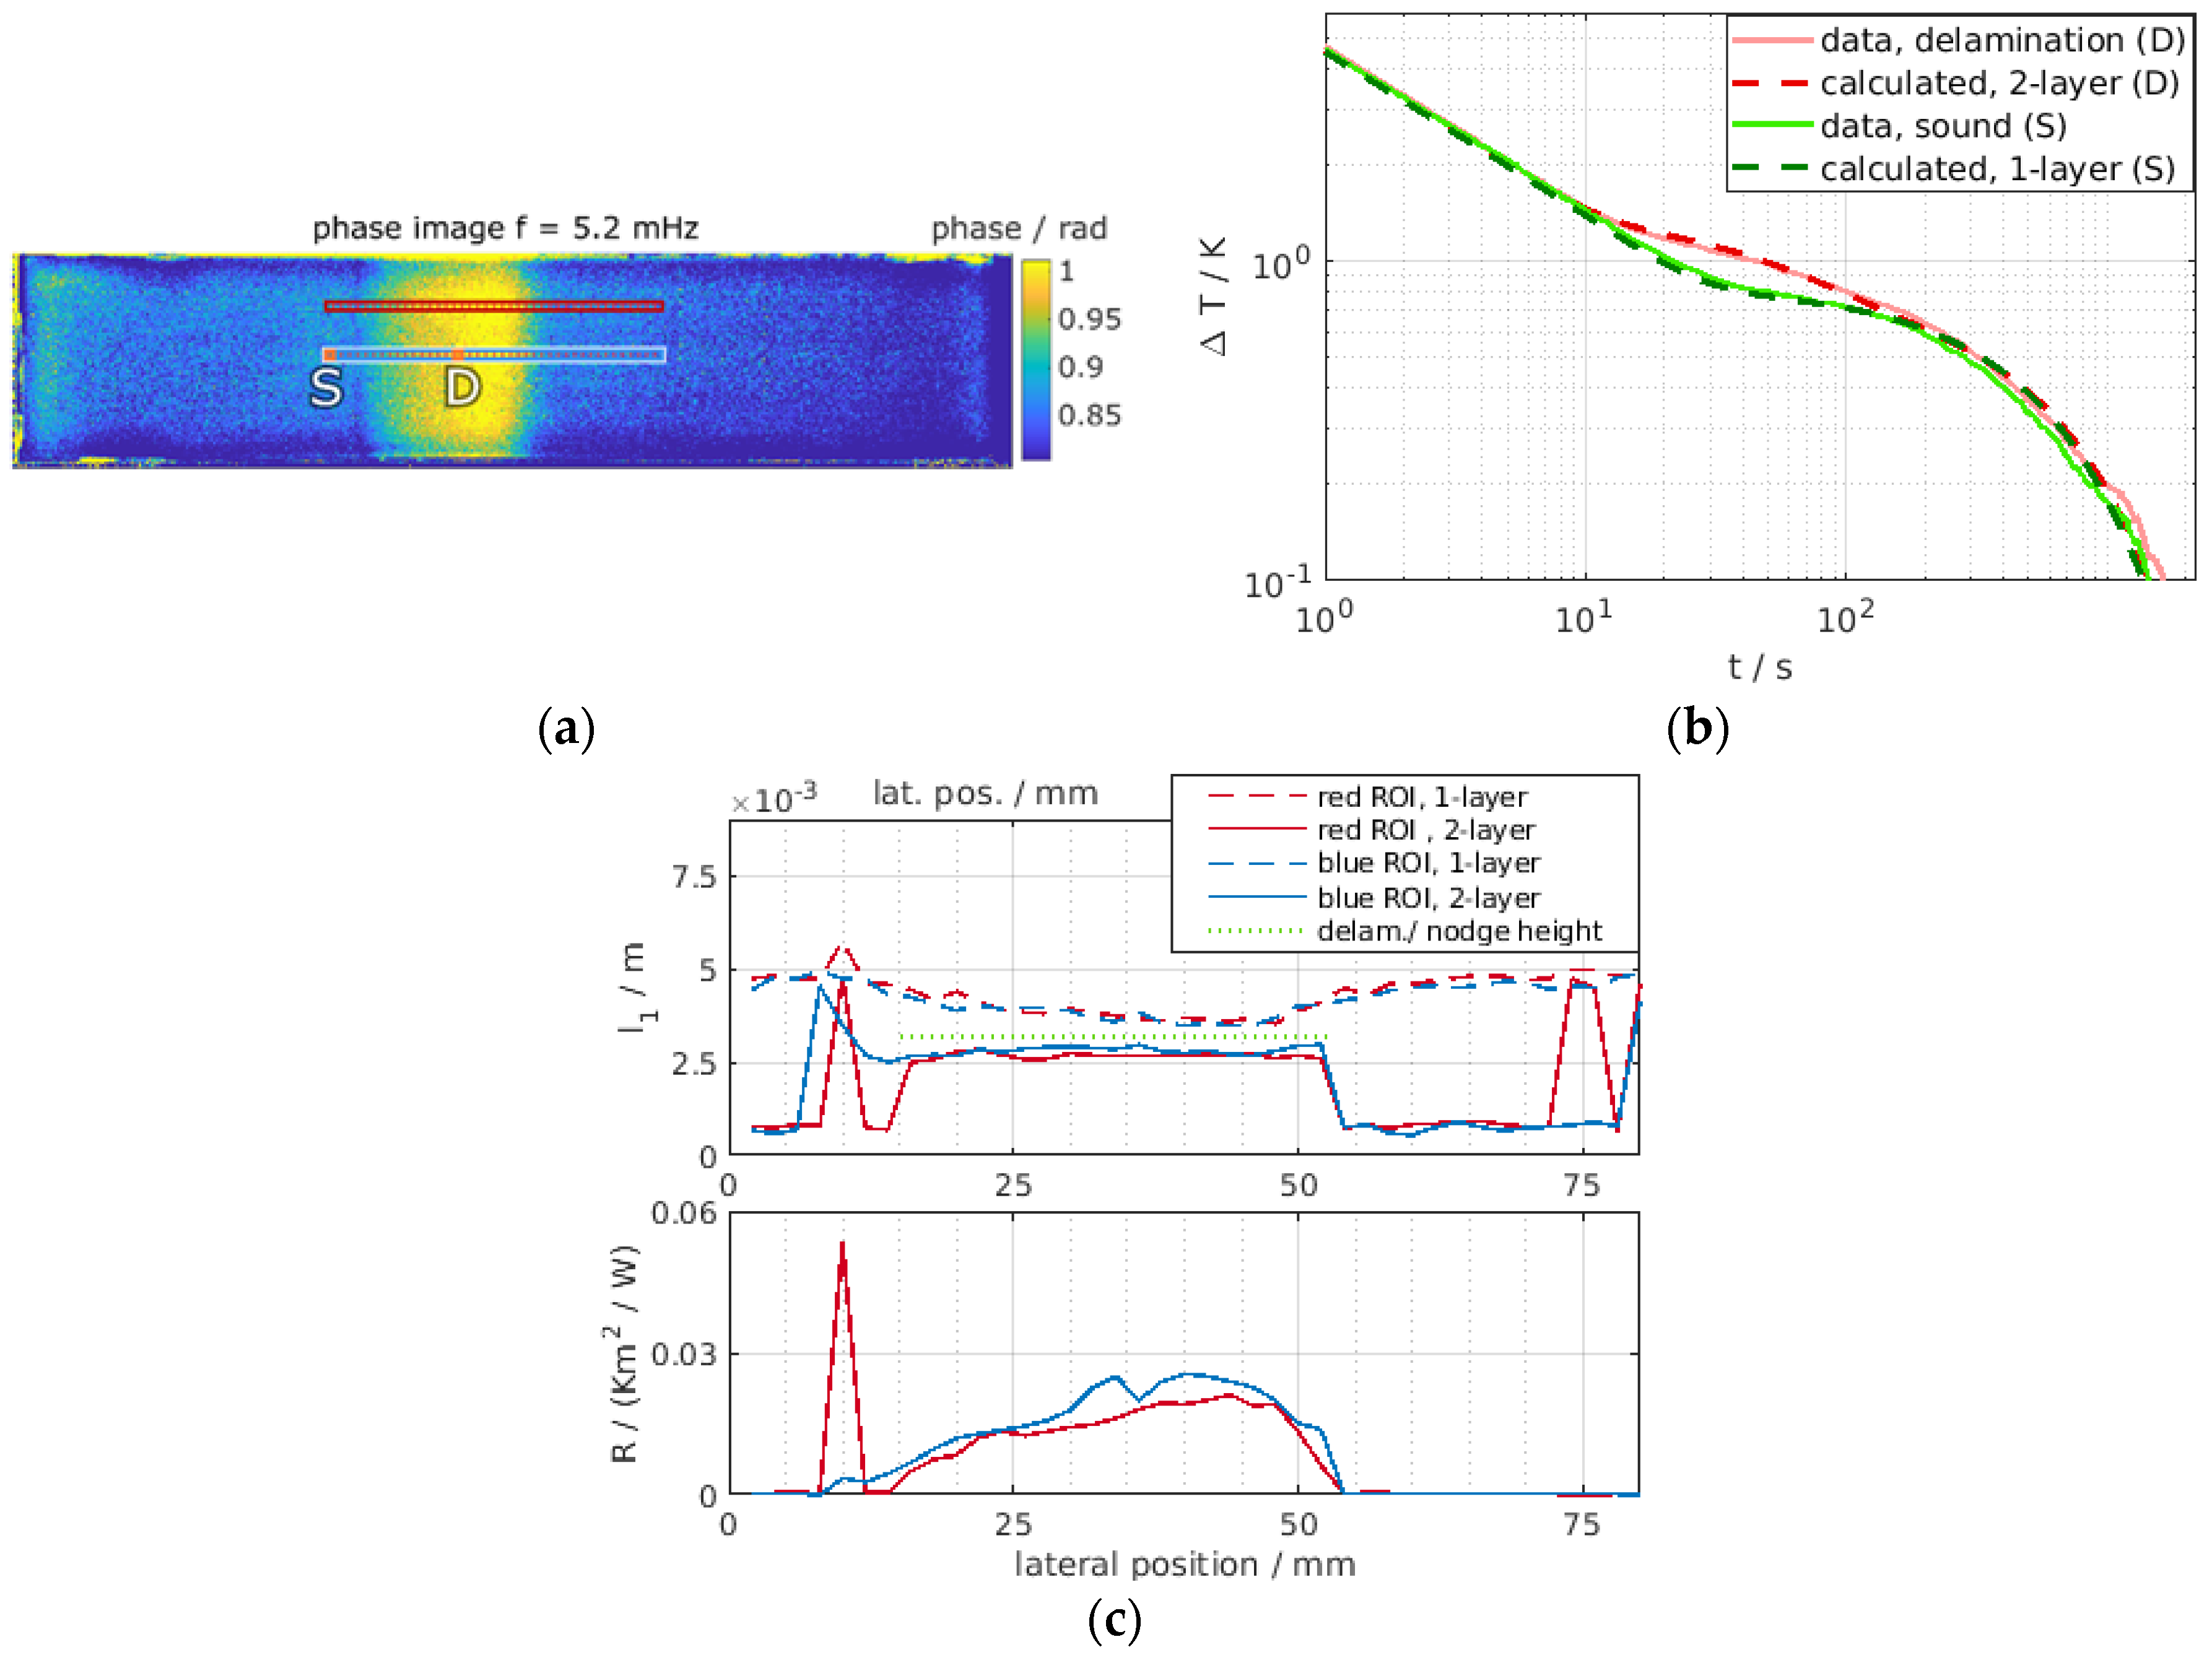
3. Results and Discussion

For defect detection, a phase image is shown in Figure 2a. As well, two lines of small ROIs (red and blue) are depicted. In Subfigure (b) the mean signal of two selected ROIs of the blue line is shown, the transient S in a sound area and D in a region with delamination. A non-linear regression of ROI S using a one-layer quadrupole model fits well the experimental data (green slashed line) and yields the following parameters: plate thickness l 1 ,and convection coefficient h , and the irradiation density Q. Leaving only h fixed, the regression is then carried out for all other ROIs along both lines. The resulting l 1 is plotted in Subfigure (c) for both lines over the position on the sample. In sound areas the plate thickness is matched well, but not in the region with the delamination. Now, the delamination may be modelled by a 2-layer quadrupole simulation, leaving l 1 and R as free parameters, l 1 + l 2 is left fixed at a typical fitted depth of the 1-layer model, amounting to 4.8 mm. The two parameters are depicted in Figure 2c with solid lines. The resulting modelled transient is also shown in Subfigure (b) for the ROI D. Both modelled transients match the experimental data well. The two-layer simulation yields a parameter R in the range of 0.015 Km²/W and a delamination depth 2.7 mm, this resembles the constant delamination depth visible in the photo Figure 1b. R is highest in the centre of the delamination and right over the notch. For all R > 0.005   Km 2 / W , the parameter l 1 stays roughly at this value – in contrast to the result of the 1-layer model. The sound area is well described by the 1-layer model, the delamination and the notch by the two-layer model. Strictly spoken, the 2-layer model does not cover modelling the notch. Nevertheless, the residual wall thickness is matched well, lateral heat flows are covered by the parameter R . All values of l 1 are by 10% smaller than the delamination depth measured by the photo.

4. Conclusions

The depth of a delamination in a GFRP sample has been estimated by 1-D simulations using a one- and two-layer quadrupole model. For region of interests within the delamination a pair of parameters is calculated, the delamination depth l 1 and the thermal resistance R . Lateral heat flows do not influence l 1 , but lead to an alteration of the parameter R . Hence this parameter does not directly resemble the local thermal resistance of the delamination. Overall, the thickness of the plate and the depth of the notch and delamination are estimated well.

Funding

This research received no external funding.

Conflicts of Interest

The authors declare no conflict of interest.

References

  1. Ibarra-Castanedo, C.; Maldague, X. Pulsed phase thermography reviewed. QIRT. J. 2004, 1, 47–70. [Google Scholar] [CrossRef]
  2. Shepard, S.M.; Lhota, J.R.; Rubadeux, B.A.; Wang, D.; Ahmed, T. Reconstruction and enhancement of active thermographic image sequences. Opt. Eng. 2003, 42, 1337–1342. [Google Scholar] [CrossRef]
  3. Oswald-Tranta, B. Comparison of time and frequency behavior in TSR and PPT evaluation. In Proceedings of the SPIE Commercial + Scientific Sensing and Imaging 2016, Baltimore, MY, USA, 17–21 April 2016; pp. 1–13. [Google Scholar]
  4. Balageas, D.; Roche, J.-M. Taking into account heat losses in front-face pulse IR thermography experiment for thermal diffusivity identification. In Proceedings of the 14th Conf. QIRT, Berlin, Germany, 25–29 June 2018. [Google Scholar]
  5. Maillet, D.; André, S.; Batsale, J.-C. Thermal Quadrupoles; Wiley: Hoboken, NJ, USA, 2000. [Google Scholar]
  6. Müller, J.P.; Krankenhagen, R. Optimizing thermographic testing of thick GFRP plates by assessing the real energy absorbed within the material. Comp. Struct. 2019, 215, 60–68. [Google Scholar] [CrossRef]
  7. Feuillet, V.; Ibos, L.; Fois, M.; Dumoulin, J.; Candau, Y. Defect detection and characterization in composite materials using square pulse thermography coupled with singular value decomposition analysis and thermal quadrupole modeling. NDT E Int. 2012, 51, 58–67. [Google Scholar] [CrossRef]
  8. Gower, M. EMRP Project ENG 57, Final Report. Available online: https://www.euramet.org/research-innovation/search-research-projects/details/?eurametCtcp_project_show%5Bproject%5D=1266 (accessed on 27 May 2019).
  9. Maierhofer, C.; Krankenhagen, R.; Röllig, M.; Rehmer, B.; Gower, M.; Baker, G.; Lodeiro, M.; Aktas, A.; Monte, C.; Adibekyan, A.; et al. Defect characterisation of tensile loaded CFRP and GFRP laminates used in energy applications by means of infrared thermography. QIRT. J. 2018, 15, 17–36. [Google Scholar] [CrossRef]
  10. Krankenhagen, R.; Worzewski, T.; Maierhofer, C. Cooling-down of thermal thick probes after flash excitation—A measure for the real energy density? Infrared Phys. Techn. 2015, 72, 258–265. [Google Scholar] [CrossRef]
  11. Maldague, X.; Marinetti, S. Pulse phase infrared thermography. J. Appl. Phys. 1996, 79, 2694. [Google Scholar] [CrossRef]
  12. Bernegger, R.; Altenburg, S.J.; Röllig, M.; Maierhofer, C. Applicability of a 1D analytical model for pulse thermography of laterally heterogeneous semitransparent materials. Int. J. Thermophys 2018, 39, 1–17. [Google Scholar] [CrossRef]
Figure 1. (a) Four flashes were used in the set-up in reflection geometry. (b) GFRP specimen depicted from the side, the delamination starts right at the edge of the notch. (c) Parameters used for the one and two-layer quadrupole model, beside the material parameters.
Proceedings 27 00040 g001
Figure 2. (a) Phase image of the sample, the lines of ROI investigated are marked. (b) Measured transient in ROI and fitted signal for a sound area (S) and over the delamination (D), locations marked in (a). (c) Parameters l 1 and R at two lines on the specimen, for the one layer and two-layer model. A green dotted line depicts the estimated depth of the delamination.
Proceedings 27 00040 g002

