1. Introduction
When dealing with masonry bridges, in particular those made of reinforced concrete, material fractures (cracks) are one of the most important damages to be considered for assessing the bridge integrity. A technique allowing to estimate the depth of a crack is highly desirable, because it would allow to discard shallow cracks and concentrate the inspection to deeper ones, an action impossible to conduct “by the naked eye”.
This work has been developed in the framework of a research project aimed to set-up procedures involving several imaging techniques, such as photogrammetry, 3D scanning, fluorescence lidar and thermography, as a support for the diagnostics on railway bridges. In particular, here we present the results obtained using laser-induced (also called “laser-spot”) thermography on selected specimens of brick and concrete.
The latter is an active technique employed for detecting the presence of cracks in metallic specimens [
1,
2], also called flying-spot camera or flying-spot laser thermography when the laser beam scans a surface in a more or less automatic way [
3,
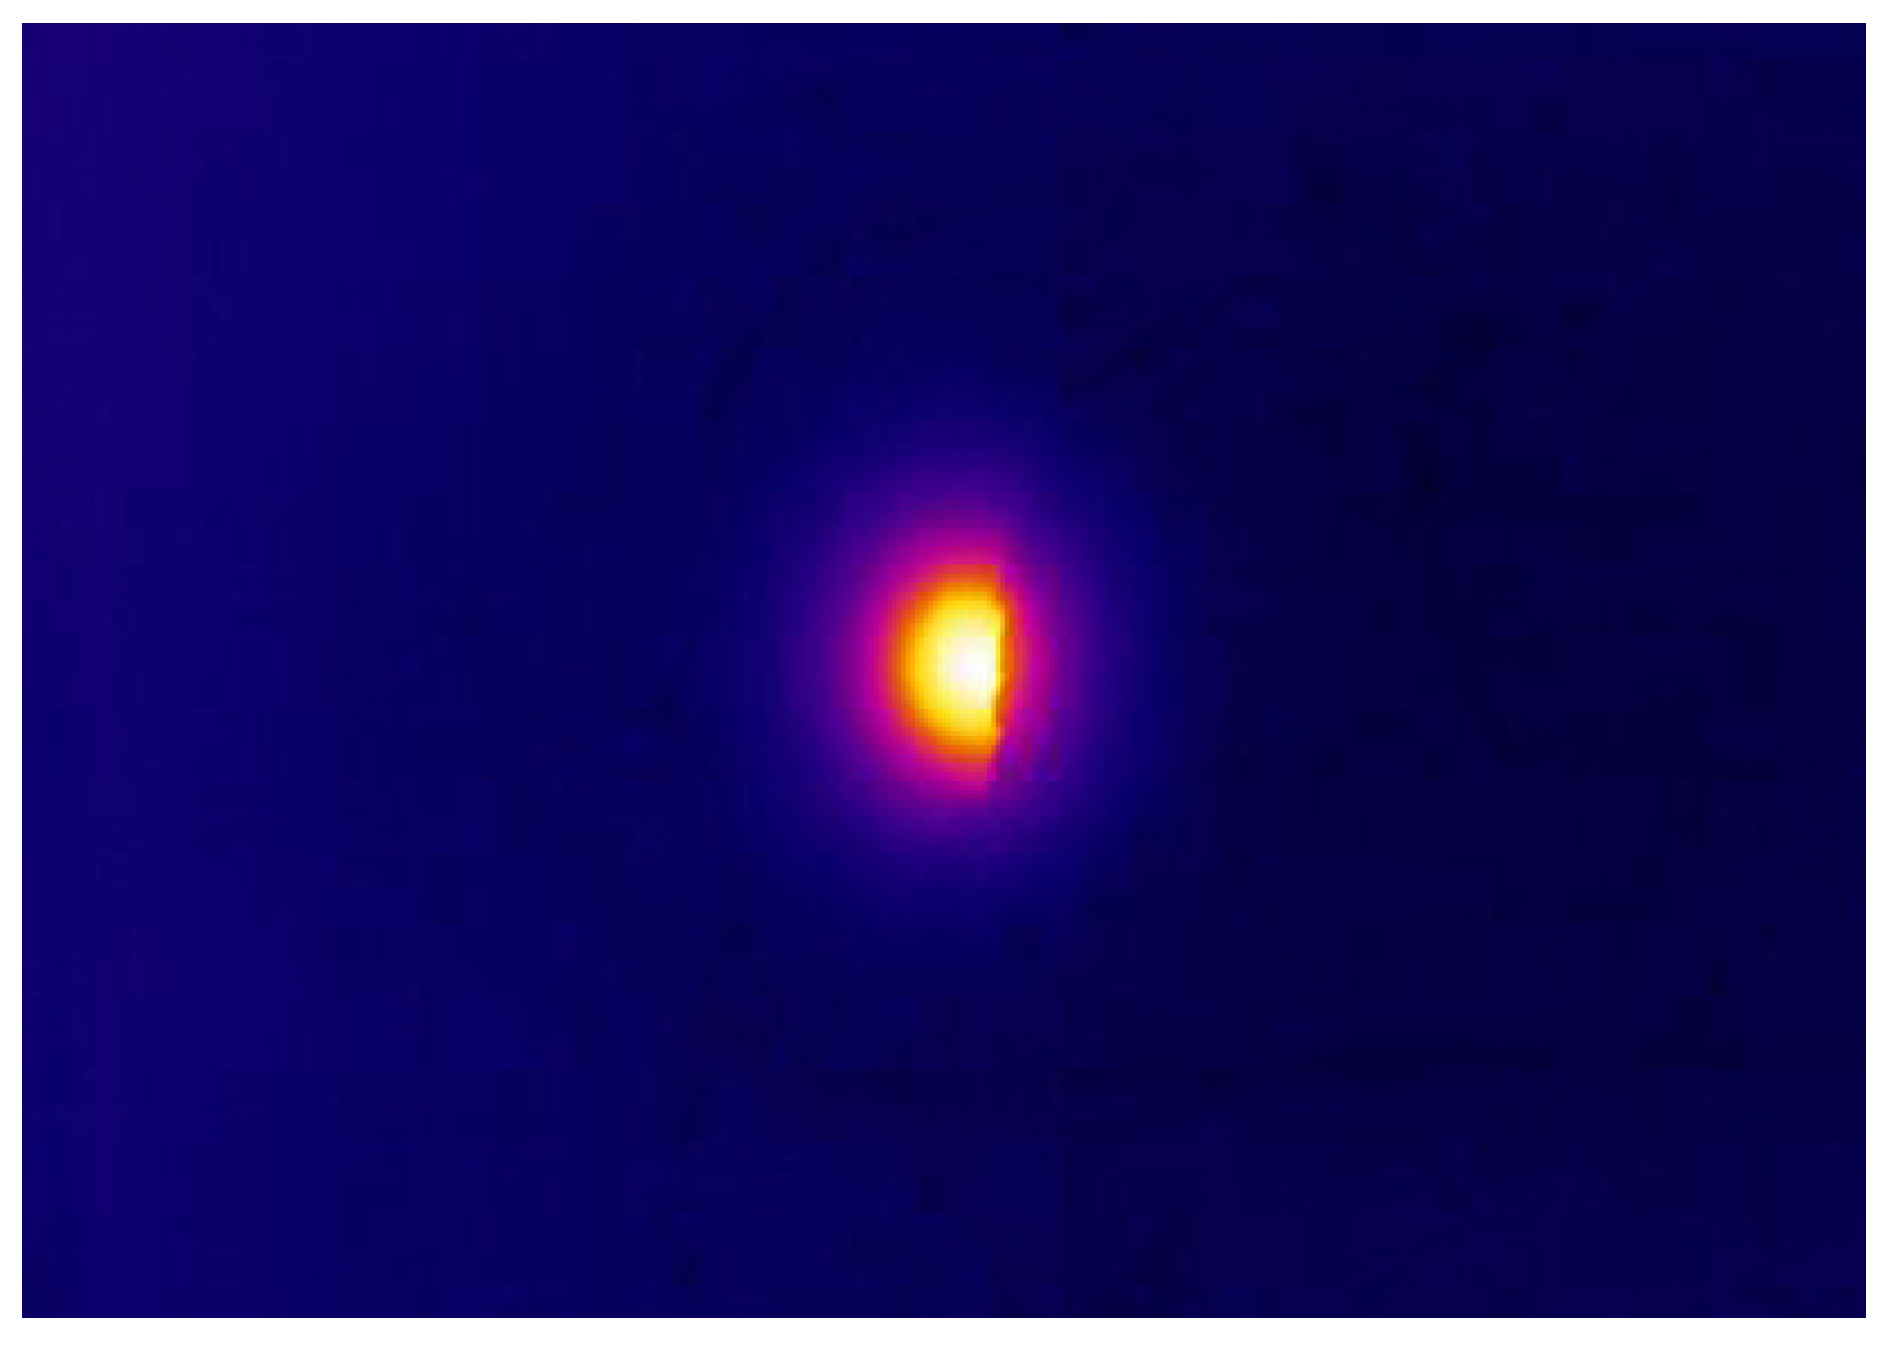
4]. The technique consists in heating a very small area of a material by means of a laser source. A fracture, being air-filled, is almost thermally insulating. Therefore, if the laser illuminates a side of it, the resulting surface temperature, after a suitable time, is highly asymmetrical (
Figure 1).
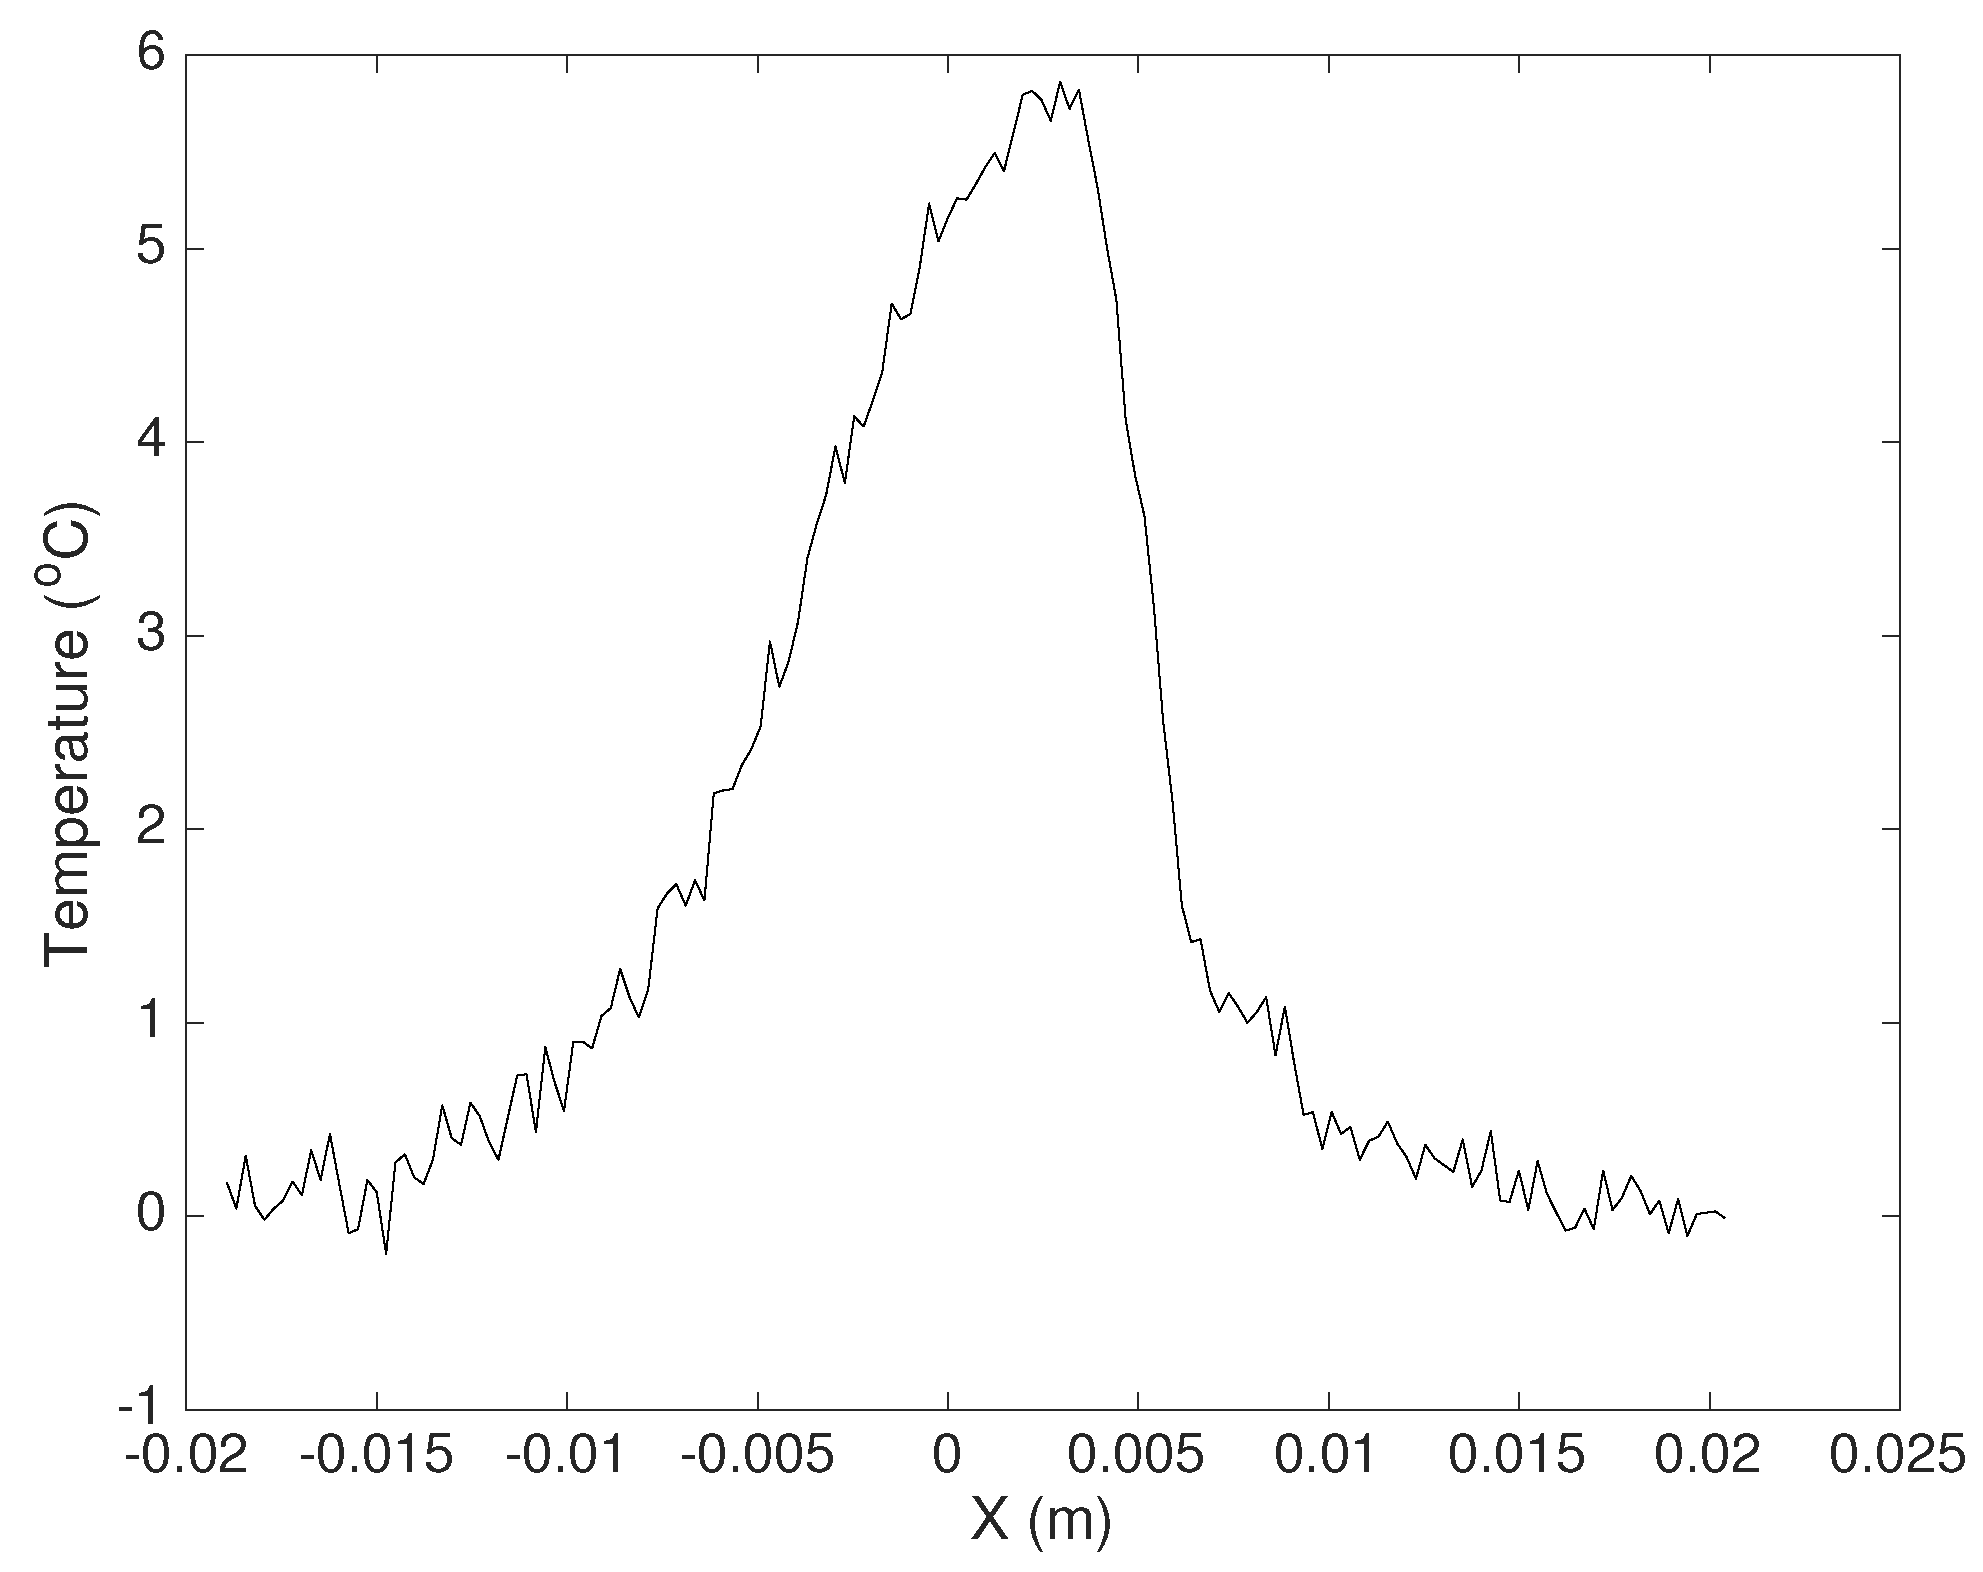
That is more evident if we plot the temperature on the symmetry axis of the laser spot, as shown in
Figure 2. The crack depth can be estimated from the temperature on such an axis, measured at suitable times after turning OFF the laser source, by means of a mathematical model briefly described in the following section.
2. Results and Discussion
Figure 1 shows a temperature map acquired 20 s after the laser source power OFF, by means of a thermo-camera FLIR T1020 equipped with the standard lens (focal length 36 mm, FOV
. The laser source employed in the experiments is a pulsed laser working at wavelengths 532 nm and 1064 nm, with an average energy of about 40 mJ per pulse (mix of the above two wavelengths). The pulse frequency was 20 Hz, such to give an average output power of about 0.8 W, corresponding to a power density of about 1.6
at the target.
The procedure for determining the crack depth from the experimental data consists in: (1) transforming experimental data from 3D to 2D; (2) developing a 2D finite-element (FE) model of the specimen (using COMSOL Multiphysics [
5] and computing the
[
6]); (3) using the temperature gap across the crack as an input to the
to obtain an estimation of the fracture depth.
The model is based on a theorem (Humps Theorem, HT) [
7] establishing a relationship among the temperature values across the crack (temperature gap) and the temperature at the same points in absence of the crack (background temperature). From the HT, denoting by the subscripts “1” and “2” the temperatures at such points, we obtain the following relation among the temperature
u of the cracked specimen and the background temperature
v:
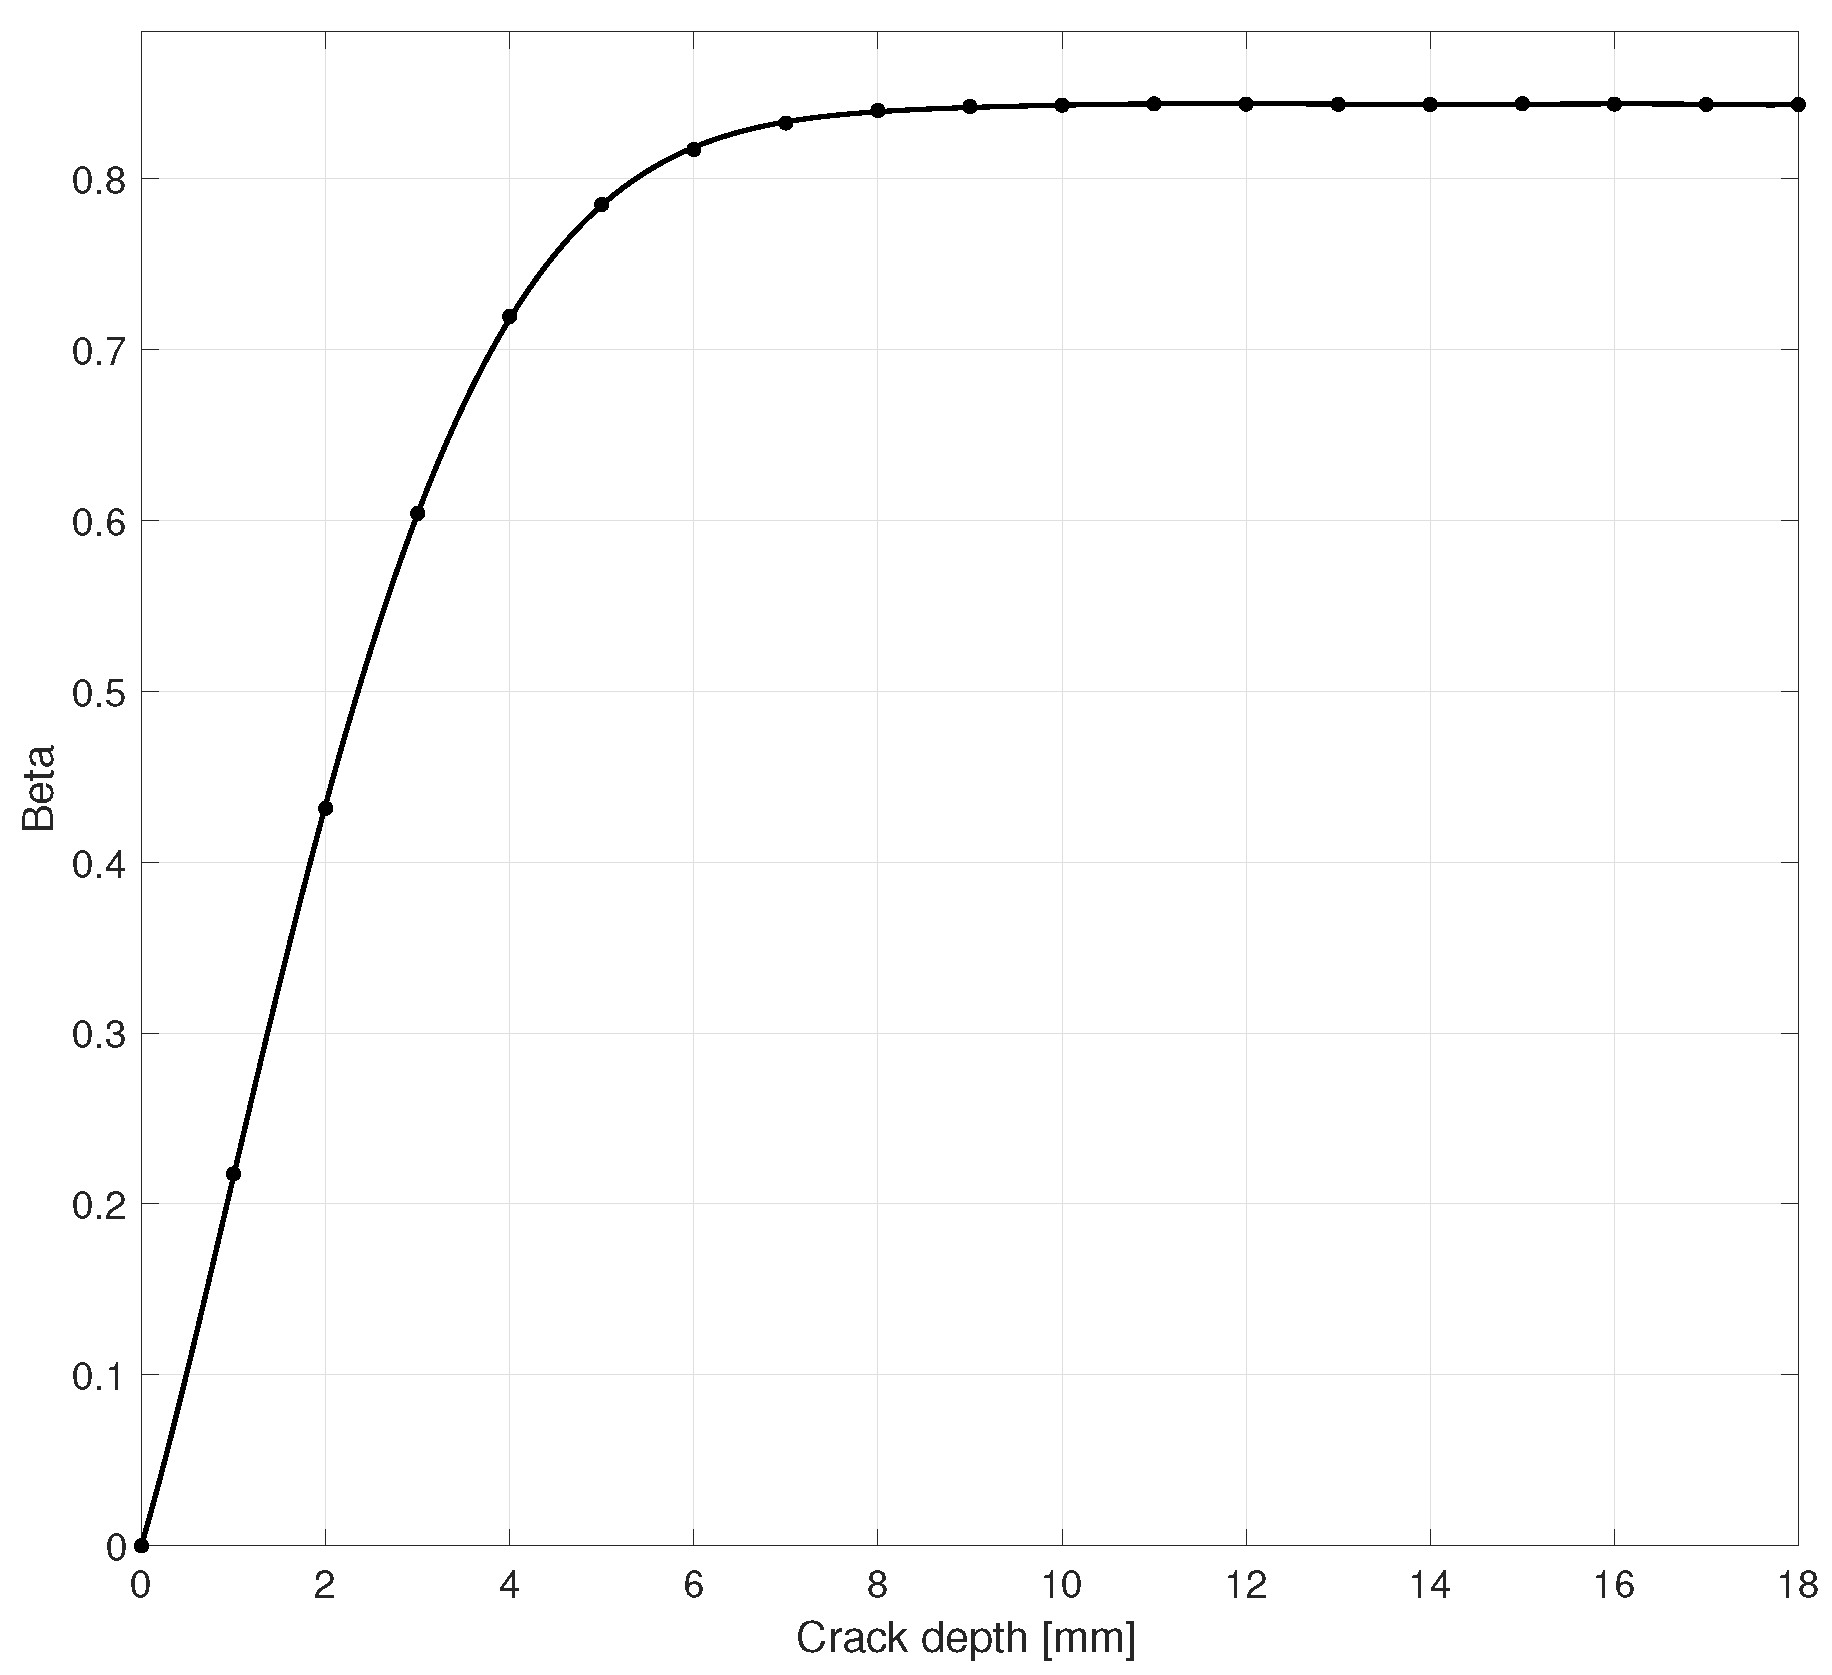
The value of
obtained from (
1) is used as an input into the curve constructed by the FE model for regular, vertical cracks of given width (
and
are experimental measured values).
Figure 3 shows such a curve, computed varying the crack depth.
The construction of the requires a knowledge of the physical characteristics of the material under investigation, in particular its density, specific heat and thermal conductivity. An uncertainty in the true value of such parameters reflects on a systematic error on the crack depth obtained by the . However, the correctness of such parameters can be easily tested by comparing the measurements obtained on a sound part of the specimen with FE simulation results.
All the theoretical development assumes a two-dimensional geometry and, correspondingly, a 2D physics. Actual cracks are essentially two-dimensional, because their extension is usually very large compared to their width and to the laser spot size. Nevertheless, the shape of the laser spot on the specimen surface is far to be one-dimensional, as the mathematical model - assuming a continuous line-source - would require [
6]. Instead of developing a three-dimensional model (feasible in principle, but computationally heavy), we prefer to transform 3D experimental data into “equivalent” 2D data. That is possible if we are interested in data belonging to the symmetry plane of the laser source, taken as the
plane of the 2D model. Referring to [
6] for the details of the transformation procedure, the equivalent 2D temperature
is obtained by the real 3D temperature
by means of the Green’s functions (source solutions) in the 2D and 3D cases, respectively.
Equation (
2) comes from the relationship among the continuous-source Green’s functions for 3D (point-source) and 2D (line-source) half-spaces, that for a homogenous medium (without cracks) are respectively:
where
and
, with
expressing the temperature on the plane
due to a continuous point-source in
and, analogously,
expressing the temperature on the line
due to a continuous line-source in
.
and
are expressed in terms of combinations of error functions and exponential-integral functions [
6].
Assuming a “rectangular” laser source of width
on the plane (line, in the 2D case)
, we can compute the temperatures
and
, by convolving the Green’s functions (
3) and (
4) with the laser power function
(
in the 2D case) which is located on the
. In particular, on the “accessible” surface
:
The relationship (
2), which is rigorously true in absence of the crack, eventually comes out assuming the approximate correctness of the
model for the cracked 2D-region, on the
x axis (
being the crack abscissa):
relating the temperature
in the cracked case with the (background) temperature
in the homogeneous case.
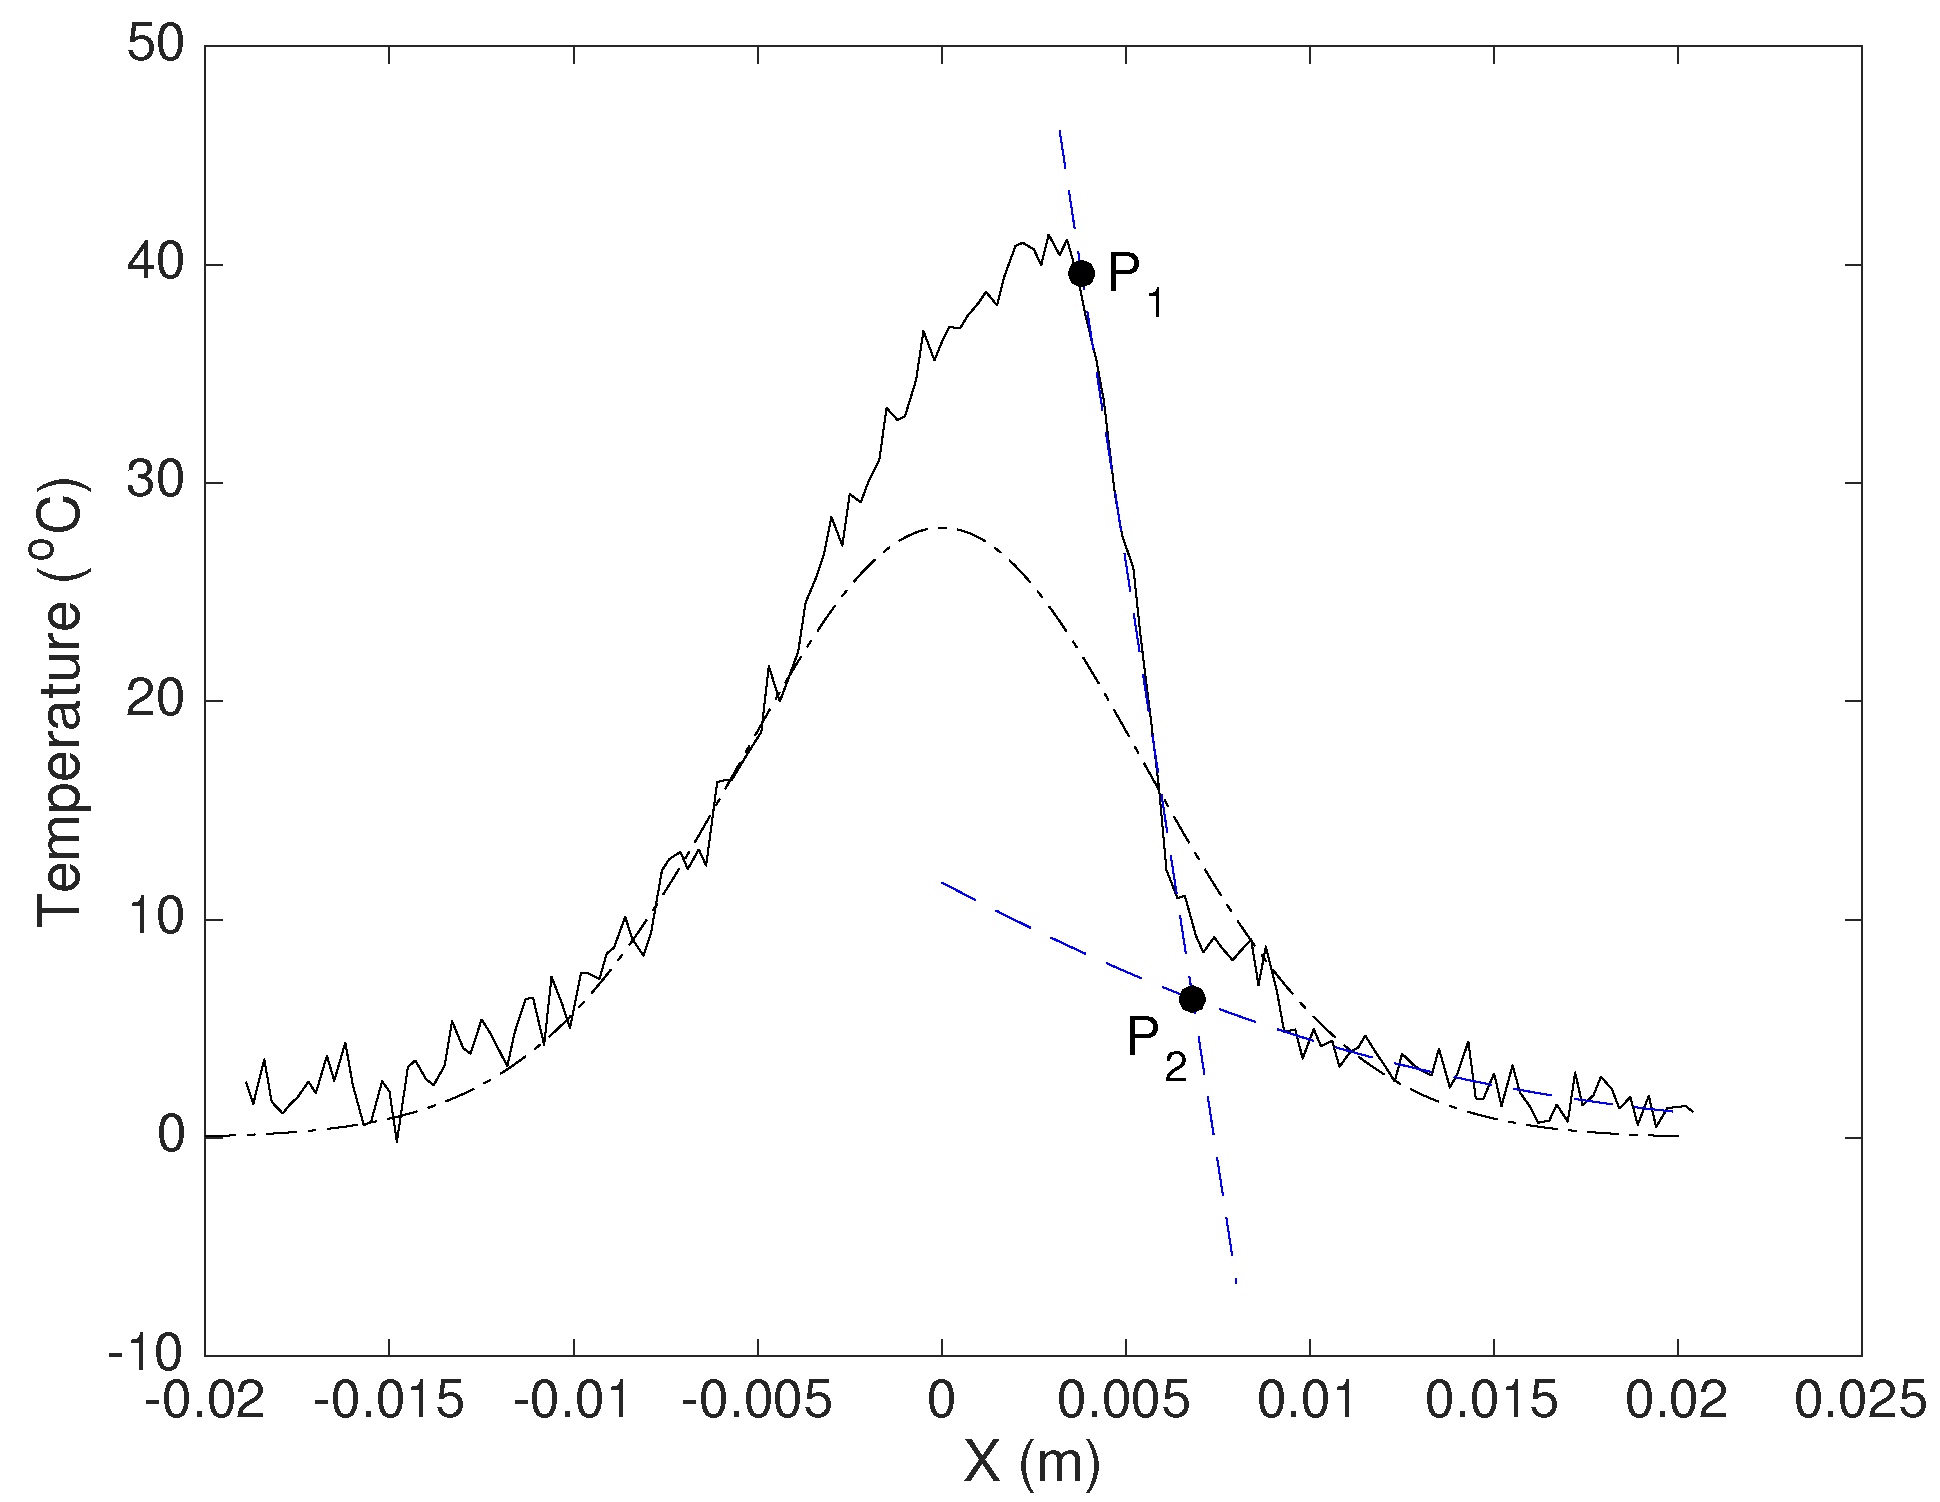
Figure 4 shows the equivalent 2D temperature computed from the data of
Figure 2. A piecewise interpolation is performed, based on the following reasoning. We know that the temperature behavior immediately at the right of the crack edge should be a gaussian, and that the temperature drops off linearly across the crack. Therefore, the procedure consists in fitting a gaussian on the data immediately at the right of the temperature “anomaly” (discrepancy among model and experiment), and perform a linear fitting on the data across the crack opening, as shown in
Figure 4. The crossing
among those fitting curves identifies the right edge of the gap. Eventually, we are able to compute the
value (
1) in terms of the temperatures in
and
, which is 0.71, giving a depth of 4 mm, slightly under-estimated with respect to the actual depth (measured by means of a thin paper sheet to be of the order of 5 mm). Such an under-estimation is expected because real cracks usually shrink with depth, and the
model computes the depth of an equivalent constant-width fracture.
The whole procedure (3D-2D transformation of data; gaussian fitting; ) can be repeated at several measurement times, to obtain a more robust estimation of the crack depth.

