Abstract
The holistic modelling approach required for the long-term integrated urban energy planning is becoming a big challenge since the complexity of cities, as well as their commitments are increasing rapidly. Many municipalities require technical support during the definition of the direction of their long-term energy transition plans. Innovative modelling approaches and the ex-ante impact assessment are necessary steps of the process since the direction adopted by the city will have many long-lasting implications not only in the energy and climate dimensions but also in their social and economic development. This paper presents the overall methodological and modelling approach and the initial results of the developed Advanced Integrated Urban Planning process that has been validated by its application in the cities of Helsinki, Hamburg and Nantes.
1. Introduction
The migration of population occurred in the last decades from rural to urban areas concentrates the greatest potential for cutting emissions in our cities. Therefore, the decarbonisation of the energy system of cities is becoming increasingly urgent to achieve GHG emission reduction targets at regional and country levels. The increase of the complexity of the energy system of cities generates also an increasing necessity of quantitative assessment methods based on the notion of multiple impact pathways which can provide quantitative criteria that municipalities can use for the definition of the direction of their long-term city energy strategy. Although this type of approaches are traditionally used at regional and national scales, they are not commonly used by municipalities due to the complexity associated to their adaptation to the city scale. The methodology described in this paper has been developed in the framework of the mySMARTLife project and has been applied in the three Lighthouse cities (Helsinki, Hamburg and Nantes) in a way that will facilitate the replication of the foreseen actions in other cities out of the scope of it. This paper includes a description of the case study of Helsinki focused on the phases one and two of the methodology.
2. Methodological Approach
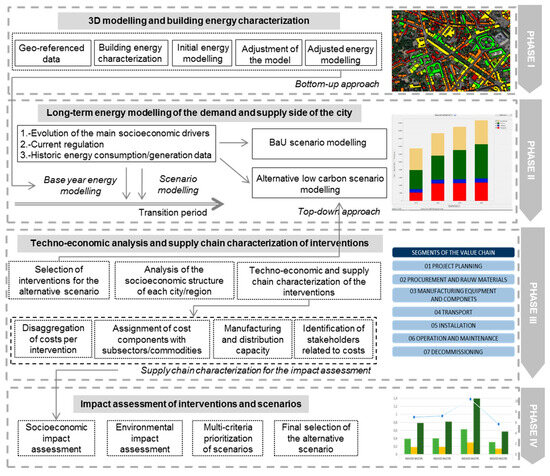
The energy modelling methodology described in this section is integrated in a wider urban transformation planning approach. More precisely, it represents the most technical part of the planning process and complements other non-technical evaluations that run in parallel to this methodology. The methodology proposed is composed by the four main phases of the figure below (Figure 1).

Figure 1.
Main phases of the long-term urban energy modelling approach.
2.1. Phase I: 3D Modelling and Buiding Energy Characterzation at City Level
The first phase of the methodology is focused on the bottom-up energy characterization of each building of the city using tools such as the Enerkad software [1]. Enerkad is an open source QGISv3 plugin that extracts automatically from the cadastral map of the city the main data of each building for calculating their energy demand. Enerkad generates energy demand profiles following a ‘bottom-up’ perspective [2] and based on an improved Degree-Days method [3]. Once the initial energy characterization of the building stock of the city is completed, a sensitivity analysis for the most relevant parameters used in the energy assessment is carried out to identify the most critical ones which can generate the main sources of errors in the results. This entire sensitivity analysis procedure for the results obtained with Enerkad is well documented [4]. The last step is focused on the adjustment of the model by comparing the results obtained respect to different city information sources, as well as respect to the monitoring data of some specific buildings of the city.
2.2. Phase II: Long-Term Energy Modelling of the Demand and Supply Side of the City
The second phase is focused on the top-down simulation of the energy demand and generation for the next decades in each city including not only the built environment (already evaluated in phase I) but also the rest of the sectors such as the industry or transport. The main objective is to evaluate the potential changes that cities can face in the next decades as a consequence of demographic, economic and social unfolding, political actions, and external changes. In this case other type of top-down modelling approaches are necessary. Tools such as LEAP [5] can be used in this phase for the definition and the analysis of several alternative long-term low-carbon scenarios. In a first step the energy matrix of the city is characterized for the base year defined for the analysis. This provides the basis for the definition of the long-term Business as Usual (BaU) scenario which considers the potential evolution of the energy demand of the city taking into account also the effects of the evolution of the main socioeconomic drivers of the city such as the population, the GDP or the energy price. This BaU scenario serves as a reference for the analysis of the improvements that would be obtained by the city when deploying specific interventions in the alternative low-carbon scenario.
2.3. Phase III: Techno-Economic Analysis and Supply Chain Characterization of Interventions
In this phase a supply chain analysis is carried out for the interventions that are considered in the alternative low-carbon scenario. The characterization is based on a simplification of the method described in [6,7]. In a first step, an analysis of the socioeconomic structure of each city and its corresponding region is carried out to define the sectoral disaggregation (sectoral value added, production and employment) that is required for the supply chain analysis. Then, a disaggregation of the cost components that form each intervention and the assignment of each cost component with the corresponding subsector or commodity is carried out. In a following step an analysis of the existing capabilities at city/regional scale for the manufacturing and distribution of each component is carried out and the main stakeholder related to each cost component is identified. The result of this phase will be the specific “shocks” which represent an increase of the production of the corresponding subsectors in the city and region. This will serve as main input for the scenario generation in the macroeconomic modelling.
2.4. Phase IV: Impact Assessment of Interventions and Scenarios
In this phase the impact assessment of each intervention and scenario is carried out based on the inputs of the previous phases. On the one hand, the shocks created in the third phase are used to evaluate the potential impact associated to each intervention in terms of the direct, indirect and induced effects generated in the development of several socioeconomic characteristics of the cities/regions such as the increase of the GDP, the sectoral production or the employment. The methodology proposed for the generation of the macroeconomic model of the city is based on an estimation methodology for regional SUTs at city level according to the CHARM method [8] as laid down in Kronenberg (2010) [9] and Többen and Kronenberg (2015) [10]. Finally, the results of this socioeconomic impact assessment are combined with the energy and environmental impact analysis, as well as with the results of the phases one and two (which provide an idea of the deployment potential of each type of intervention in the city) to provide extra criteria for the prioritization of the technologies and scenarios. Here, a multicriteria methodology is used to compare and prioritize the different scenarios of each city.
3. Case Study and Results
3.1. Case Study Description and Building Energy Characterization
Helsinki is the capital of Finland located in the southern Finland on the coast of the Baltic Sea. It has a humid continental climate with an average outside temperature of −3.97 °C in January and 16.05 °C in August. The population of Helsinki has been growing rapidly. At the end of 2016, Helsinki had 635,000 inhabitants. The surface area of the city is 686.2 km2, of which 186.7 km2 is land area. From the socioeconomic point of view, Helsinki region produces more than the 30% of Finland’s gross national product. Its median household disposable income is 32,720 € and the unemployment rate 11.90% [11].
The building energy characterization carried out for the city has a double approach. First a small area of the city (Merihaka area with more than 80,000 m2 of mixed residential and office use) is evaluated. In a second step the building stock of the entire city is evaluated in detail (residential buildings 57%, commercial buildings 4%, office buildings 12%, industrial buildings 7% and other tertiary buildings 16%) [12]. The main information sources for the construction of the geometry and the semantics of the city energy model have been obtained from the CityGML of the buildings of the city [13], the 3D city information model service as open data [14], and the Web Feature Service (WFS) Interface [15] for the 2D footprints of buildings that were facilitated by the municipality of Helsinki. The energy model generated for the city is evaluated through a sensitivity analysis for the most relevant parameters as it is detailed in [4]. Finally, the adjustment of the model is carried out by contrasting the modelling results obtained for each building typology (by building use and by construction period) respect to existing energy data in the city. The existing building energy consumption data in the Energy and Climate Atlas of the Helsinki 3D Model (which combines estimations for most of the buildings and real measured data for city owned buildings) has been combined with the results of the literature review [16,17] for the adjustment phase. The main parameters of the model adjusted in the process are the thermal transmittance values of the envelope elements of the buildings, the air changes per hour [18], the internal gains (equipment, occupancy, lighting) [19] and the window to wall surface ratio [20]. The table below shows the main energy characteristics obtained in the model for the residential and tertiary buildings (Table 1).

Table 1.
Modelling results (heating, DHW and electricity demand) for the buildings of Helsinki.
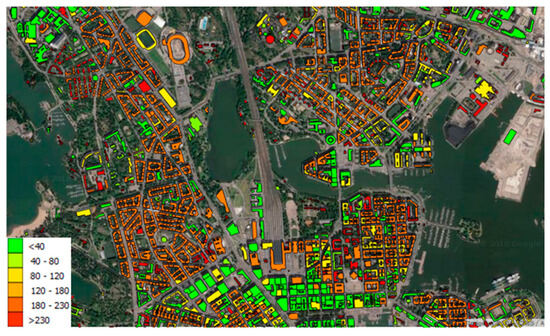
Although there are considerable discrepancies between the different information sources, modelling results show an average difference of 18% for heating and 8% for DHW respect to the literature data. Besides, an average difference of 7% is observed for residential heating respect to the monitoring data available. The figure below shows the example of the heating energy demand (Figure 2).

Figure 2.
Modelling results for the heating demand (kWh/m2 year) of the buildings of Helsinki.
3.2. Base Year City Energy Balance
The main energy data of the city has been provided by the local government for the base year 2016. In the demand side, this information has been disaggregated by sectors completing the model with other information sources such as the database of the City Performance Tool [21]. Residential sector has been disaggregated by subsector; private residences (84%) and city owned buildings (16%). The disaggregated energy data for the residential sector has been completed by using the data generated by the modelling phase described in the Section 3.1. Final energy consumption in residential accounts for 5738.2 GWh in the base year. Heat from the district heating network is the most used fuel with 70.9%, followed by electricity (26.4%) and diesel (2.6%). In the services and municipality sector the electricity represents the main energy consumed (52.25%), followed by heat from the district heating (46.96%) and diesel (0.79%). The electricity consumption of street lighting is 46.8 GWh [21,22]. In the transport sector, road transport sums up 2133.8 GWh, while rail transport accounts for 1876.6 GWh. Cars are the most-consuming vehicle type in road transport and represent 63.79% of the energy use in this subsector. Although electricity is the most consumed fuel in the transport sector (47.12% in opposition to 26.75% gasoline and 25.88% diesel) it only represents 0.65% in the road transport against 50.28% gasoline and 48.61% diesel.
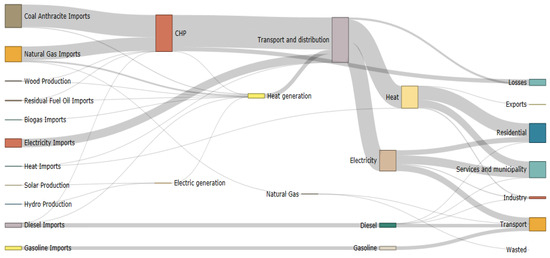
Regarding the supply side, heat produced in Helsinki’s district heating network represents 92.23% of the heat consumption in the city [23]. Other plants considered in the analysis are the Katri Vala plant (90MW), the heat only boilers plants (2.111 MW) which consumes light fuel oil (1.57%), heavy fuel oil (17.58%), hard coal and anthracite (25.48%), natural gas (55.13%), wood pellets (0.15%), and biogas (0.09%), and the CHP plants with (116MW for heat generation) which consumes light fuel oil (0.02%), heavy fuel oil (0.32%), hard coal and anthracite (60.80%), natural gas (37.2%) and wood pellets (1.66%). Regarding the electricity generation, the Suvilahtic (0.34MW) and Kivikko PV (0.85) plants [24], as well as the hydro power plants (0.4 MW), the Kellosaari oil plant (120 MW) and the CHP plants (1008 MW) are included in the analysis. The figure below shows the Sankey diagram with all the energy fluxes of the city for the base year (Figure 3).

Figure 3.
Sankey diagram of Helsinki in 2016.
3.3. Long-Term Energy Scenario Modelling
The scenario described in this section represents the intervention replication scenario which considers the effects of the deployment of some specific interventions selected by the city for this analysis. As a first step, the reference scenario is modelled for the city. This scenario considers the evolution of the energy consumption of the city in the case that no additional low-carbon measures are implemented. This scenario evaluates the evolution of the energy consumption of each sector based on the relation with specific parameters and socioeconomic drivers. The driver associated to each sector is the following: m2 of households for residential [21], the electricity price for the industrial [25], the GDPP [26] for service and municipality, the population for the public transport, the car fleet for the road private transport, and the GDP for the freight transport. Based on this reference scenario, the intervention replication scenario is modelled by considering the effects of the deployment of the interventions described in the table below (Table 2).

Table 2.
Intervention selection and scale-up criteria for the intervention replication scenario.
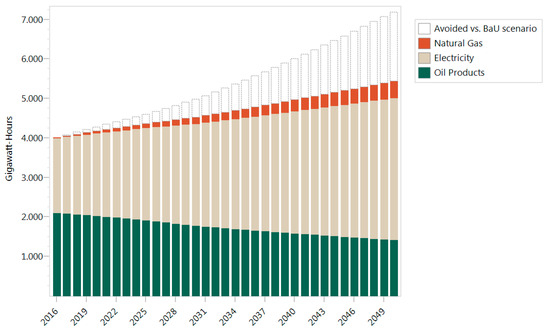
The figure below (Figure 4) shows the total energy demand in final units of the intervention replication scenario respect to the reference scenario. The expected energy consumption reduction (17% at the end of the period) due to the implementation and replication of the interventions selected in the project can be clearly appreciated. It needs to be considered that this scenario only contemplates the deployment of some specific interventions selected by the city for this analysis. Therefore, there are many other interventions that can be implemented in Helsinki during the following years which have been disregarded. This is an aspect that needs to be carefully dealt with when comparing the improvement potential provided in the alternative scenario to the overall targets that the city has previously defined for different time horizons.

Figure 4.
Energy consumption of the intervention replication scenario of Helsinki.
4. Conclusions
The application of the described ex-ante impact assessment methodology in all the cities evaluated has proven to be useful to provide a holistic modelling approach which generates relevant energy data and criteria. Although the data availability has been identified as a key aspect, evaluated results show that the initial phases of this methodology can be easily replicated in other cities so that they can use the generated outputs to support their entire long-term energy planning process.
Supplementary Materials
The detailed description of the methodology as well as all the data gathering process that has been necessary for this research are available in the deliverables D1.12 and D1.13 of mySMARTLife project.
Funding
The work described in this article was partially funded by the mySMARTLife project, Grant Agreement Number 731297, 2016–2021, as part of the call H2020-SCC-2016.
Acknowledgments
The file work for this study was conducted thanks to the active collaboration of the Climate and Environmental Management of the municipality of Helsinki, the Department SMARTCity and Innovation and Department Spatial Basic Infrastructure of the municipality of Hamburg and to the Research, Innovation and Higher Education Department of the municipality of Nantes Métropole.
References
- ENERKAD Tool. Available online: www.enerkad.com (accessed on 24 July 2019).
- Swan, L.G.; Ugursal, V.I. Modeling of end-use energy consumption in the residential sector: A review of modeling techniques. Renew. Sustain. Energy Rev. 2009, 13, 1819–1835. [Google Scholar] [CrossRef]
- CIBSE. Degree-Days: Theory and Application. Available online: https://www.cibse.org/Knowledge/knowledge-items/detail?id=a0q20000008I73TAAS (accessed on 24 July 2019).
- Oregi, X.; Hermoso, N.; Arrizabalaga, E.; Mabe, L.; Muñoz, I. Sensitivity assessment of a district energy assessment characterisation model based on cadastral data. Energy Procedia 2018, 147, 181–188. [Google Scholar] [CrossRef]
- Heaps, C.G. Long-Range Energy Alternatives Planning (LEAP) System, Software Version: 2018.1.18, Stockholm Environment Institute: Somerville, MA, USA, 2016. Available online: https://www.energycommunity.org(accessed on 24 July 2019).
- Arrizabalaga, E. Multi-Criteria Methodology for the Prioritisation of Alternative Energy Transition Scenarios of Cities. Ph.D. Thesis, University of the Basque Country, Bilbao, Spain, 2017. [Google Scholar]
- Arrizabalaga, E.; Hernandez, P.; Portillo-Valdés, L. Long Term Energy Transition Scenario Analysis for the City of Donostia: The 5th annual Sustainable Places International Conference (SP’17). Proceedings 2017, 1, 644. [Google Scholar]
- Jackson, R.W. Cross-Hauling in Input–Output Tables: Comments on CHARM. Working Paper 2014–2002, Regional Research Institute, West Virginia University. Available online: http://rri.wvu.edu (accessed on 24 July 2019).
- Kronenberg, T.H. Erstellung einer Input-Output-Tabelle für Mecklenburg-Vorpommern. Wirtschafts-und Sozialstatistisches Archiv 2010, 4, 223–248. [Google Scholar] [CrossRef]
- Többen, J.; Kronenberg, T.H. Construction of Multi-Regional Input–Output Tables Using the Charm Method Construction of Multi-Regional Input–Output Tables Using the Charm Method. Available online: https://www.tandfonline.com/doi/abs/10.1080/09535314.2015.1091765 (accessed on 24 July 2019).
- Eurostat. Regions and Cities. City Statistics. 2016. Available online: https://ec.europa.eu/eurostat/statistics-explained/index.php/Urban_Europe_%E2%80%94_statistics_on_cities,_towns_and_suburbs (accessed on 24 July 2019).
- Statistics Finland. Statistics Finland. Buldings and Dwellings. 2016. Available online: http://www.stat.fi/til/ras/index_en.html (accessed on 24 July 2019).
- CityGML Buildings. Available online: http://3d.hel.ninja/data/citygml/ (accessed on 24 July 2019).
- The 3D City Information Model Service as Open Data. Available online: http://kartta.hel.fi/3d/ (accessed on 24 July 2019).
- 2D Footprints of Building. Web Feature Service (WFS) Interface. Available online: https://kartta.hel.fi/ws/geoserver/avoindata/wfs (accessed on 24 July 2019).
- Tuominen, P.; Holopainen, R.; Eskola, L.; Jokisalo, J.; Airaksinen, M. Calculation Method and Tool for Assessing Energy Consumptionin the Building Stock. Available online: https://www.sciencedirect.com/science/article/pii/S036013231400033X (accessed on 24 July 2019).
- Hukkalainen, M.; Virtanen, M.; Paiho, S.; Airaksinen, M. Energy planning of low carbon urban areas—Examples from Finland. Sustain. Cities Soc. 2017, 35, 715–728. [Google Scholar] [CrossRef]
- Kemna, R.; Acedo, J.M. Average EU building heat load for HVAC equipment. Final Rep. Framew. Contract ENER C 2014. [Google Scholar]
- DesignBuilder Software Ltd. Design Builder Simulation Tool Version: 3.04.041, DesignBuilder Software Ltd.: Stroud, UK.
- Melo, A.P.; Lamberts, R. Envelope insulation and heat balance in commercial buildings. Build. Simul. 2009, 2243–2250. [Google Scholar]
- Helsinki’s 2030 Climate Technologies, City Performance Tool, March 2016. Available online: http://www.siemens.fi/pool/cc/brochures/sustainability/helsinki-cypt-report---mar-2016.pdf (accessed on 24 July 2019).
- Helsingin kaupunki, Public Works Department. Helsingin Energia, Tommi Valve, Renewing the Public Outdoor Lighting with LEDs—Feasibility Study ofthe “Helsinki LED” Project; Helsinki LED-Hanke Selvitys Ledeihin Siirtymisen Aikataul; Aalto University: Helsinki, Finland, 2015. [Google Scholar]
- Energiateollisuus ry 2017. District Heating in Finland 2016, 2017, Finnish Energy Industries. Available online: https://energia.fi/files/2144/District_heating_in_Finland_2016.pdf (accessed on 24 July 2019).
- Helen. Available online: https://www.helen.fi/aurinko/kodit/aurinkosahko (accessed on 24 July 2019).
- Eurostat. 2018. Available online: http://ec.europa.eu/eurostat/cache/metadata/en/nrg_pc_204_esms.htm (accessed on 24 July 2019).
- European Commision. Urban Data Platform. Data Sharing and Visualization Platform for European Cities and Regions. Available online: http://urban.jrc.ec.europa.eu/download-dataset (accessed on 24 July 2019).
© 2019 by the authors. Licensee MDPI, Basel, Switzerland. This article is an open access article distributed under the terms and conditions of the Creative Commons Attribution (CC BY) license (http://creativecommons.org/licenses/by/4.0/).