Proceeding Paper

Inversion for Damping Ratio of Flat Blade Based on BP Neural Network †

Power-Plant Institute, Chinese Flight Establishment, Xi’an 710089, China
*
Author to whom correspondence should be addressed.
Presented at the 18th International Conference on Experimental Mechanics (ICEM18), Brussels, Belgium, 1–5 July 2018.
Proceedings 2018, 2(8), 547; https://doi.org/10.3390/ICEM18-05429
Published: 9 July 2018
(This article belongs to the Proceedings of The 18th International Conference on Experimental Mechanics)

Abstract

:
Aero engine is impacted by foreign objects frequently during daily usage, including runway gravel, birds, fuselage components and so on, so the fan and compressor may damage, resulting in serious air crash. Thus, simulating the impact of blades and establishing the numerical analysis model of dynamic response demand immediate attention. In the analysis model, damping coefficient is one of the most important physical parameters of the blade structure and cannot be directly measured. Rayleigh damping is widely applied and can be converted to direct modal damping in ABAQUS. BP neural network is a multi-layer feedforward neural network using back propagation algorithm to adjust the network weights. It can be proved that there exists a three-layer BP network to realize the mapping of arbitrary continuous functions with arbitrary precision. In this study, a novel method for obtaining the damping ratio of the flat blade which applies BP neural network inversion is proposed. In order to demonstrate this method, a simplified experiment was conducted. Firstly, fix a section of aluminum plate and then conduct two set of drop tests on different positions with different impact velocities by a steel ball. At the same time, vibration response was recorded by displacement sensor. Secondly, establish a finite element model using ABAQUS to simulate the drop test. Adopt twenty groups of models with different damping ratio and then obtain their amplitudes and decay time, respectively. Thirdly, train a BP neural network using MATLAB program and then establish the mapping relationship between amplitude, decay time and damping ratio. Fourth, a set of experimental amplitude and decay time is substituted into the previously obtained BP neural network mapping model, and then the real damping ratio is obtained by inference. Finally, the real damping ratio is applied to the flat blade impact simulation of the other set of drop test for validation. The numerical results are consistent with the experimental data, which indicates that the damping ratio obtained by BP neural network inversion is reasonable and reliable.

1. Introduction

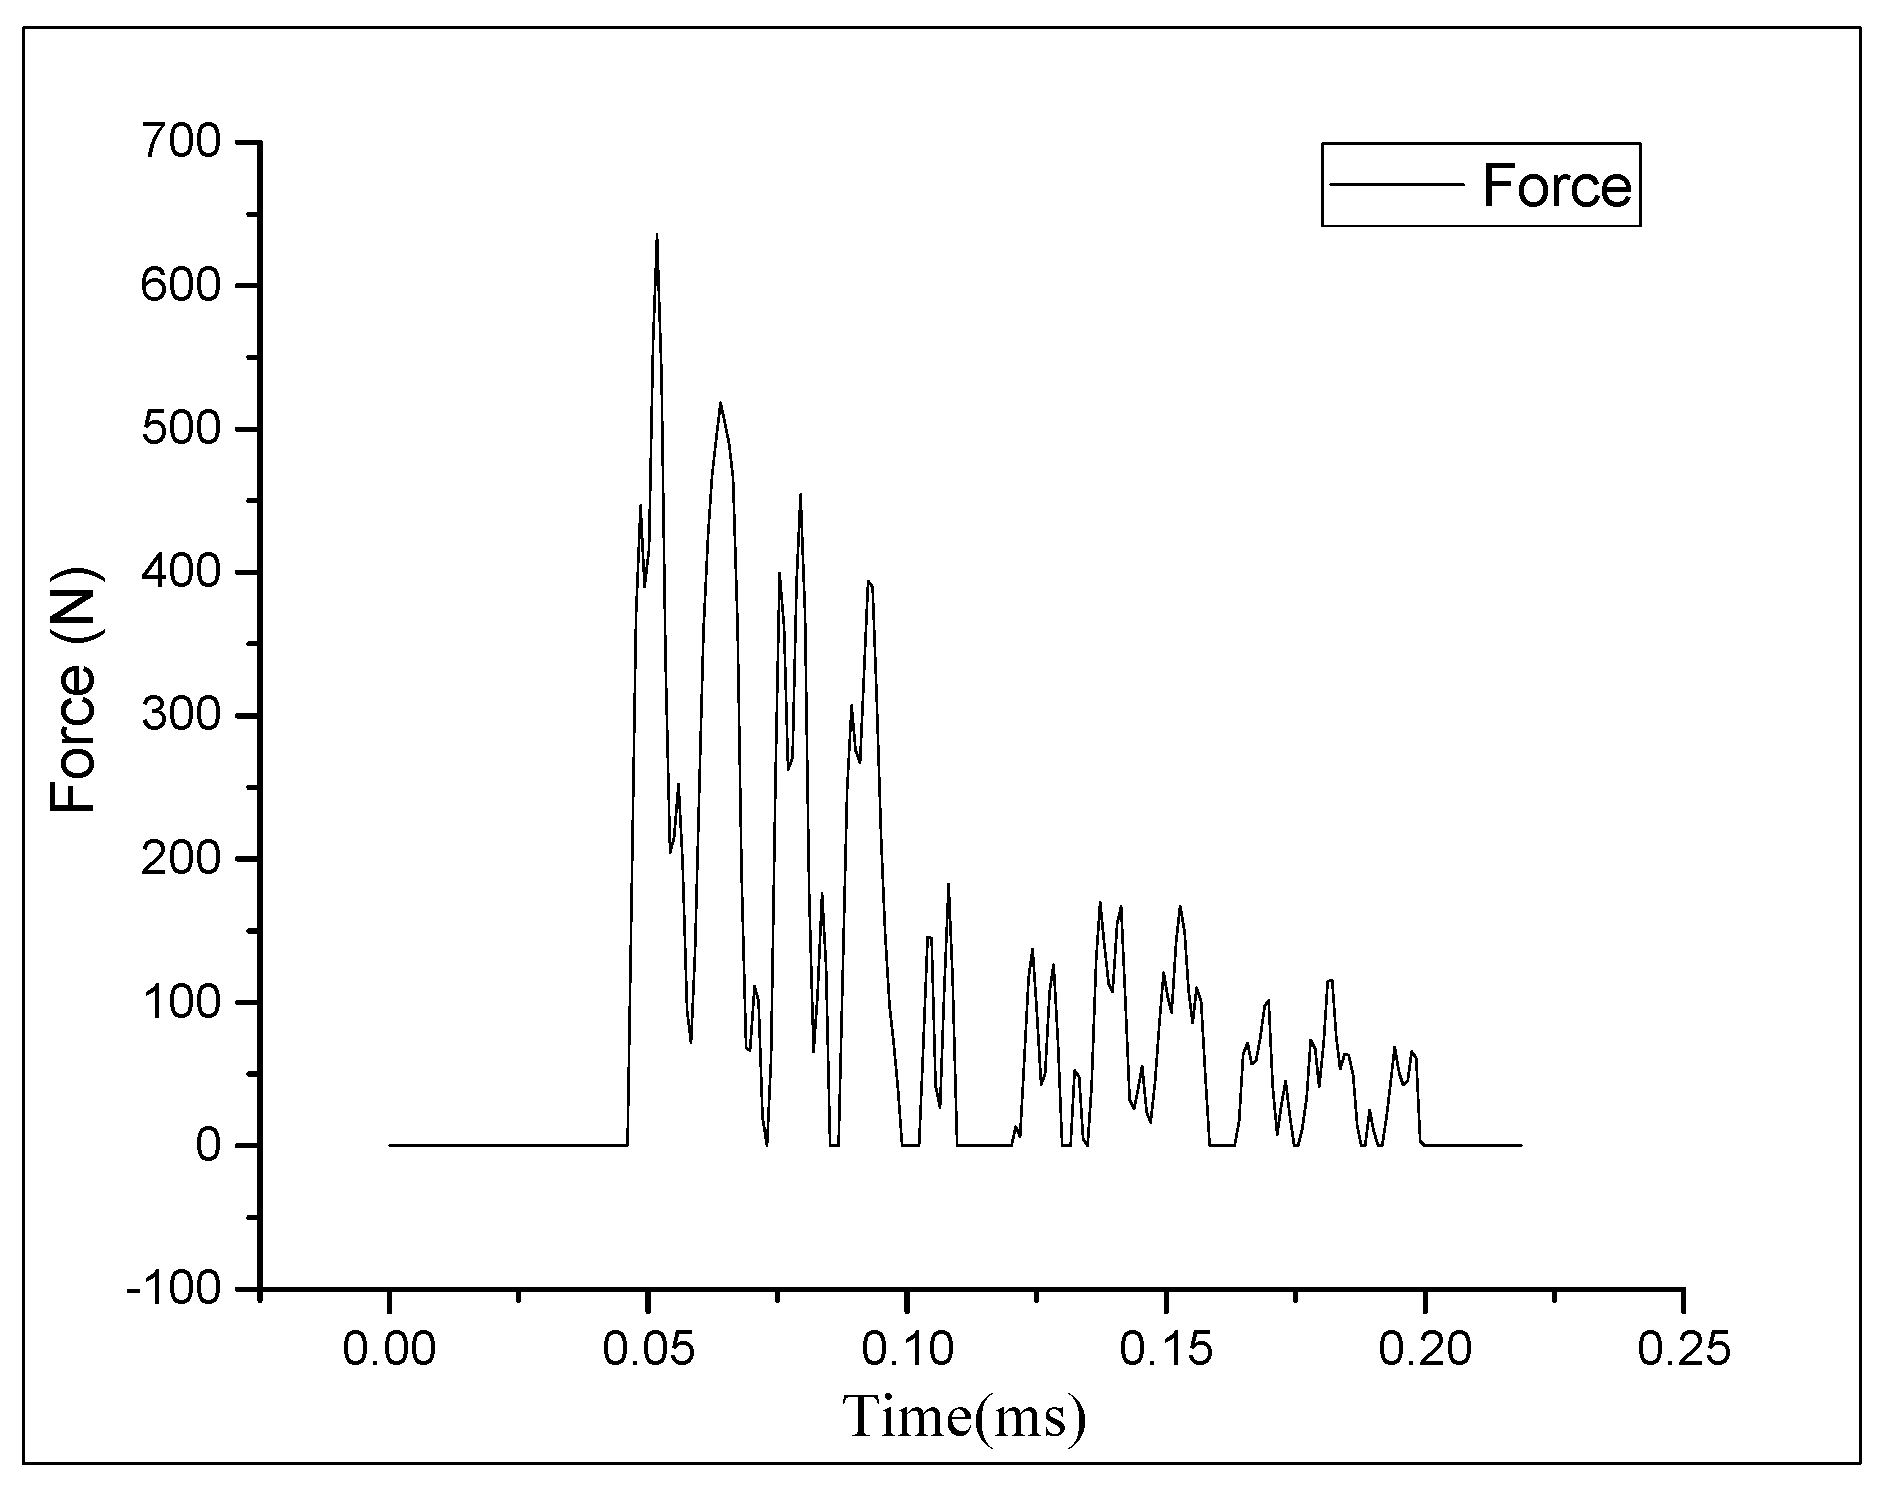
As the only power device of the aircraft, the aero-engine has been paid special attention [1], and its stability is closely related to the safety of the aircraft. However, the engine is often impacted by foreign objects, including runway gravel, birds, wrenches, bolts and so on, which result to serious damage to the engine and danger to occupants. Zhang and Fei [2] investigated the birdstrike on the engine fan blades and found that engine damage was significant relationship with birdstrike locations. Ma et al. [
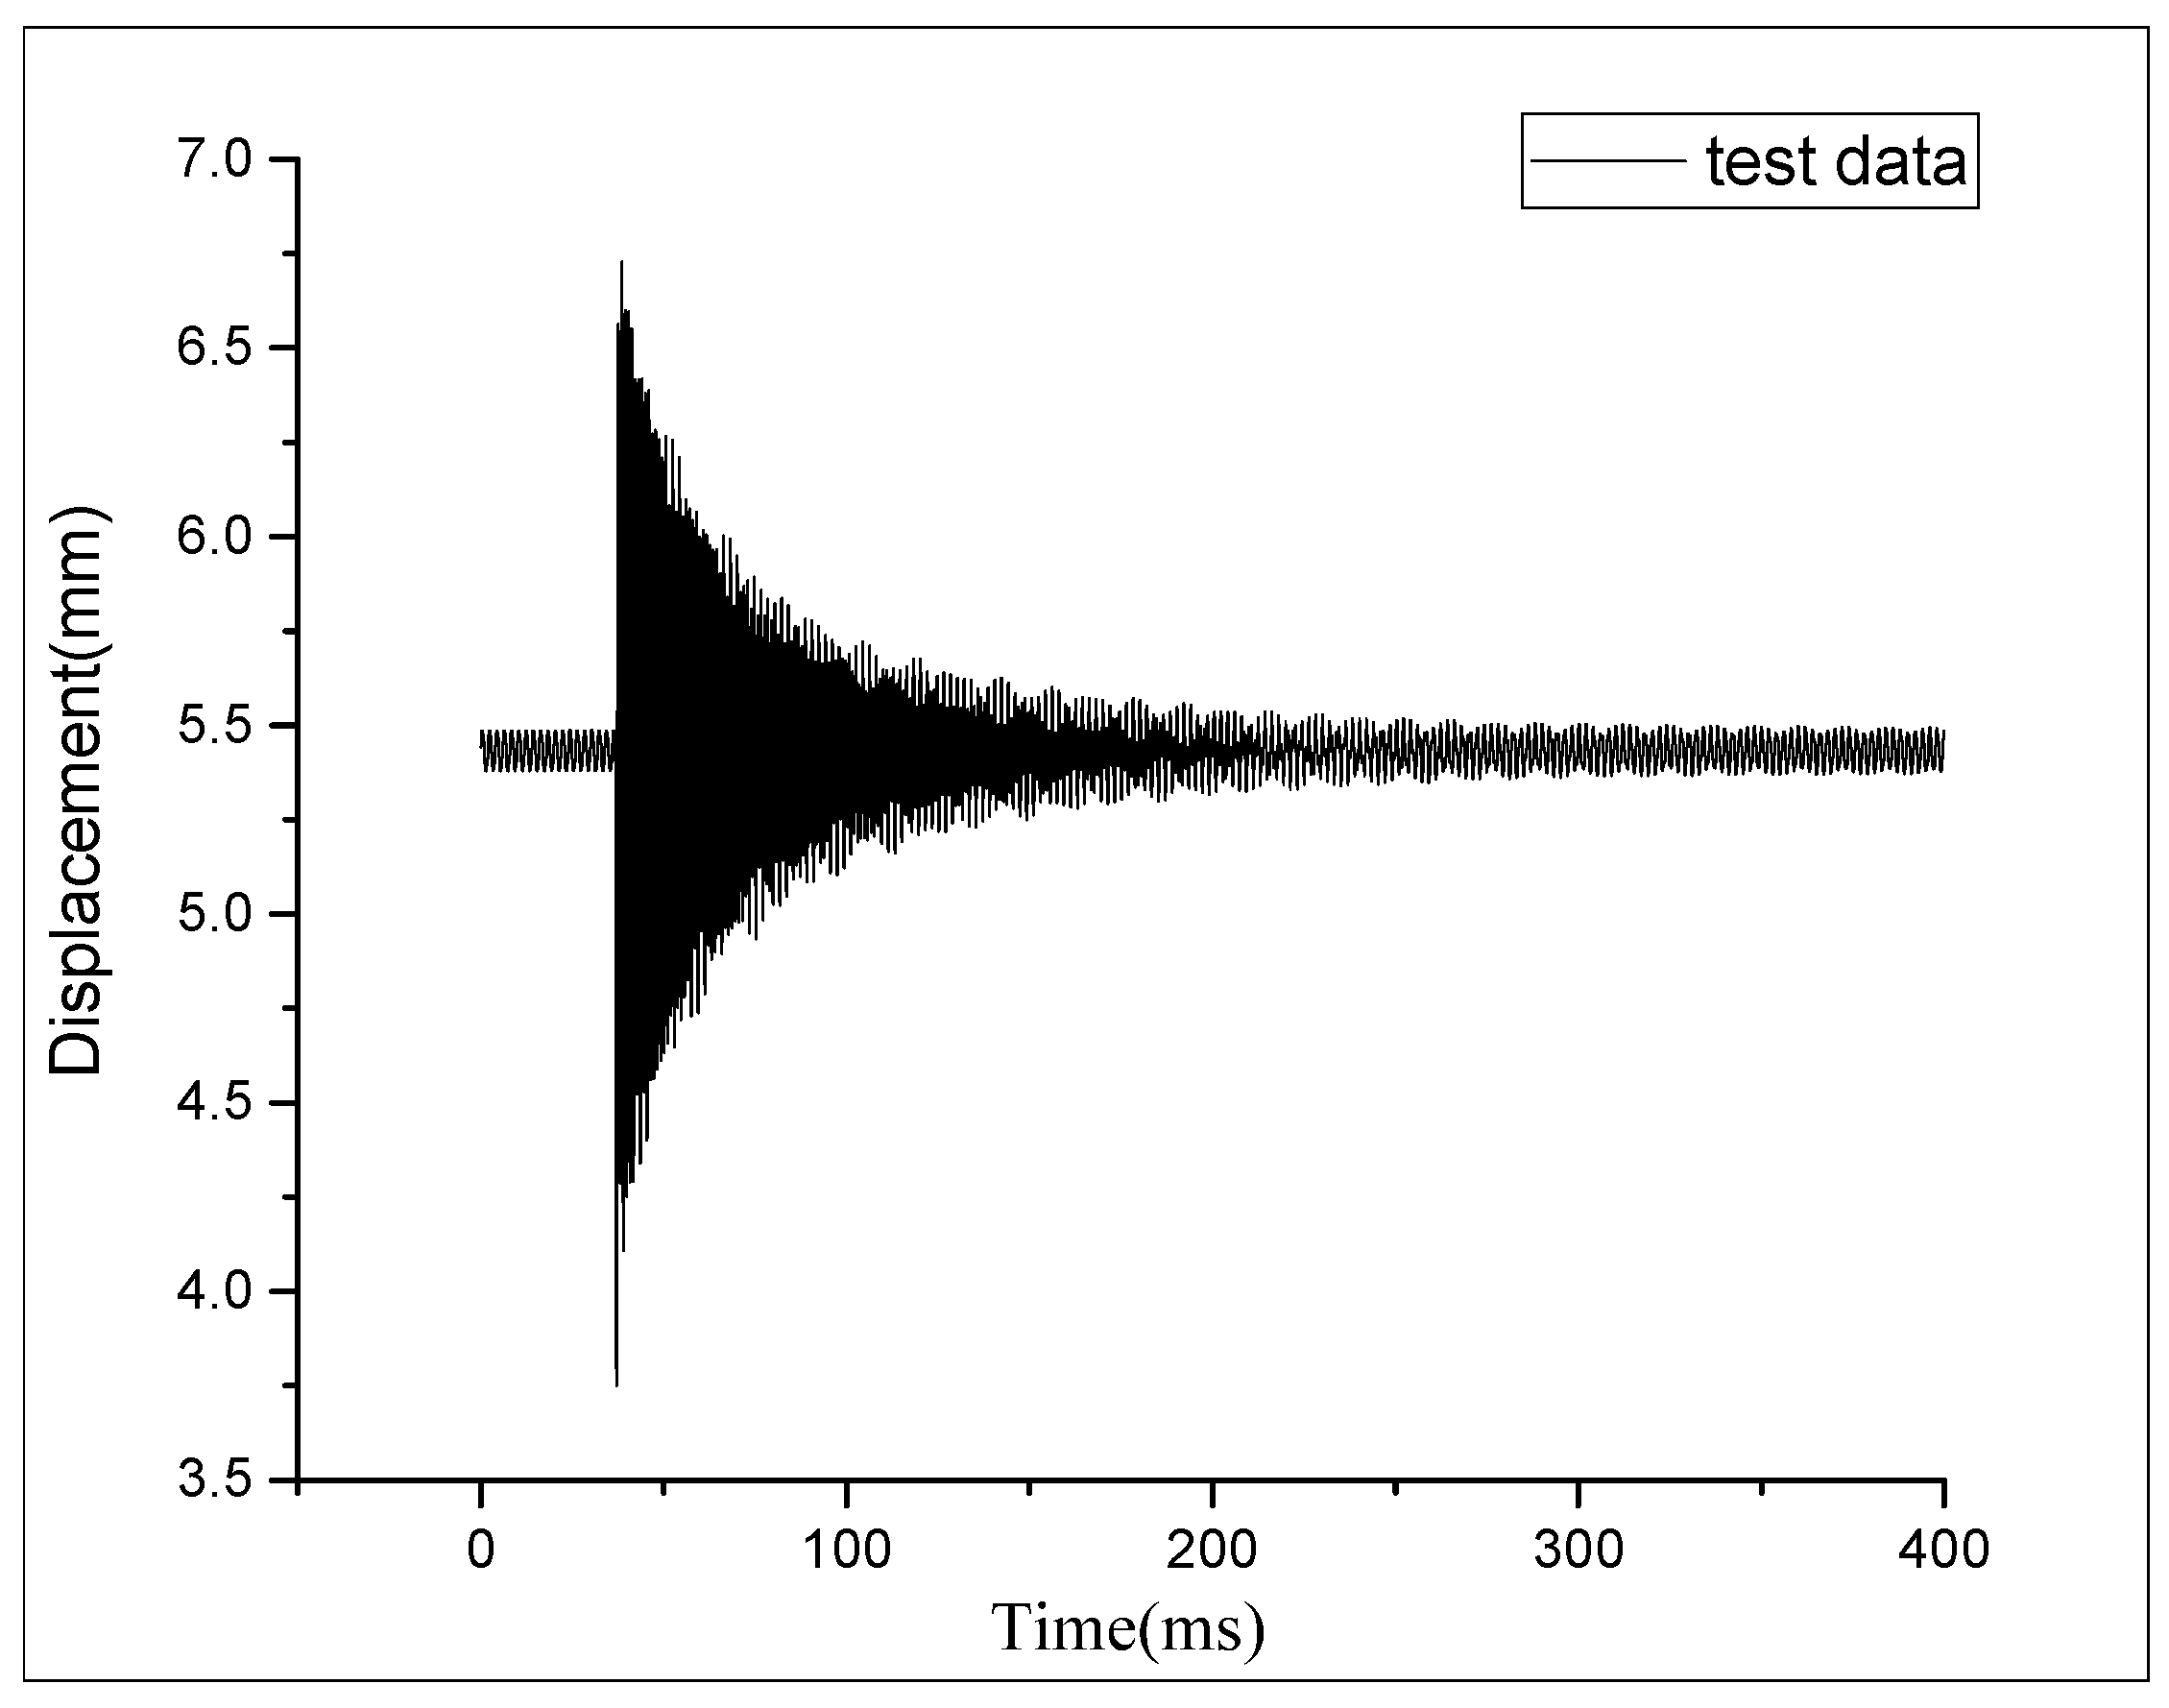
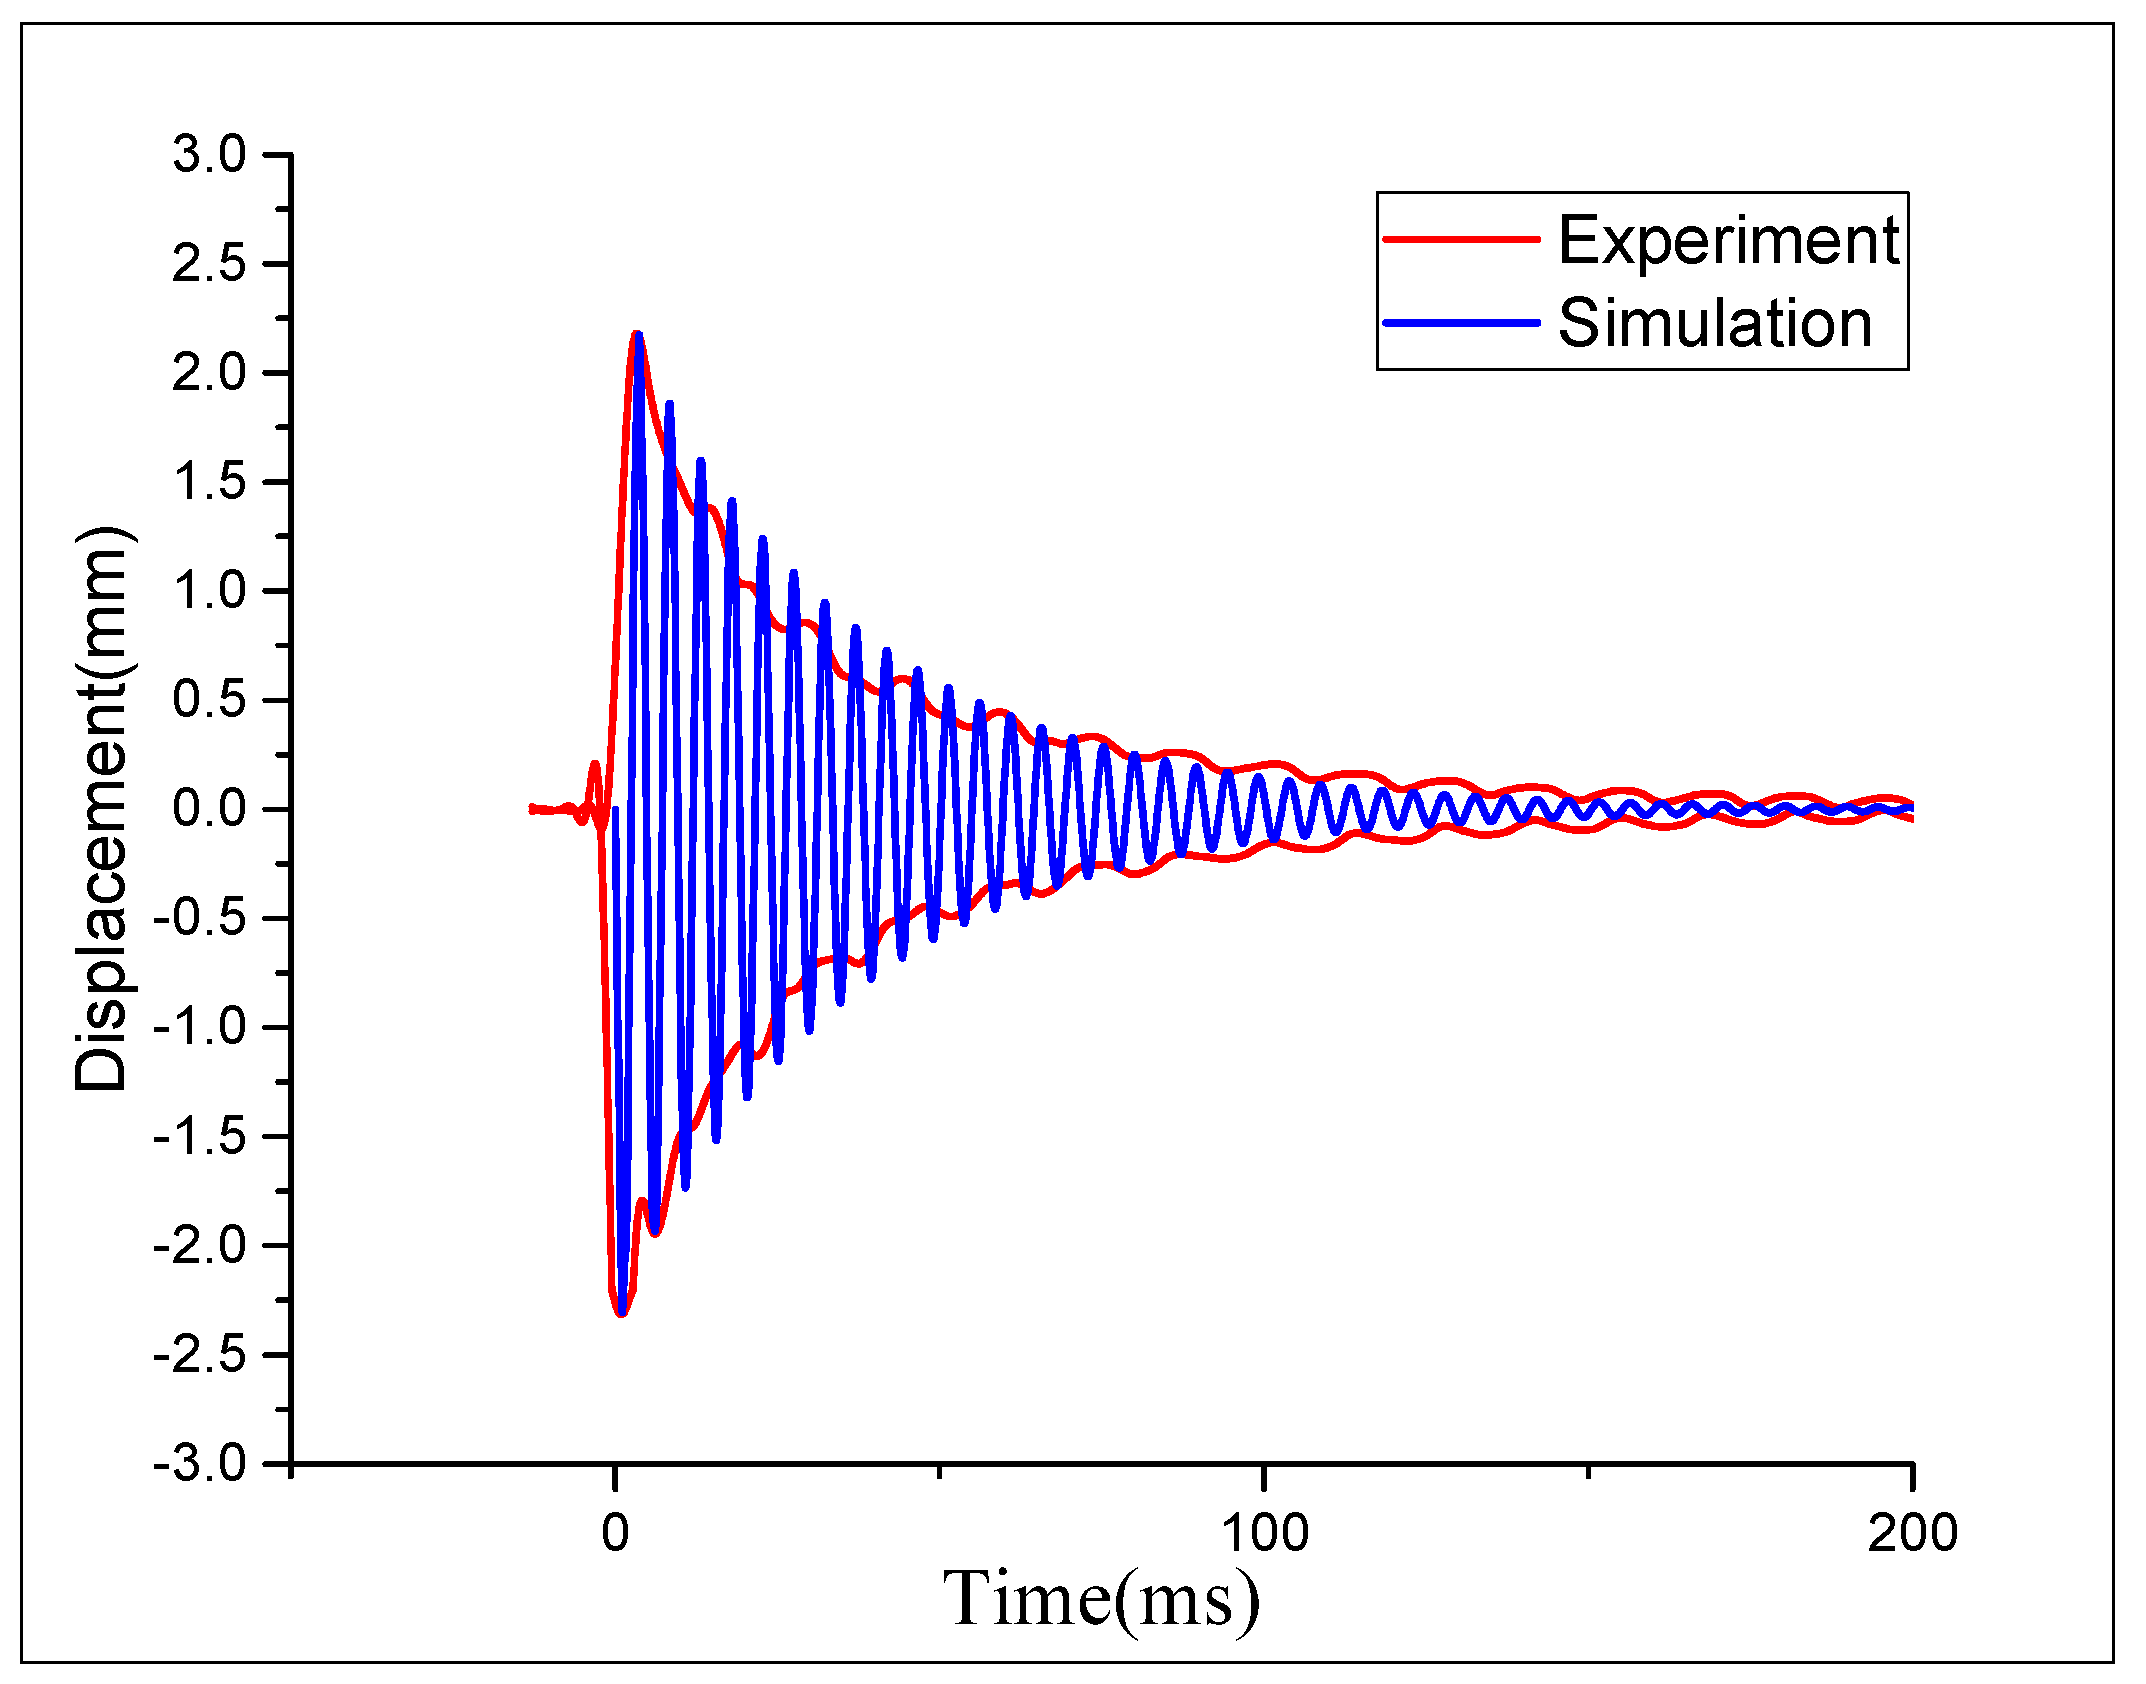
3] analyzed the vibration characteristics of the engine blades under impact load and the results showed that both blade rotation speed and aerodynamic force had a significant influence on the vibration response. Structure damping coefficient is an important parameter for vibration response. The traditional experimental measurement method [
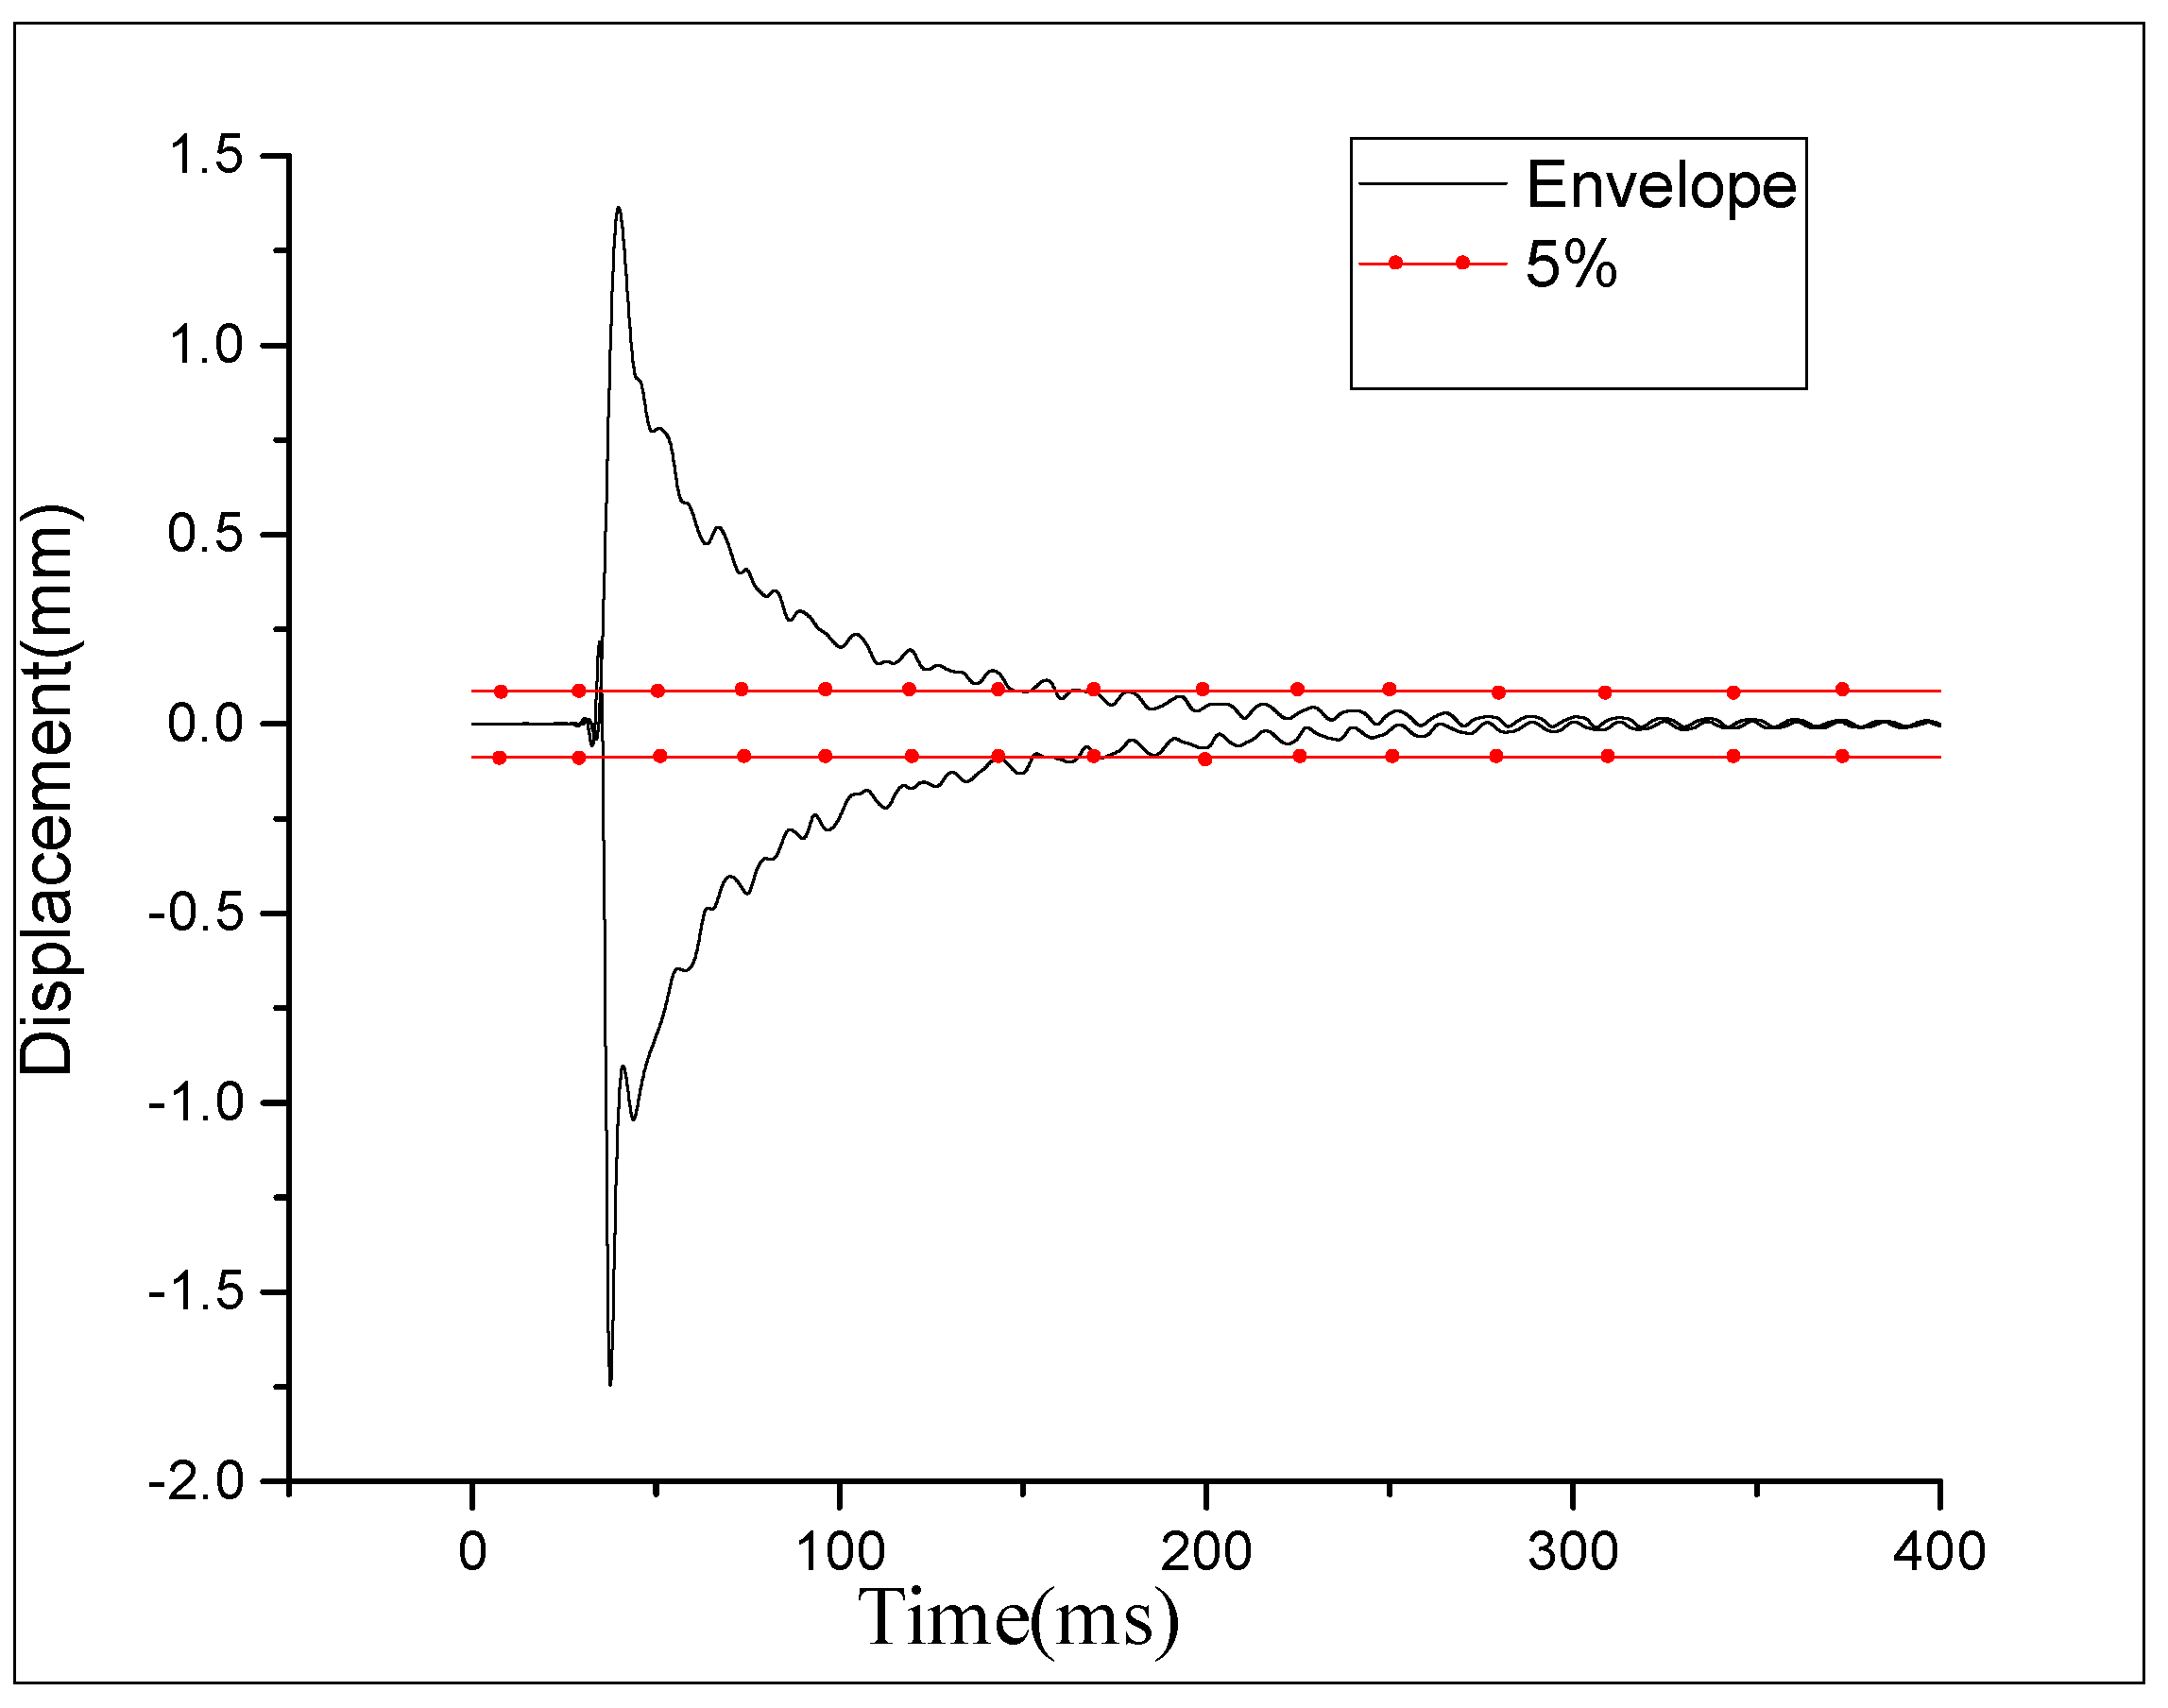
4] is to obtain the logarithm reduction rate of the damped oscillator through the damping vibration curve first, and then obtain the time constant and structure damping coefficient. Lee and Sun et al. [5] found that the vibration frequency and damping coefficient of the composite beam were directly related to the fiber and matrix damage of the composite material, but it was only a qualitative result. Wolfenden et al. [6] proposed an experimental technique for determining structural damping in a vacuum environment, but this method was only used for materials with low natural frequency. To address this issue, this study proposes a new structural damping determining method based on BP neural network combined with experiments and simulations.
Artificial neural networks (ANN) are powerful tools for prediction of nonlinearities. These mathematical models comprise individual processing units called neurons that resemble neural activity. Each processing unit sums weighted inputs and then applies a linear or nonlinear function to the resulting sum to determine the output. One ANN which has received most attention is the backpropagation network (BP neural network) [7]. BP neural network is a multi-layer feed-forward neural network that uses back-propagation algorithm to adjust network weights. It can be proved that a three-layer BP network can realize arbitrary continuous function mapping with arbitrary precision. The BP neural network is widely used. Liu Jun et al. [8] applied BP neural network to determine the parameters of the bird body modeled by smoothed particle hydrodynamics, which were consistent with the experimental results. Wang et al. [9] applied BP neural network to establish a flood forecasting model based on traditional hydrological data. Ma et al. [
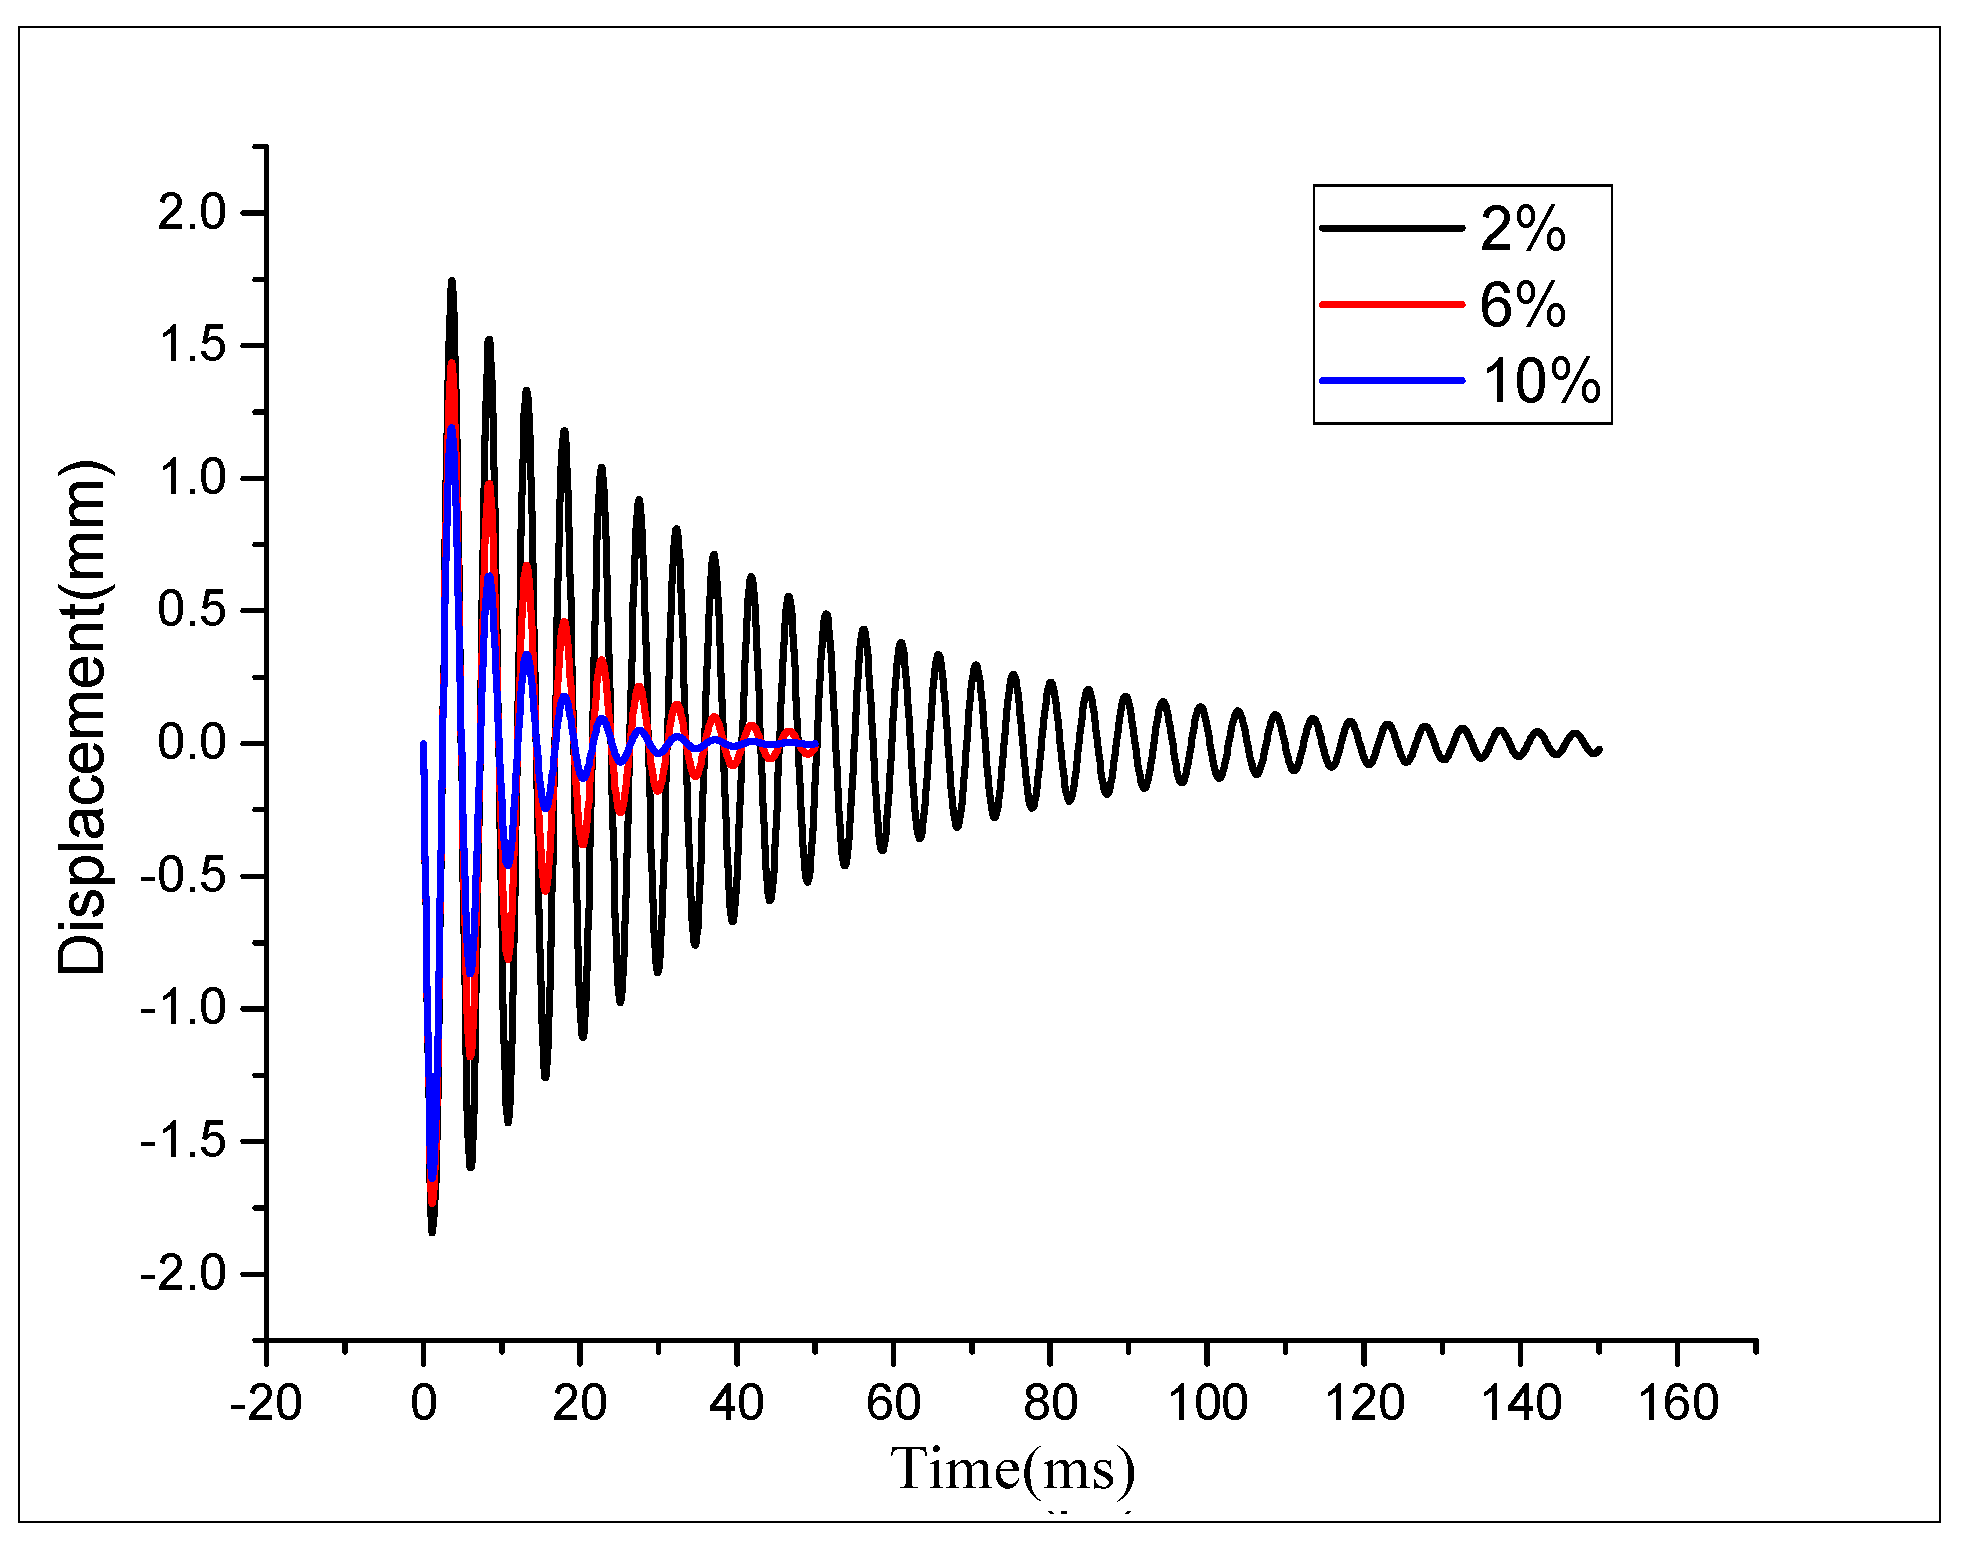
10] used BP neural network to optimize the control algorithm of the wheeled robot. In this study, the amplitude and decay time of twenty different damping coefficient models are taken as the input layer, and the damping coefficient of the model is taken as the output layer. The weight of the hidden layer is adjusted through the back-propagation of the cost function to obtain the weight matrix. Then the amplitude and decay time of the real structure response are input in the input layer, the damping coefficient of the real structure is obtained at the output layer.

2. Experiment of Impact on Plate Blade

The size of plate blade used in the experiment was 130 × 50 × 2 mm, and it was made of aluminum alloy 2024-T3. The impactor was a steel ball with a mass of 5.4 g. The impact height was 500 mm and the impact position was on the symmetry axis of the flat blade, as shown in Figure 1. The displacement sensor was installed under the impact position. One side of the blade was fixed.
The actual displacement data of the impact point was obtained by displacement sensor in experiments, as shown in Figure 2. The curve was mixed with periodic oscillations of noise in the equilibrium position, which caused inconvenience to the data analysis. Therefore, the data was filtered to remove high-frequency noise, and then its envelope was obtained, as shown in Figure 3. The red dot line is the 5% height of the maximum amplitude. It showed that the maximum amplitude was 1.831 mm and the decay time is 112.6 ms.

3. Simulation of Impact on Plate Blade

ABAQUS is used in this study for simulation. The flat blade is simulated using shell elements. The grid size is about 5 mm which is determined by grid sensitivity analysis. The steel balls are divided into hexahedral grids using O-grid method. Contact is defined as “surface-to-surface contact explicit”. Table 1 shows the material parameters used in the simulation model. According to the principle of energy equivalence, a steel ball impacting a flat blade from a height of 500 mm can be equivalent to hitting with an initial velocity of 3.13 m/s. It is a low-velocity impact, so the materials only occur elastic deformation and strain rate effect is not taken into consideration. The impact force curve is shown in Figure 4.
The modal analysis of the flat blade is performed using ABAQUS and the first five order natural frequencies are obtained in Table 2. The effective mass of each direction accounted for 90.02%, 93.82%, and 96.33% of the total free mass, respectively, satisfying the requirements.
Rayleigh damping is a common damping type, which is obtained by weighted addition of modal mass matrix and stiffness matrix. In ABAQUS, Rayleigh damping is transformed into direct modal damping for calculation. Direct modal damping can be defined by the damping ratio of each mode. A modal dynamic analysis step is added after the modal analysis step, and the first five order natural frequencies are taken into simulation. According to the requirements of the BP neural network, twenty sets of damping ratios are taken from 0.5% to 10%, respectively.
Figure 5 shows the displacement history curve of the impact point obtained from the simulation under the three representative damping ratios. The amplitude is taken as the maximum displacement, and the decay time is taken as the time when the displacement of the envelope is 5% of the maximum displacement. The amplitude and decay time of the model under each damping ratio are obtained, as shown in Table 3, Table 4 and Table 5.

4. Inversion of BP Neural Network

This study uses Neural Network Toolbox from Matlab to perform BP neural network inversion and a three-layer BP neural network is implemented. The input layer of the neural network has two neurons, which are the amplitude and decay time, and the output layer has one neuron, which is the damping ratio. According to the empirical formula, the number of hidden neurons is determined as 5 by continuous adjustment. The input, hidden, and output layer neuron transfer functions adopt tansig, the training algorithm adopts trainlm, the weight/threshold learning function adopts learngdm, and the performance function is MSE. Twenty sets of simulation data obtained in the previous section are divided into two groups. The first fourteen groups are training groups, and the latter six groups are used as validation groups. Through extensive debugging, the learning rate is determined as 0.1, the number of training iterations is 2000. The final training error is 0.00455%, meeting the requirements. The last six validation groups are taken into the trained BP neural network to obtain the inversion prediction values of damping ratios. Table 6 shows the damping ratio prediction values and errors. From the table, it can be seen that the BP neural network realizes a satisfactory prediction and the prediction result is not divergent, indicating that the training is effectively.
Take the experiment data obtained in Section 2 into the trained BP neural network, the damping ratio of the aluminum plate blades is output as 2.11%.

5. Validation

In order to validate the correctness of the damping ratio of the aluminum plate blade obtained in Section 3, another experiment was conducted on the same blade. The mass of the ball is still 5.4 g, the impact point is changed from 16.42 mm to 11 mm and the impact height is changed from 500 mm to 1000 mm. The maximum vibration displacement was 2.315 mm, and the decay time is 105.2 ms. The simulation is also conducted and the damping ratio of 2.11% is used. The envelope of experimental data is compared with the simulation vibration curve, as shown in Figure 6. Figure 6 shows the consistency between experimental and simulation. Table 7 shows the amplitude and decay time obtained from experiments and the simulation. The errors of amplitude and decay time are 3.02% and 3.80%, respectively. The results indicate that the damping ratio of 2.11% is accurate and the method proposed in this study is feasible.

6. Conclusions

In this study, BP neural network is trained using the vibration data obtained from the simulations of plate blade models. The mapping relationship of amplitude, delay time and damping ratio is obtained. The real damping ratio of the plate blade is obtained by inversion of experimental amplitude and delay time. The real damping ratio is validated by another experiment with different impact location and height, which indicates that the inversion for damping ratio of flat blade based on BP neural network is reliable and effective.

Author Contributions

X.Z. did the experiments and simulation; S.X. assisted experiment.

Conflicts of Interest

The authors declare no conflict of interest.

References

  1. Meguid, S.A.; Mao, R.H.; Ng, T.Y. FE analysis of geometry effects of an artificial bird striking an aero engine fan blade. Int. J. Impact Eng. 2008, 35, 487–498. [Google Scholar] [CrossRef]
  2. Zhang, D.; Fei, Q. Effect of bird geometry and impact orientation in bird striking on a rotary jet-engine fan analysis using SPH method. Aerosp. Sci. Technol. 2016, 54, 320–329. [Google Scholar] [CrossRef]
  3. Ma, H.; Xie, F.; Nai, H.; Wen, B. Vibration characteristics analysis of rotating shrouded blades with impacts. J. Sound Vib. 2016, 378, 92–108. [Google Scholar] [CrossRef]
  4. Scott, G.P. Contemporary Organic Chemistry. Second Edition (Ternay, Andrew L., Jr.). J. Chem. Educ. 1980, 57, A241. [Google Scholar]
  5. Lee, B.T.; Sun, C.T.; Liu, D. An Assessment of Damping Measurement in the Evaluation of Integrity of Composite Beams. J. Reinf. Plast. Compos. 1987, 6, 114–125. [Google Scholar] [CrossRef]
  6. Wolfenden, A.; Wren, G.G.; Kinra, V.K. An Experimental Technique for Determining a Measure of Structural Damping. J. Test. Eval. 1988, 16, 77–85. [Google Scholar] [CrossRef]
  7. Sadeghi, B.H.M. A BP-neural network predictor model for plastic injection molding process. J. Mater. Process. Technol. 2000, 103, 411–416. [Google Scholar] [CrossRef]
  8. Zhang, Y.; Li, Y. The inversion of bird’s material parameters using improved BP neural network. Mach. Des. Manuf. 2010, 2, 023. [Google Scholar]
  9. Wang, J.; Shi, P.; Jiang, P.; Hu, J.; Qu, S.; Chen, X.; Chen, Y.; Dai, Y.; Xiao, Z. Application of BP Neural Network Algorithm in Traditional Hydrological Model for Flood Forecasting. Water 2017, 9, 48. [Google Scholar] [CrossRef]
  10. Ma, L.; Yao, Y.; Wang, M. The Optimizing Design of Wheeled Robot Tracking System by PID Control Algorithm Based on BP Neural Network. In Proceedings of the 2016 International Conference on Industrial Informatics—Computing Technology, Intelligent Technology, Industrial Information Integration (ICIICII), Wuhan, China, 3–4 December 2016. [Google Scholar]
Figure 1. Experimental schematic.
Proceedings 02 00547 g001
Figure 2. Vibration displacement curve at impact point in experimental.
Proceedings 02 00547 g002
Figure 3. Envelope of vibration displacement curve.
Proceedings 02 00547 g003
Figure 4. Impact force curve.
Proceedings 02 00547 g004
Figure 5. Displacement history curves of models with damping ratios of 2%, 6% and 10%.
Proceedings 02 00547 g005
Figure 6. Comparison between experiment and simulation.
Proceedings 02 00547 g006
Table 1. Material parameters.
MaterialDensityYoung’s ModulusPoisson Ratio
Al2.7 g/cm3207 gpa0.3
Steel7.9 g/cm369 gpa0.29
Table 2. The first 5 natural frequencies of the flat blade.
Modal Order12345
Frequency/Hz209.451021.41310.73279.63704.1
Table 3. Relation between damping ratio and amplitude, decay time.
Damping Ratio0.5%1%1.5%2%2.5%3%3.5%
Amplitude (mm)1.8971.8781.8591.8371.8231.8091.795
Decay time (ms)454.8218.1153.2115.892.676.966.7
Table 4. Relation between damping ratio and amplitude, decay time.
Damping Ratio4%4.5%5%5.5%6%6.5%7%
Amplitude (mm)1.7831.7721.7591.7451.7331.7211.706
Decay time (ms)58.552.647.542.839.236.433.8
Table 5. Relation between damping ratio and amplitude, decay time.
Damping Ratio7.5%8%8.5%9%9.5%10%
Amplitude (mm)1.6941.6851.6731.6621.6471.639
Decay time (ms)31.629.627.625.925.124.5
Table 6. The inversion prediction values of damping ratios and errors.
Prediction7.71%8.18%8.79%9.31%9.89%10.15%
Error2.85%2.26%3.37%3.4%4.1%1.54%
Table 7. The error of simulation prediction.
AmplitudeDecay Time
Experiment2.315 mm105.2 ms
Simulation2.385 mm109.2 ms
Error3.02%3.80%
Publisher’s Note: MDPI stays neutral with regard to jurisdictional claims in published maps and institutional affiliations.

