Detachment of Plasters in Masonry Buildings: Analysis by Acoustic Emission and Numerical Simulation †


Abstract
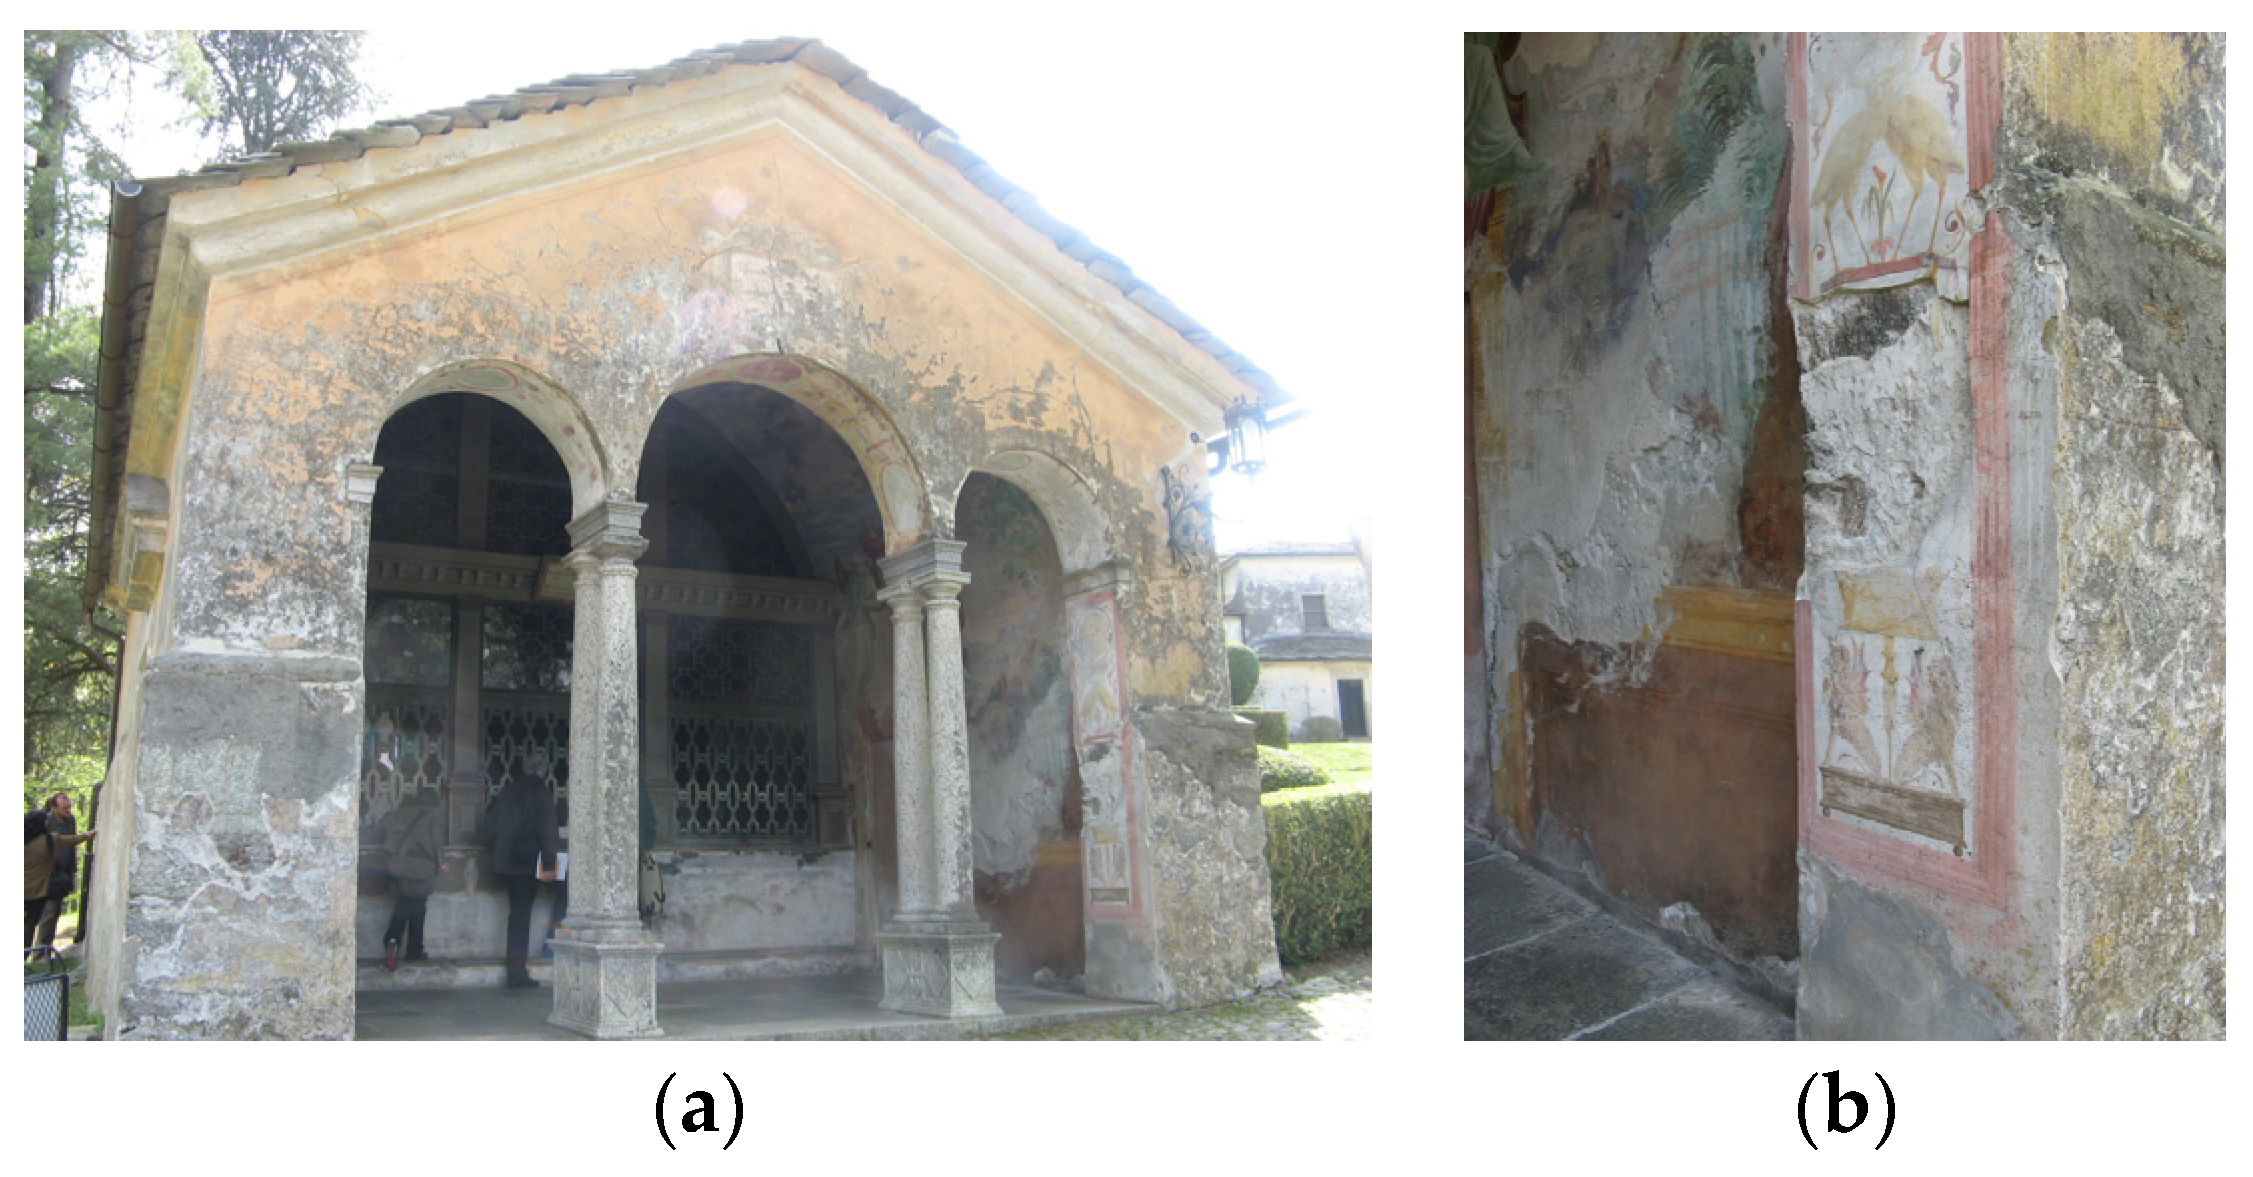
:1. Introduction
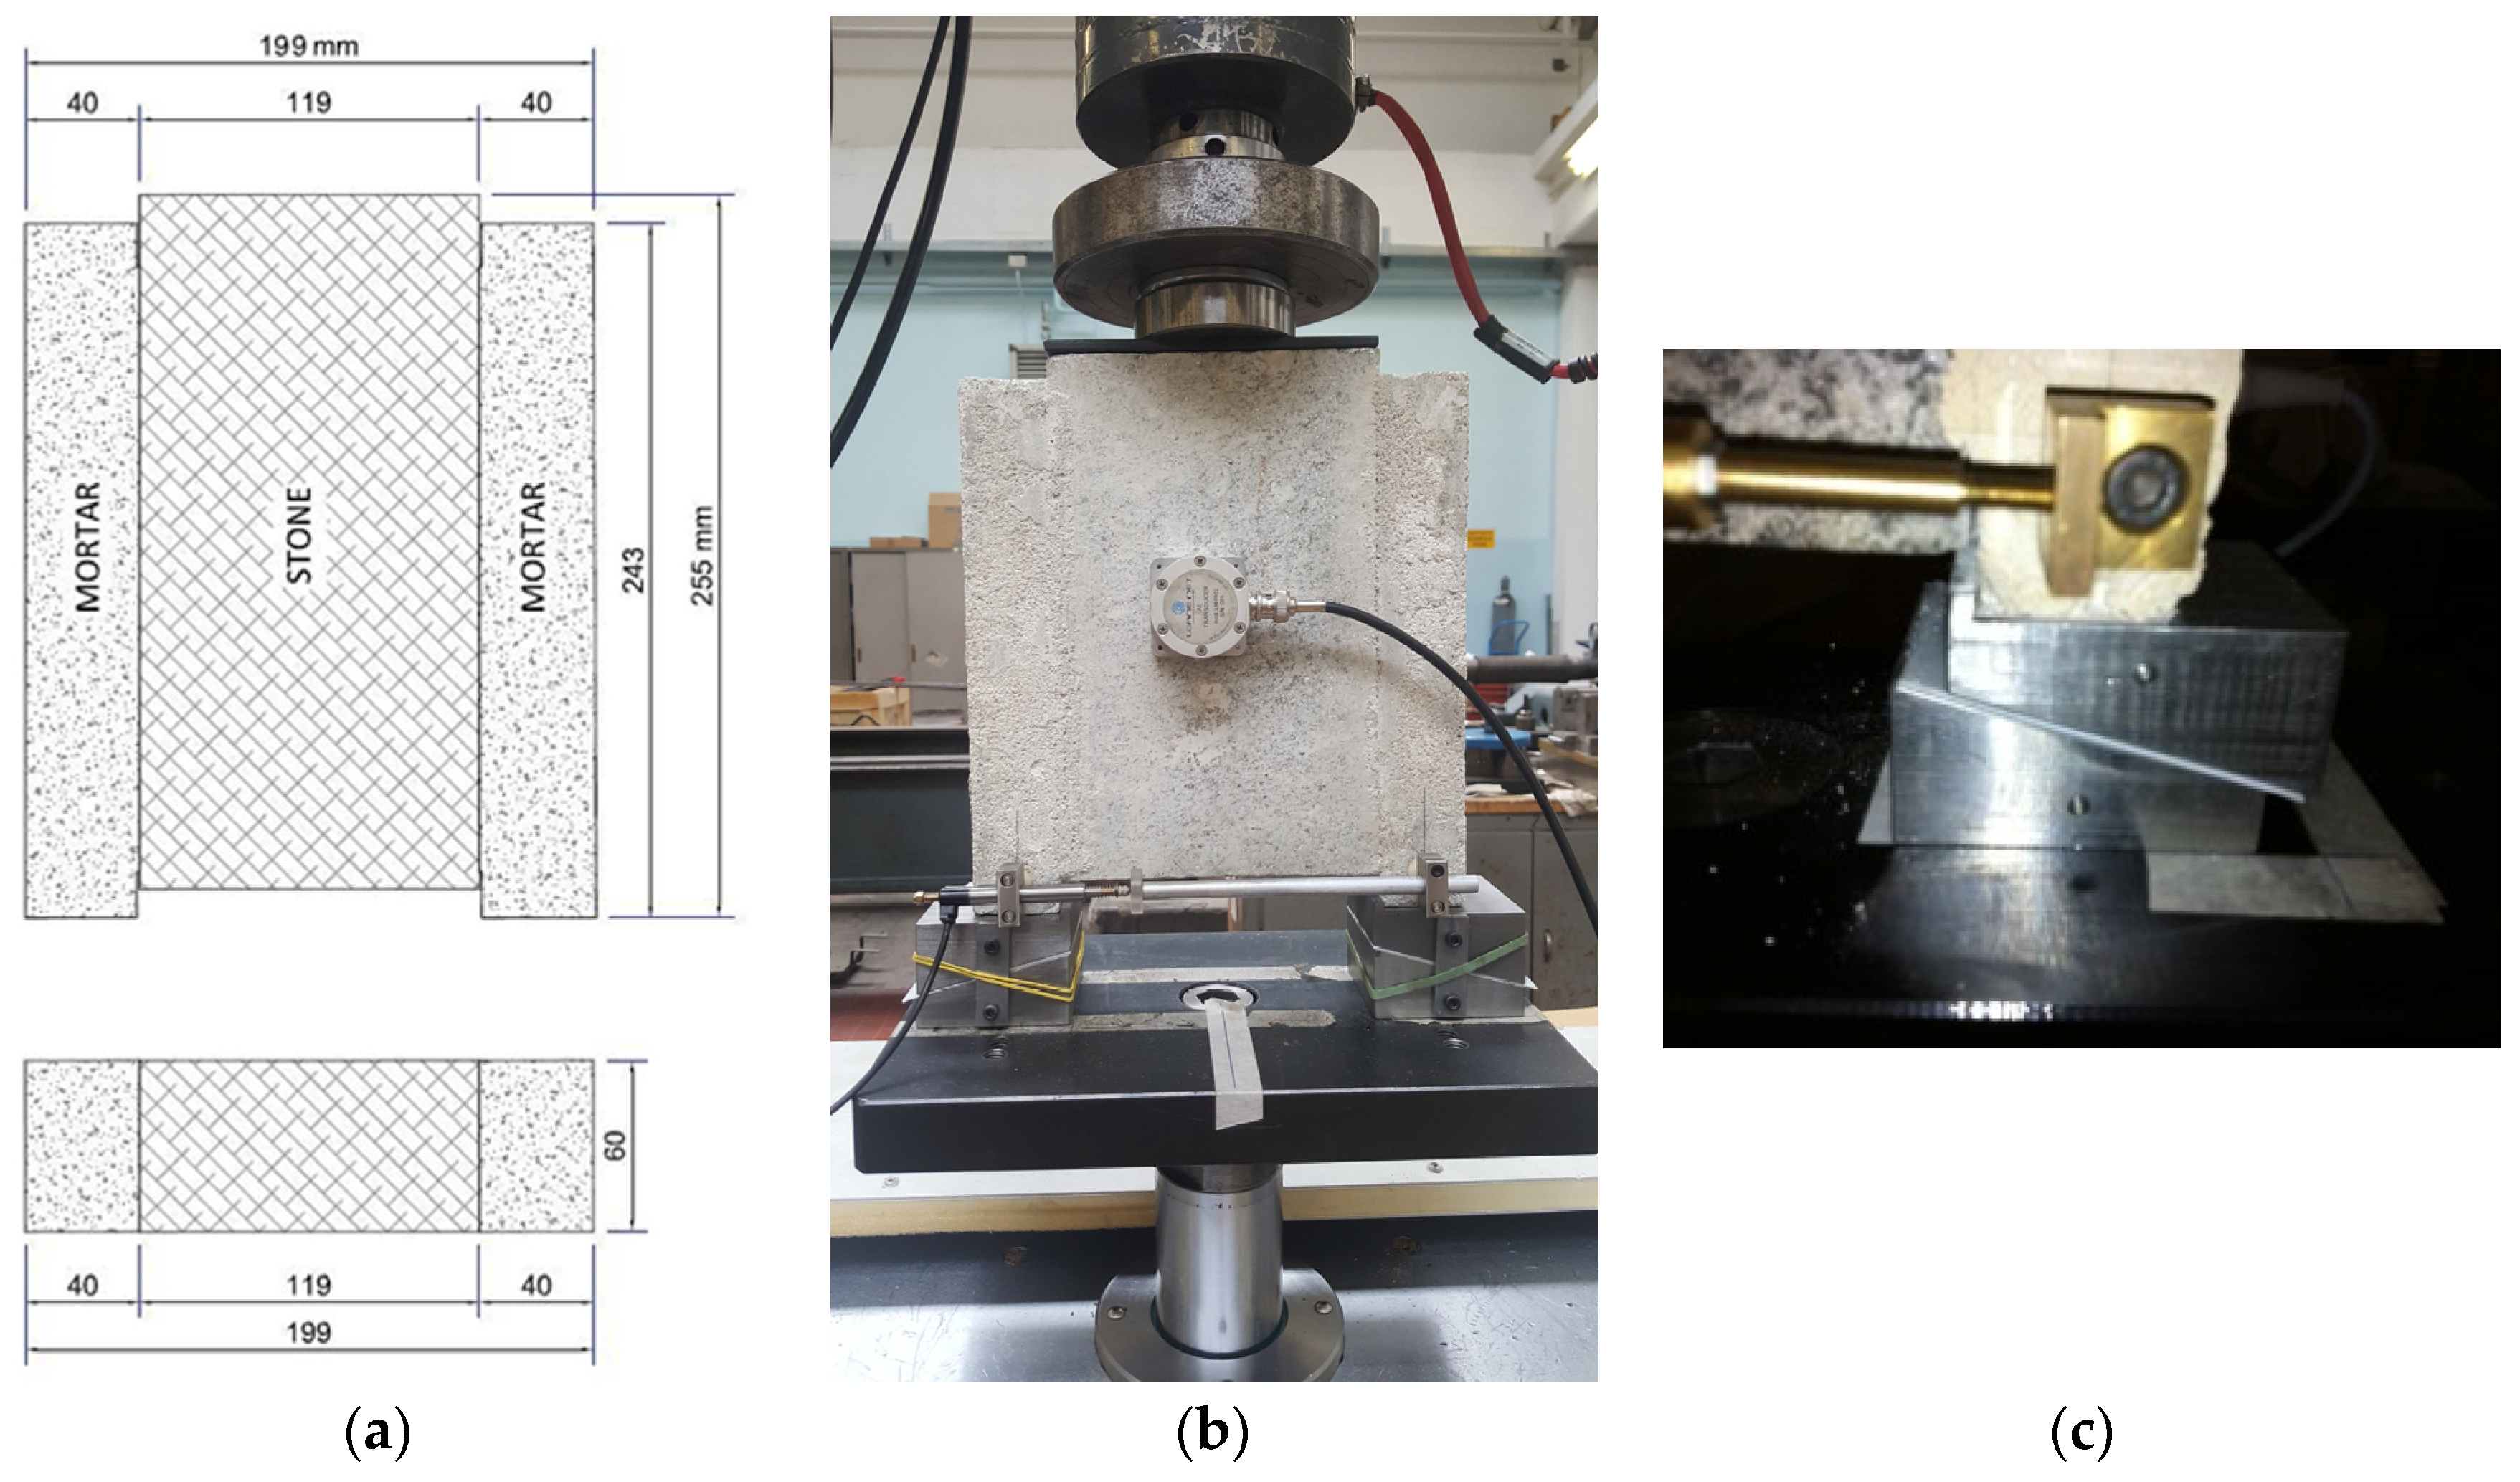
2. Materials and Method
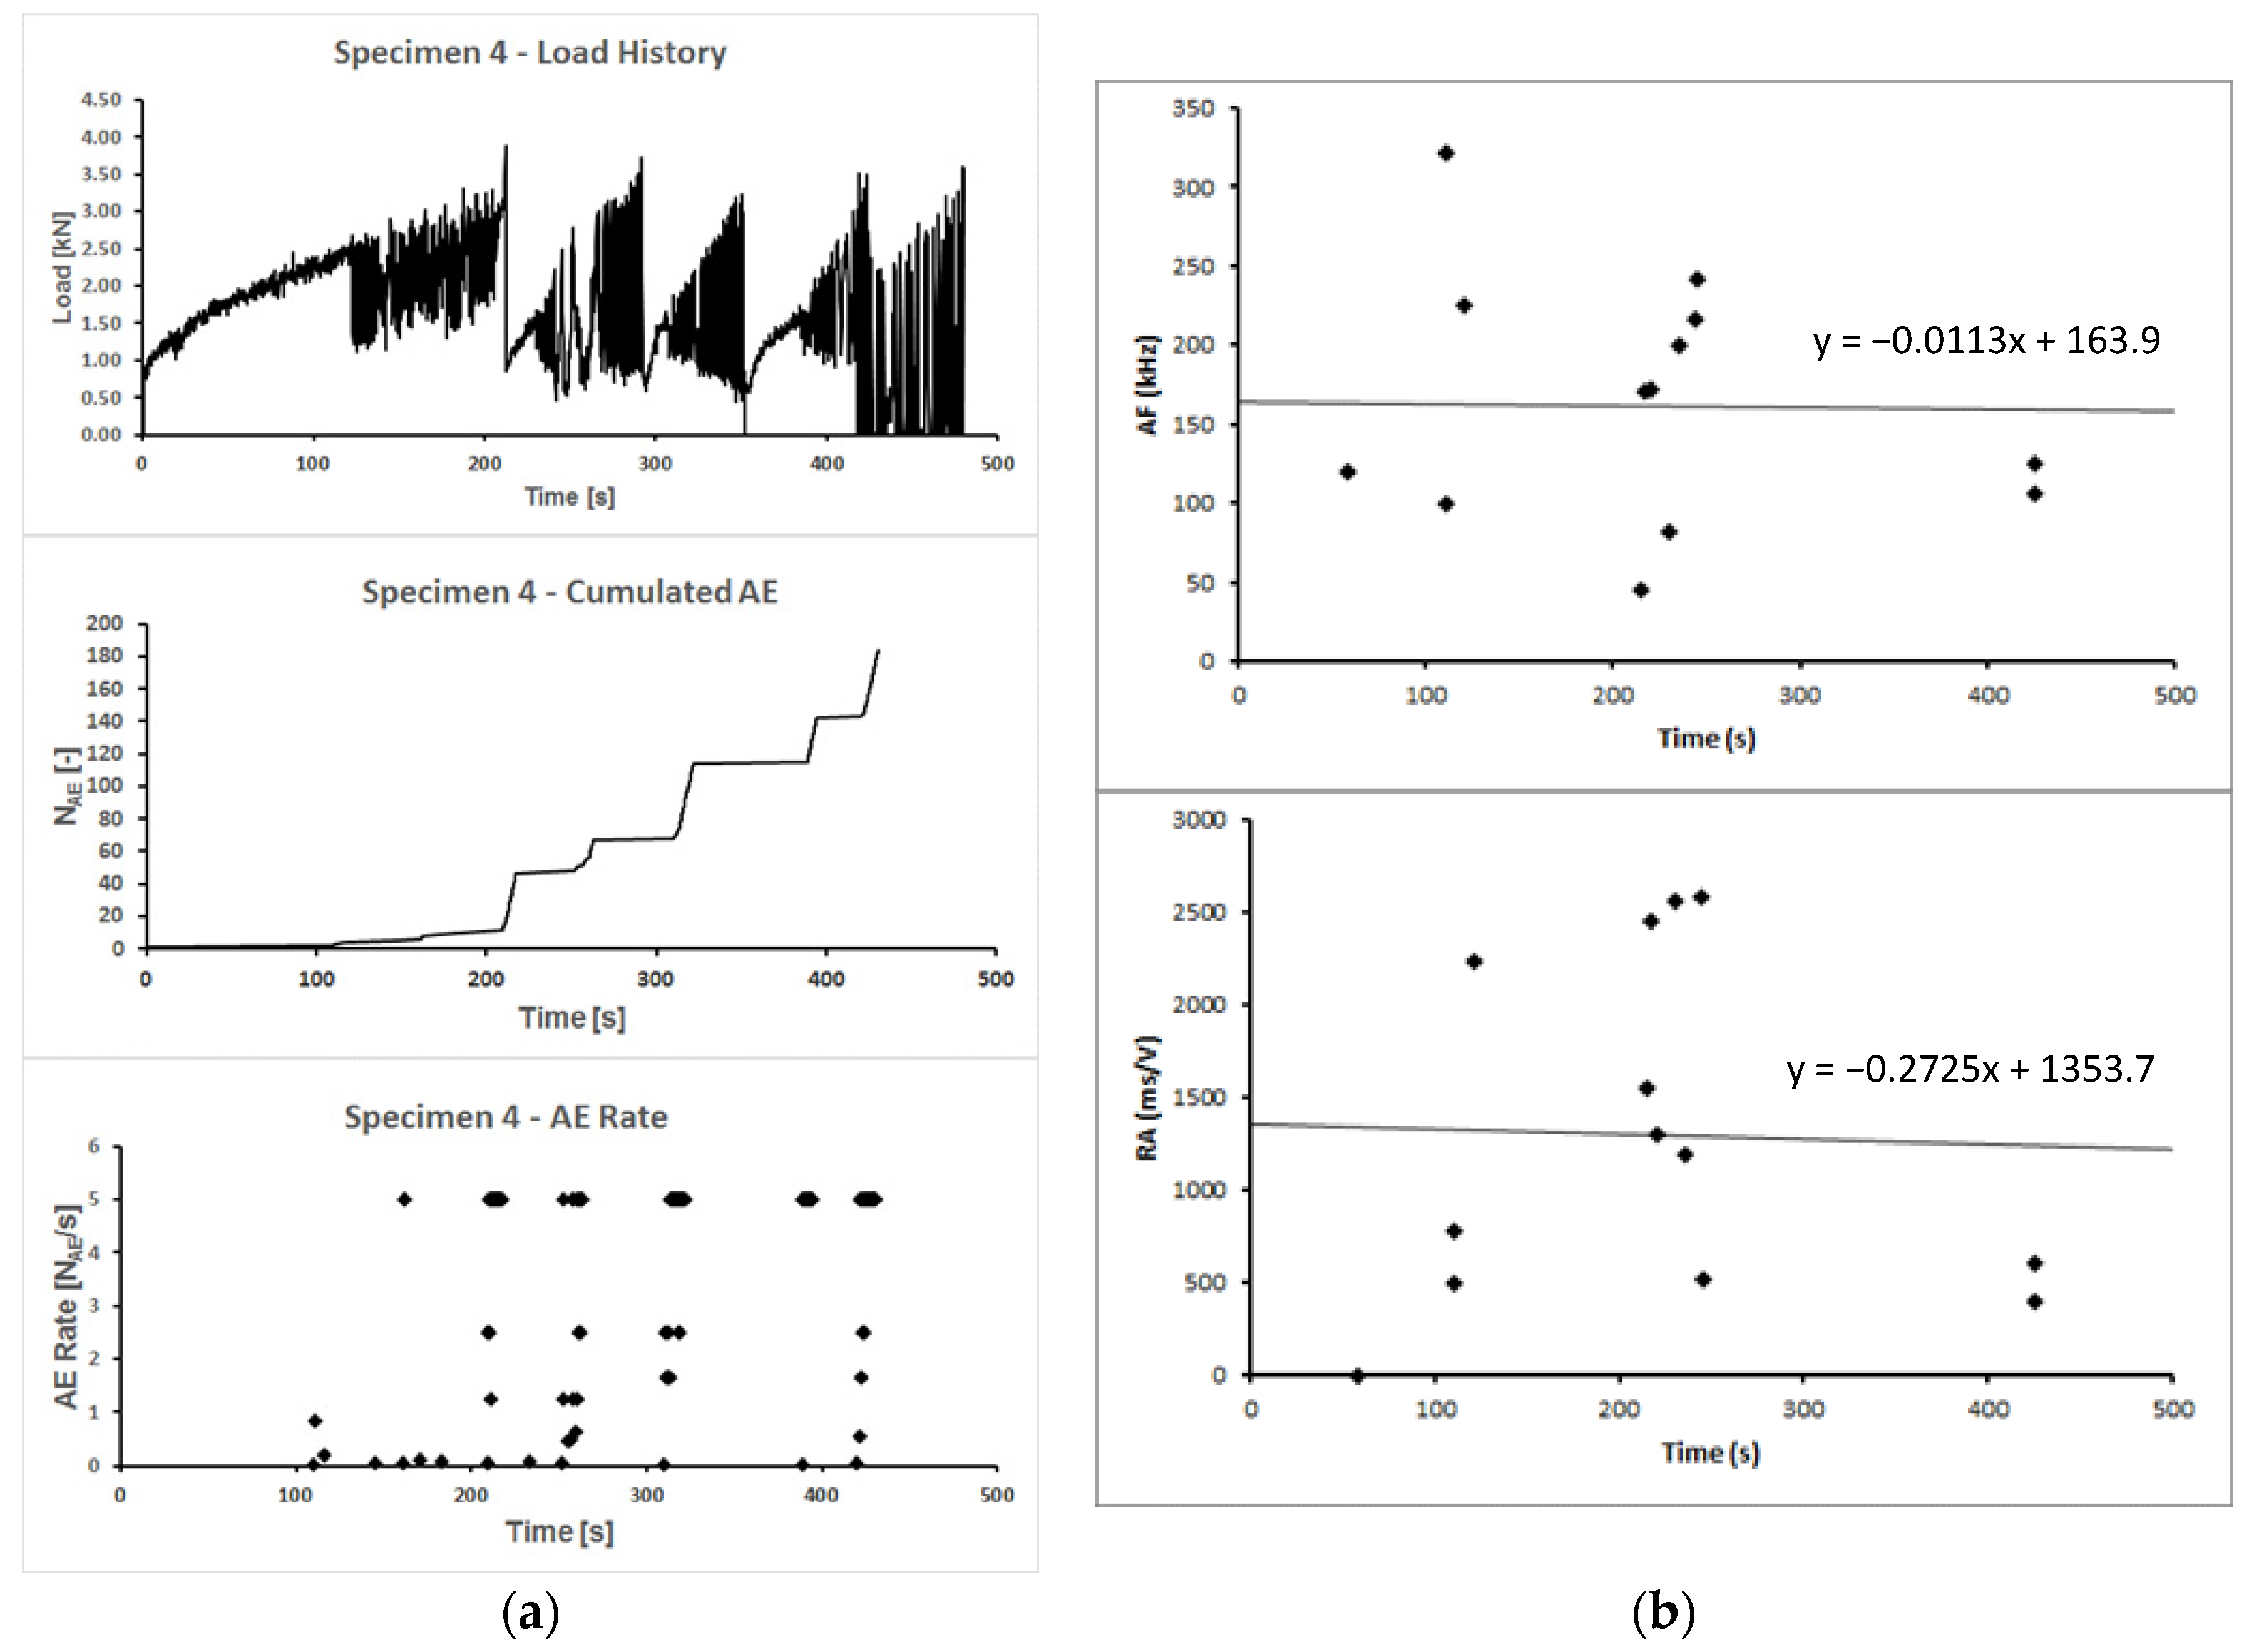
3. Results of the Acoustic Emission Monitoring
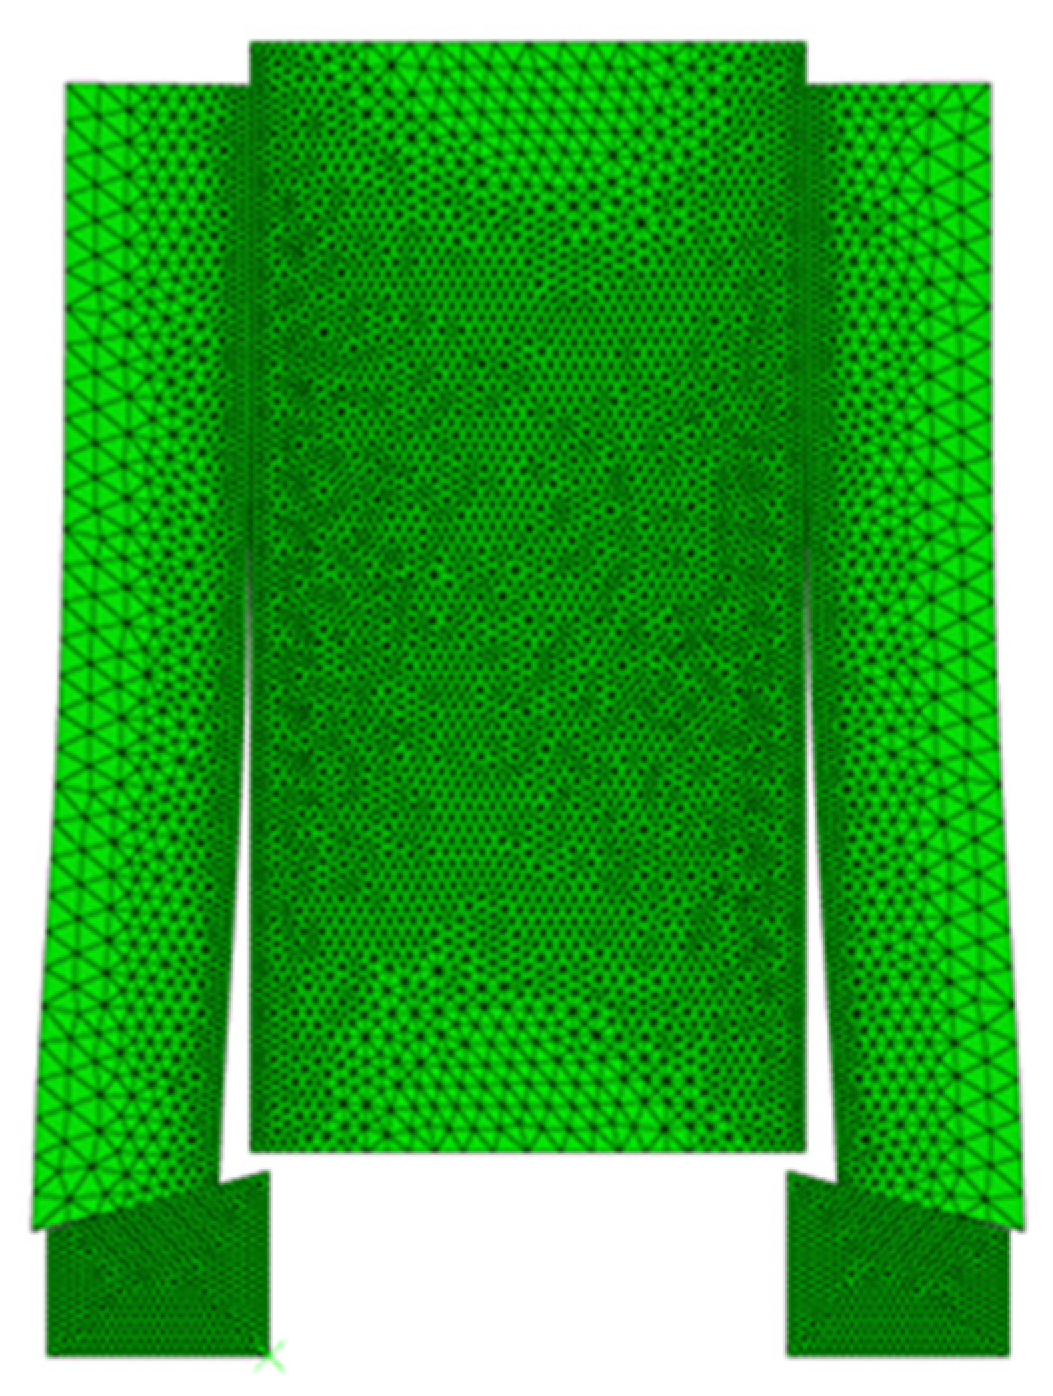
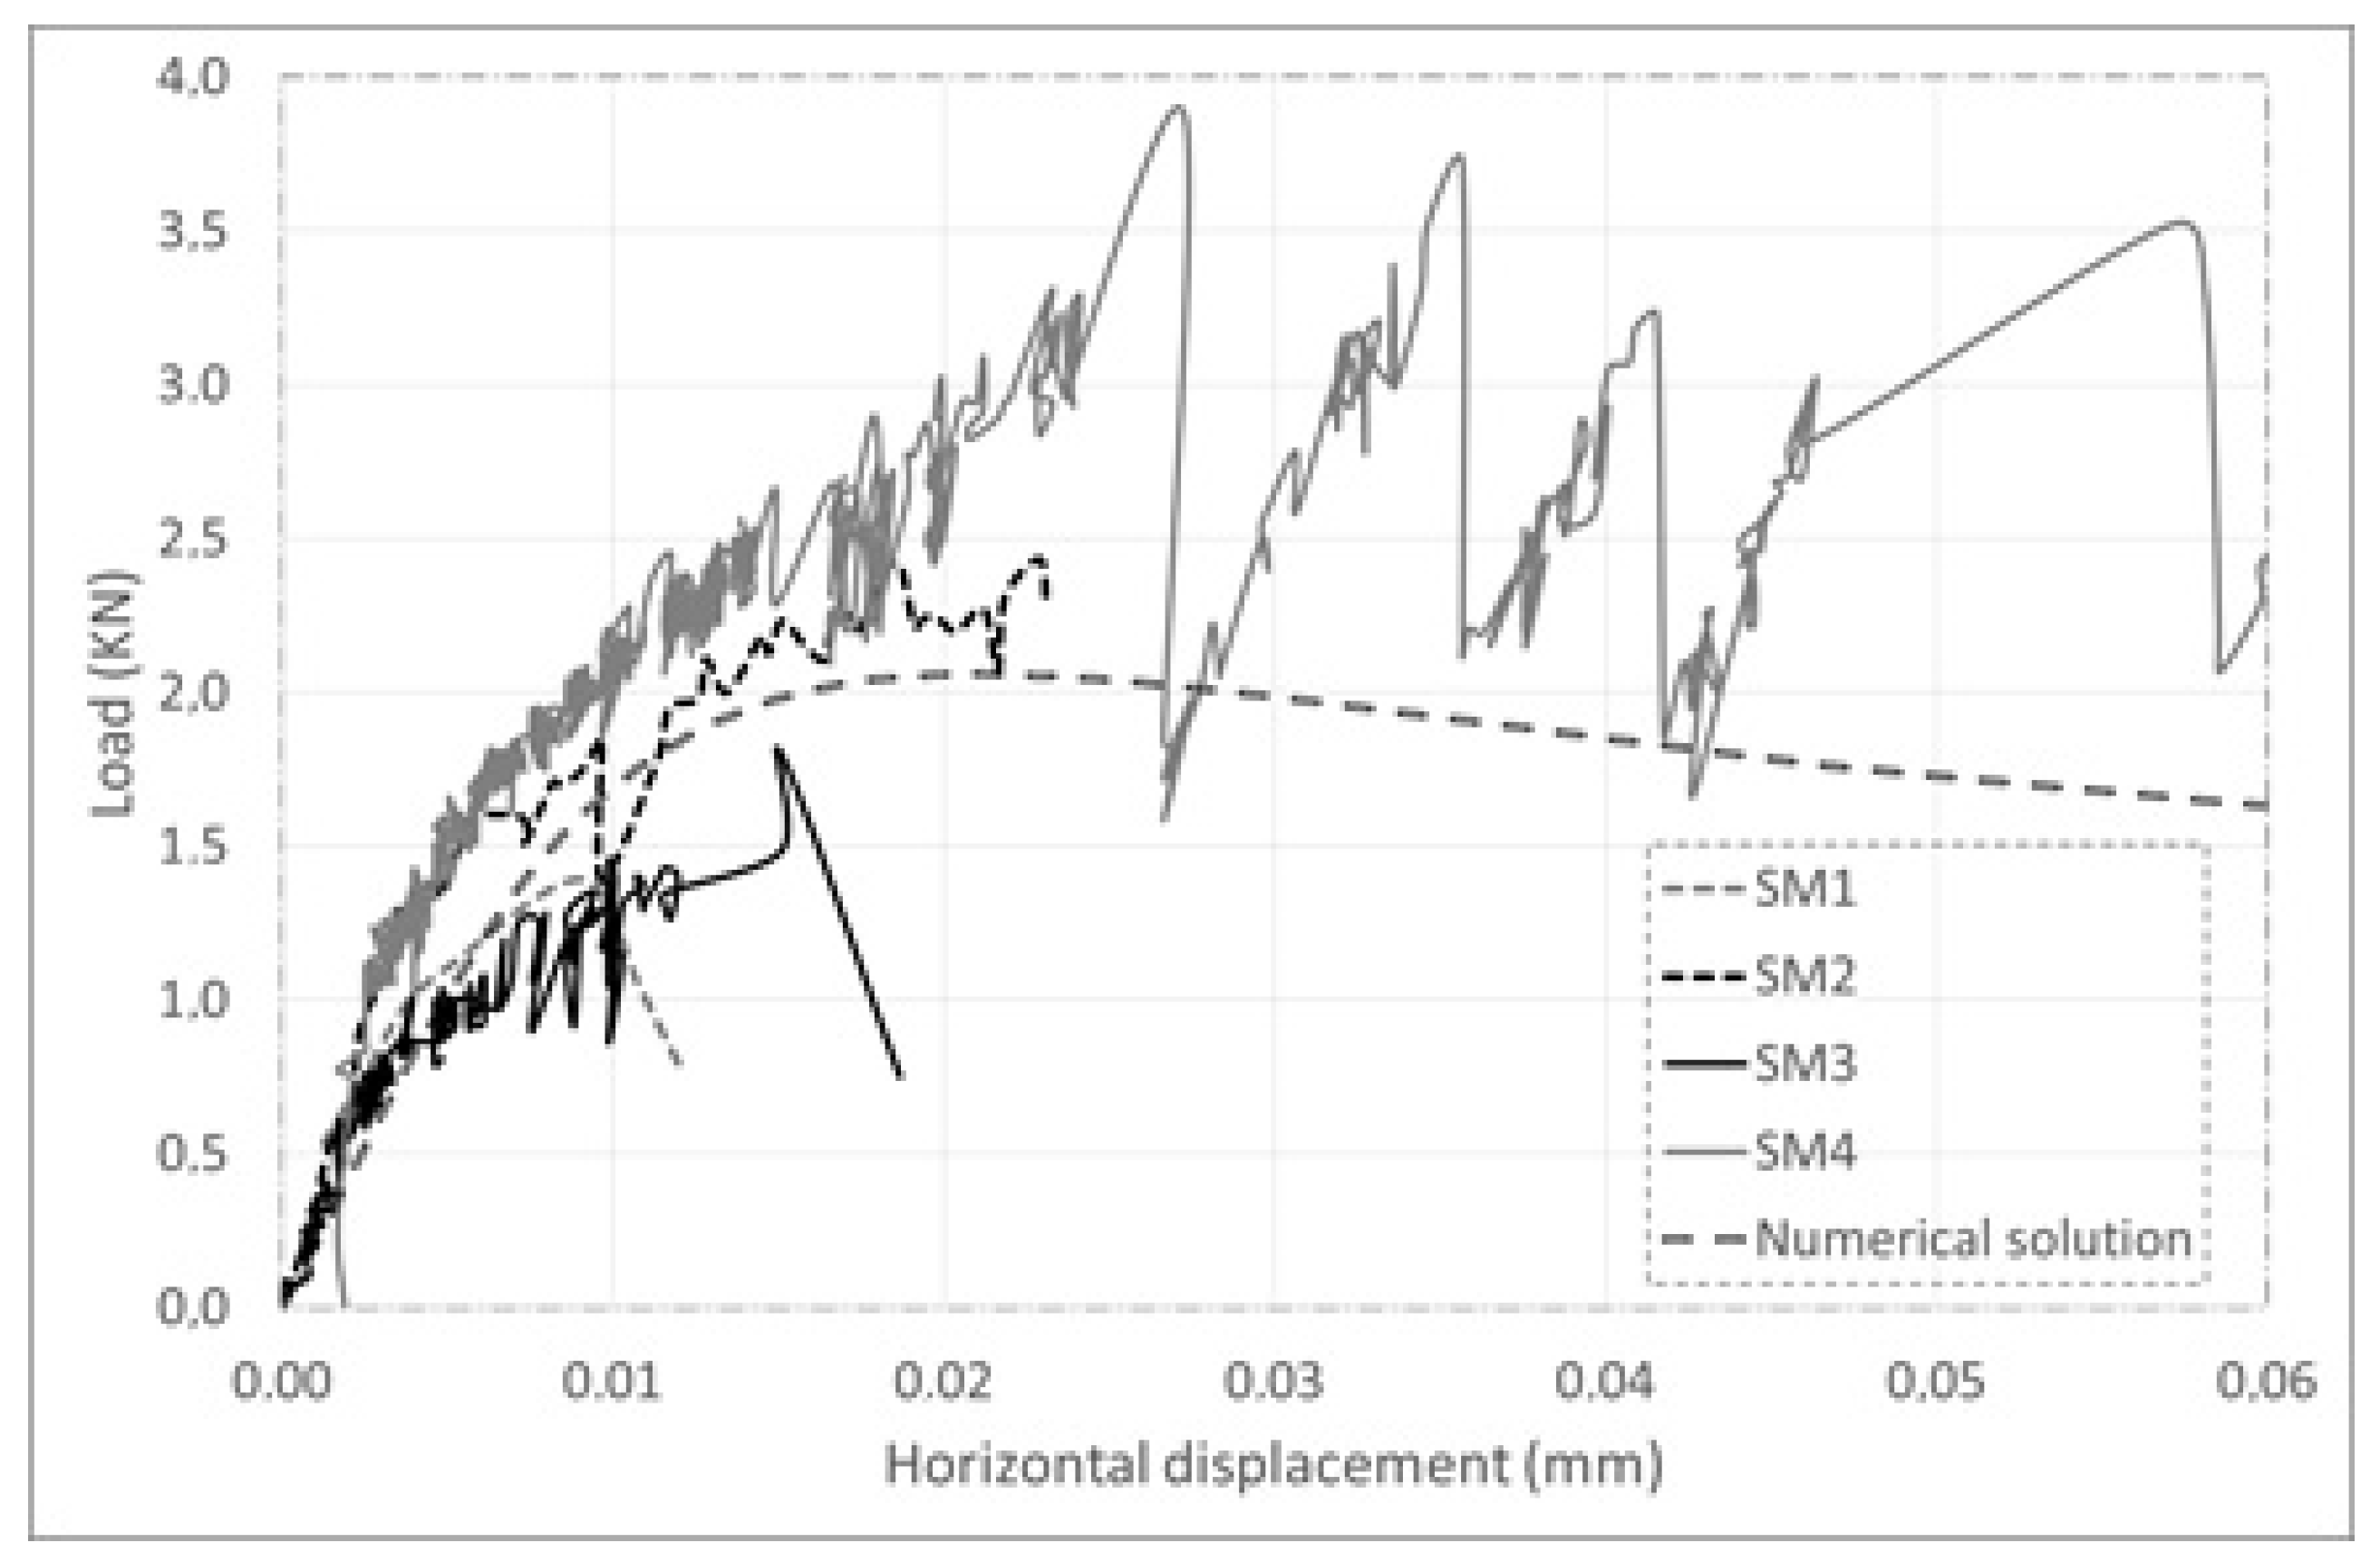
4. Numerical Simulation
5. Discussion
6. Conclusions
Author Contributions
Conflicts of Interest
References
- Bocca, P.; Grazzini, A. Mechanical properties and freezing-thawing durability of strengthening mortars. J. Mater. Civ. Eng. 2013, 25, 274–280. [Google Scholar] [CrossRef]
- Bocca, P.; Valente, S.; Grazzini, A.; Alberto, A. Detachment analysis of dehumidified repair mortars applied to historical masonry walls. Int. J. Archit. Herit. 2014, 8, 336–348. [Google Scholar] [CrossRef]
- Carpinteri, A.; Grazzini, A.; Lacidogna, G.; Manuello, A. Durability evaluation of reinforced masonry by fatigue tests and acoustic emission technique. Struct. Control Health Monit. 2014, 21, 950–961. [Google Scholar] [CrossRef]
- Carpinteri, A.; Lacidogna, G.; Accornero, F.; Mpalaskas, F.; Matikas, A.; Aggelis, D. Influence of damage in the Acoustic Emission parameters. Cem. Concr. Compos. 2013, 44, 9–16. [Google Scholar] [CrossRef]
- Barpi, F.; Valente, S. The cohesive frictional crack model applied to the analysis of the dam-foundation joint. Eng. Fract. Mech. 2010, 77, 2182–2191. [Google Scholar] [CrossRef]
- Barpi, F.; Valente, S. Fuzzy parameters analysis of time-dependent fracture of concrete dam models. Int. J. Numer. Anal. Methods Geomech. 2002, 26, 1005–1027. [Google Scholar] [CrossRef]
- Barpi, F.; Valente, S. A fractional order rate approach for modeling concrete structures subjected to creep and fracture. Int. J. Solids Struct. 2004, 41, 2607–2621. [Google Scholar] [CrossRef]
- Barpi, F.; Valente, S. Lifetime evaluation of concrete structures under sustained post-peak loading. Eng. Fract. Mech. 2005, 72, 2427–2443. [Google Scholar] [CrossRef]
- Barpi, F.; Valente, S. Modeling water penetration at dam-foundation joint. Eng. Fract. Mech. 2008, 75, 629–642. [Google Scholar] [CrossRef]
- Barpi, F.; Valente, S. Size-effects induced bifurcation phenomena during multiple cohesive crack propagation. Int. J. Solids Struct. 1998, 35, 1851–1861. [Google Scholar] [CrossRef]
- Alberto, A.; Antonaci, P.; Valente, S. Damage analysis of brick-to-mortar interfaces. In Proceedings of the 11th International Conference on the Mechanical Behavior of Materials, Lake Como, Italy, 5–9 June 2011; Elsevier: New York, NY, USA, 2011; pp. 1151–1156. [Google Scholar]
- Bocca, P.; Grazzini, A.; Masera, D.; Alberto, A.; Valente, S. Mechanical interaction between historical brick and repair mortar: Experimental and numerical tests. J. Phys. Conf. Ser. 2011, 305, 012126. [Google Scholar] [CrossRef]


| ft (N/mm2) | fs (N/mm2) | wnc (mm) | wtc (mm) |
|---|---|---|---|
| 0.8 | 1.0 | 0.015 | 0.015 |
| E (N/mm2) | ν | |
|---|---|---|
| Mortar | 7000 | 0.15 |
| Rock | 35,000 | 0.20 |
Publisher’s Note: MDPI stays neutral with regard to jurisdictional claims in published maps and institutional affiliations. |
© 2018 by the authors. Licensee MDPI, Basel, Switzerland. This article is an open access article distributed under the terms and conditions of the Creative Commons Attribution (CC BY) license (https://creativecommons.org/licenses/by/4.0/).
Share and Cite
Grazzini, A.; Lacidogna, G.; Valente, S.; Accornero, F. Detachment of Plasters in Masonry Buildings: Analysis by Acoustic Emission and Numerical Simulation. Proceedings 2018, 2, 546. https://doi.org/10.3390/ICEM18-05431
Grazzini A, Lacidogna G, Valente S, Accornero F. Detachment of Plasters in Masonry Buildings: Analysis by Acoustic Emission and Numerical Simulation. Proceedings. 2018; 2(8):546. https://doi.org/10.3390/ICEM18-05431
Chicago/Turabian StyleGrazzini, Alessandro, Giuseppe Lacidogna, Silvio Valente, and Federico Accornero. 2018. "Detachment of Plasters in Masonry Buildings: Analysis by Acoustic Emission and Numerical Simulation" Proceedings 2, no. 8: 546. https://doi.org/10.3390/ICEM18-05431
APA StyleGrazzini, A., Lacidogna, G., Valente, S., & Accornero, F. (2018). Detachment of Plasters in Masonry Buildings: Analysis by Acoustic Emission and Numerical Simulation. Proceedings, 2(8), 546. https://doi.org/10.3390/ICEM18-05431