Proceeding Paper

Application of Electronic Speckle Pattern Interferometry Method for Simultaneous Measurement of Young’s Modulus and the Poisson’s Ratio of Metals †

by
Alexandre Michtchenko
Instituto Politécnico Nacional, Seccion de Estudios de Posgrado e Investigación, ESIME-ZAC, México 07738, Mexico
Presented at the 18th International Conference on Experimental Mechanics (ICEM18), Brussels, Belgium, 1–5 July 2018.
Proceedings 2018, 2(8), 521; https://doi.org/10.3390/ICEM18-05396
Published: 28 June 2018
(This article belongs to the Proceedings of The 18th International Conference on Experimental Mechanics)

Abstract

:
In this paper, mechanical experiments with a low-cost interferometry set-up are presented. The set-up is suitable for an undergraduate laboratory where optical equipment is absent. The arrangement consists of two planes of illumination, allowing the measurement of the two perpendicular in-plane displacement directions. An axial load was applied to three different metals, and the longitudinal and transversal displacements were measured sequentially. A digital camera was used to acquire the images of the different states of the load of the illuminated area. A personal computer was used to perform the digital subtraction of the images to obtain the fringe correlations, which are needed to calculate the displacements. Finally, Young’s modulus and Poisson’s ratio of the metals were calculated using the displacement data.

1. Introduction

Electronic Speckle Pattern Interferometry (ESPI) is a technique for full-field displacement measurement and has been well accepted in experimental mechanics field [1,2]. Sophisticated equipment has been developed for this purpose, and usually employ relative expensive items such as CCD camera, frame grabber, mirror mounts, PZT, etc. in order to meet certain accuracy in the measurements [3]. Experiments with low-cost devices such as a digital camera and a diode laser have been reported [4,5,6,7]. In order to measure the two perpendicular displacement directions with ESPI, it is necessary to develop a two in-plane measurement setup [8,9,10,11]. In this paper experiments for two in-plane measurements were performed using a digital camera as the medium of acquiring images and a diode laser as a coherent light source. Three different metals (aluminium, copper and brass) were tested under uniaxial load by means of an axial testing machine. Displacements in the axial and the transversal directions were measured for each material. The Young´s modulus and the Poisson´s ratio were obtained for the three metals. The calculated values of these mechanical properties are compared with those reported on the reference [12]. Results obtained revealed that Young’s modulus and the Poisson’s ratio calculated are close to the reference values.

2. Materials and Methods

The in-plane ESPI setup permits to detect and measure displacements that occur over the plane of the surface of the object [13]. Figure 1 shows the basic elements of the In-plane arrangement. It consists of a laser source, a beam expander, a beam splitter, a CCD camera and two mirrors. The in-plane setup shown in Figure 1 allows measuring displacements in the vertical direction, namely the x-direction. The laser beam is expanded and then split into two beams with equal intensities by the beam splitter. The two resulting beams reach the two opposite mirrors and then are redirected to the object surface forming an angle θ with respect to the optical axis. The CCD camera captures the speckle images of the object in its different states of load. The load is applied by means of an axial tensile machine.
For the subsequent consider the Figure 2. The phase change due to a displacement is given by the expression
ϕ = 2 π λ ( k 2 k 1 ) · d  
where k 1 and k 2 are the illumination vector and the observation vector respectively and d is the displacement vector whose components are d i + d j + d k . Since there are two illumination beams there will be two contributions to the phase change, these are:
ϕ 1 = 2 π λ ( k 2 k 1 ) · d  
ϕ 2 = 2 π λ ( k 2 k 1 ) · d  
The total phase difference is then
ϕ = ϕ 2 ϕ 1  
ϕ = 2 π λ ( k 1 k 1 ) · d
According to the geometry of the scheme shown in Figure 2, the phase difference is:
ϕ = 2 π λ ( 2 i * s e n θ   ) · ( d i + d j + d k )
ϕ = 4 π λ d x   s e n θ  
Equation (4) reveals that for the in-plane setup of Figure 1 is only sensible in the x -direction. This means that the phase change is due to the displacement of d x   . Thus, when the object is subject to a mechanical load, this in-plane setup will measure displacements in the vertical direction only. Additionally, if Equation (4) is equalled to the condition of ϕ = 2 π N , the displacement d x   will be in terms of the fringe order N . The resulted expression is:
d x   = n λ 2 s e n θ  
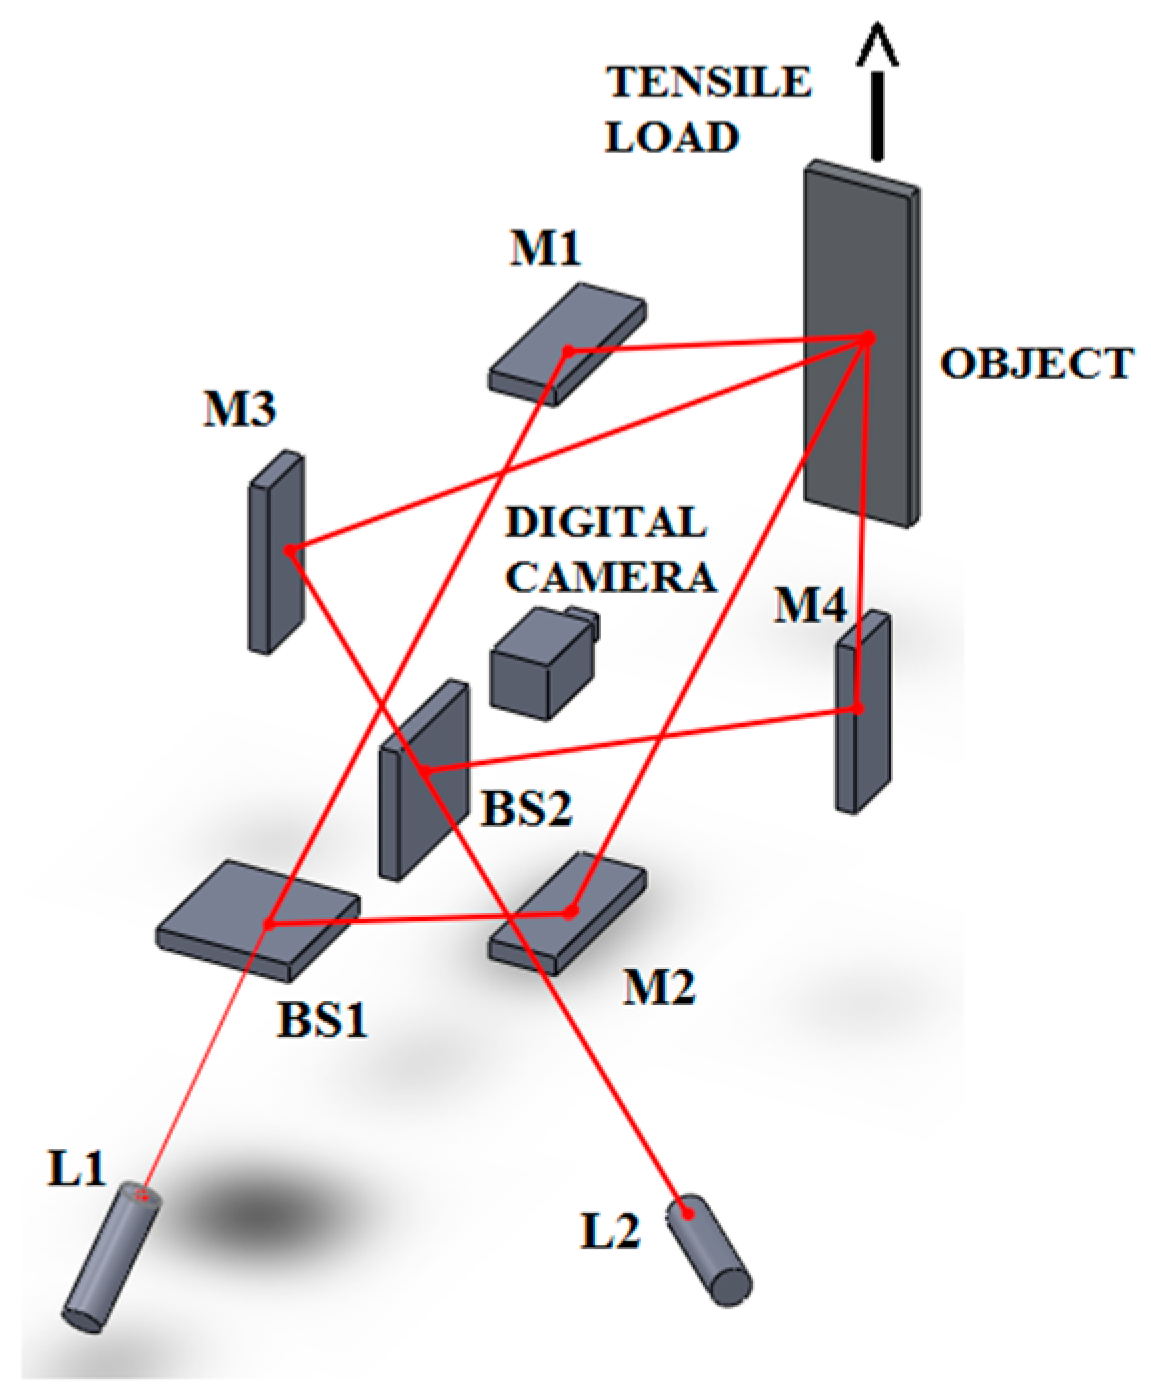
Thus, knowing the wavelength λ , the angle of illumination θ and the fringe number obtained after the subtraction of the image of the deformed state from that of the reference state, the displacement d x   could be calculated. Furthermore, if the illuminating beams are rotated 90 degrees the sensitivity vector will change to the y -axis, and therefore the system will allow measuring displacements in the y -direction. An arrangement, which has the two illumination plane, will permit the measurement of displacements in both the x -direction and the y -direction, simultaneously or sequentially. Figure 3 shows the dual beam ESPI setup implemented in this work. The CCD camera was replaced by the digital camera.
Mechanical Aspects
In this work, two important mechanical properties are determined; these are Young’s modulus and the Poisson’s ratio. These properties are represented by the next formulas respectively:
E = σ ε  
υ = ε t r ε a x  
where σ is the stress value in the axial direction, ε is the strain, ε t r represents the transversal strain and ε a x the axial strain. Additionally, the stress and strain are given by the next expressions.
σ = F A  
ε = Δ l L  
where F is the applied force, A is the cross-section of the specimen, Δ l is changing in length (the suffered displacement, in this case) and L is the original length of the specimen. The same formulas are applicable for both the axial direction and the transversal direction. If the application load and the geometry of the tested specimen are known then is possible to compute the stress under which the object is subjected. Regarding the strains, it is necessary to measure the displacements that the object suffers in the two perpendicular directions.

3. Experimental Details

In the experiments performed in this work, two 5-mW diode laser with λ = 650   nm were used as the required coherence light source. The lasers incorporate a beam expander so a lens expander was not necessary. It was first necessary to know the coherence length so that there will be no uncertainty while the experiments were performed with the instruments used. Thus, the coherence length was measured using a Michelson interferometer. The measured coherence length of the mentioned laser above was 3 cm. Thereby, caution was needed while the arrangement was constructed so that the optical path difference remains within this value and not lose the coherence.
The CCD-based digital camera implemented was a Nikon Coolpix P7000. The image acquisition was made using a remote control in order to avoid vibrations.
A two in-plane setup was implemented. Three different specimens were tested under uniaxial load; these were aluminium, copper and brass plates; their dimensions are 18 cm at length, 5 cm at the width and 2 mm at thick. The measurement of the displacements in the two directions was made sequentially; first in the vertical direction and finally in the horizontal direction. The objects were subjected to four load states, 5, 10, 15 and 20 kgf. In order to obtain an average of the number of fringes in each load state, twenty tests were performed for each load.
With the experimental arrangement already installed, in each test, first, a picture of the system at rest was taken. Then the first load was applied and a second image of the speckle pattern is captured. The process is repeated until the last load is reached. The pictures are transferred to a personal computer and the pixel by pixel subtraction is performed with the ImageJ software [14]. The images of each load state are subtracted from the image at the reference state. This procedure is done for the three specimens. The fringe number generated on each load state after subtraction is registered. Fringe counting was performed manually, i.e., with “simple sight”.
For the three specimens, the vertical measurements were made at an incident angle of 32.6 degrees; and for the horizontal direction, an angle of 45 degrees was set. The expanded beam in the vertical direction had a longitude of 15 mm, and for the horizontal one was of 40 mm. These data were used when the strains in the two directions were calculated.

4. Result and Discussion

In Table 1 the averages of resulting fringes at each load state for the three specimens are presented.
Subsequently, from the number of fringes at each load state and each direction, the displacements are calculated according to Equation (5). These results are reported in Table 2.
Since the forces applied to the specimens are small, the tests are assured to be in the elastic regime. The Young’s modulus is the slope of the stress-strain graph. Then, it is necessary first to calculate the axial stress at each load state and secondly the strain in the same direction.
In Table 3 the computed values of Young’s modulus for each material are reported. Additionally, in Table 3 the known value of Young’s modulus is presented; also the percent difference between these two values is reported.
From Table 3 it is easily seen that the difference between the calculated Young’s modulus and the presented in the table of mechanical properties is relatively small.
The Poisson’s ratio can be calculated by the Equation (7). First, the train in each direction is calculated. For this, the displacement suffered in the transversal direction is divided by the length of the expanded incident beam in that direction. The same is done for the axial direction. At each load state a Poisson’s ratio is obtained, and finally, the average is computed. In Table 4 a comparative of the calculated and the known Poisson’s ratio is presented.
Table 4 shows that the Poisson’s ratio obtained with the data of the displacements is also close to that reported in the reference.

5. Conclusions

In this work, an ESPI system which is capable to measure two mutually orthogonal in-plane micro-displacements was presented. Measurements were performed sequentially. From the displacements, strain in both directions was calculated. Three different metallic specimens were tested and Young’s modulus and the Poisson’s ratio were calculated for each of them. A comparison of these calculated mechanical properties with those reported on the reference was made. Results obtained are close to the expected. Although three metals were tested in this work, this tool can be used to measure displacements in a great variety of metallic materials or even in new materials such as composite materials, carbon fibre, etc.

Author Contributions

A.M. and J.B.P.F. conceived and designed the experiments; O.B.P. performed the experiments and analyzed the data; J.B.P.F. wrote the paper.

Conflicts of Interest

The authors declare no conflict of interest.

References

  1. Jacquot, P. Speckle Interferometry: A Review of the Principal Methods in Use for Experimental Mechanics Applications. Strain 2008, 44, 57–69. [Google Scholar] [CrossRef]
  2. Mohan, K.; Rastogi, P. Recent developments in digital speckle pattern interferometry. Opt. Lasers Eng. 2003, 40, 439–445. [Google Scholar] [CrossRef]
  3. Sirohi, R.S. Optical Methods of Measurement, Wholefield Techniques, 2nd ed.; CRC Press: New York, NY, USA, 2009; pp. 149–191. [Google Scholar]
  4. Vannoni, M.; Molesini, G. Speckle interferometry experiments with a digital photocamera. Am. J. Phys. 2004, 72, 906–909. [Google Scholar] [CrossRef]
  5. Vannoni, M.; Molesini, G. In-plane, out-of-plane and time-average speckle interferometry experiments with a digital photocamera. In Proceedings of the Photonic Engineering Opto-Ireland, Dublin, Ireland, 4–6 April 2005; Volume 5827, pp. 617–626. [Google Scholar]
  6. Vannoni, M.; Trivi, M.; Arizaga, R.; Rabal, H.; Molesini, G. Dynamic speckle imaging with low-cost devices. Eur. J. Phys. 2008, 29, 967–975. [Google Scholar] [CrossRef]
  7. Monowar, A.K.; Kawazoe, M. Electronic Speckle pattern interferometry using compressed images from a digital still camera. Opt. Eng. 1998, 37, 1599–1601. [Google Scholar]
  8. Moore, A.J. An electronic speckle pattern interferometer for complete in-plane displacement measurement. Meas. Sci. Technol. 1996, 1, 1024–1030. [Google Scholar] [CrossRef]
  9. Fan, H.; Wang, J.; Tan, Y.H. Simultaneous measurement of whole in-plane displacement using phase-shifting ESPI. Opt. Lasers Eng. 1997, 28, 249–257. [Google Scholar] [CrossRef]
  10. Martinez, A.; Rayas, J.A. Simultaneous measurement with one-capture of the two in-plane components of displacement by electronic speckle pattern interferometry. Opt. Commun. 2008, 281, 4291–4296. [Google Scholar] [CrossRef]
  11. Parra-Michel, J.; Martinez, A.; Rayas, J.A. Computation of rack tip elastic stress intensity factor in mode I by in-plane electronic speckle pattern interferometry. Revista Mexicana de Física 2010, 56, 394–400. [Google Scholar]
  12. Boresi, A.P.; Schmidt, R.J. Advanced Mechanics of Materials, 5th ed.; Wiley: New York, NY, USA, 1992. [Google Scholar]
  13. Leendertz, J.A. Interferometric displacement measurement on scattering surfaces utilizing speckle effect. J. Phys. E 1970, 3, 214–218. [Google Scholar] [CrossRef]
  14. ImageJ. An open platform for scientific image analysis. Available online: http://imagej.net (accessed on 16 July 2018).
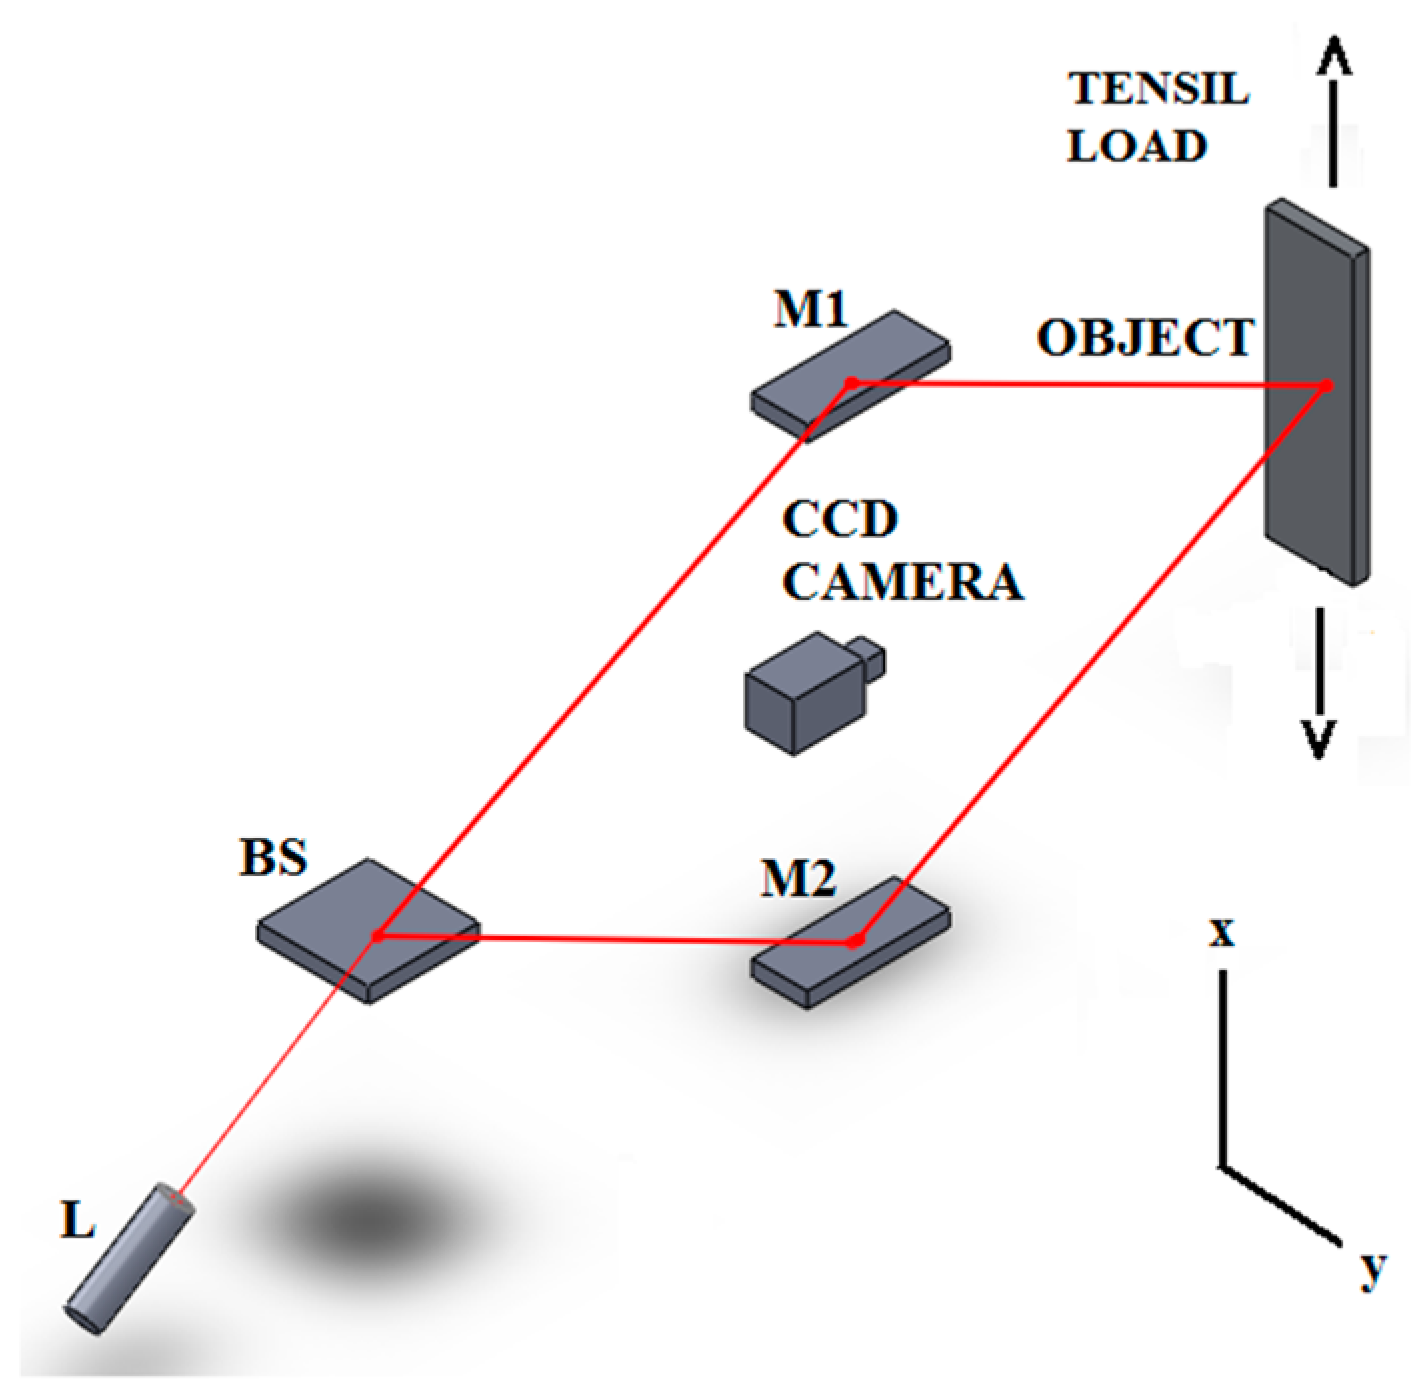
Figure 1. The In-plane ESPI setup. Laser (L), Beams Splitter (BS), Mirrors (M), CCD camera.
Proceedings 02 00521 g001
Figure 2. Two incident beams represent two illumination vectors, and the direction of image acquisition represents the observation vector.
Proceedings 02 00521 g002
Figure 3. Scheme of the dual In-plane measurement setup implemented in this work. Lasers (L1 and L2), Beams splitters (BS1 and BS2), Mirrors (M1 and M2), Digital camera.
Proceedings 02 00521 g003
Table 1. Average number of fringes at four load states for each material.
Load (kgf)AluminiumCopperBrass
AxialTransversalAxialTransversalAxialTransversal
56.237.54.84.93.674.5
1011.5513.58.28.87.378.6
1516.3620.5121310.8512.9
2020.9627.51517.513.9716.9
Table 2. Displacement at each load state for each material.
Load (kgf)Displacement (μm)
AluminiumCopperBrass
AxialTransversalAxialTransversalAxialTransversal
53.73.32.22.12.21.9
106.95.94.43.84.43.7
159.89.06.55.76.55.6
2012.612.18.37.78.37.4
Table 3. The calculated Young modulus value, the known value and the percent difference.
MaterialCalculated Young’s Modulus (GPa)Young’s Modulus from Reference (GPa)The Difference (%)
Aluminium70.2871.702.0
Copper104.801104.70
Brass111.58110.301.16
Table 4. The calculated Poisson’s ratio value, the known value and the percent difference.
MaterialCalculated Poisson’s RatioPoisson’s Ratio from ReferenceDifference (%)
Aluminum0.330.330
Copper0.340.352.8
Brass0.330.355.7
Publisher’s Note: MDPI stays neutral with regard to jurisdictional claims in published maps and institutional affiliations.