1. Introduction
Infrastructures such as bridges and building are deteriorating, and inspection is becoming important. When a crack occurs in a concrete bridge, steel bridge, or a building, it is important to perform a safety check to confirm whether the crack width increased or decreased. Currently, the crack width is measured by human eye or by a π gauge with a strain gauge [
1]. The resolution of the method by human eye is not suitable due the amount of time it takes and it is quite dangerous to work at high altitudes on the infrastructures. The π gauge is very expensive and is not useable for bridges due the required amplifier and power supply. Although measuring methods using Moiré etc. have also been proposed, these systems are not easy to use and the accuracy is not high [
2,
3].
On the other hand, the authors previously proposed sampling moiré method [
4] and one-pitch phase analysis (OPPA) method [
5]. In the sampling moiré method, phase shifted moiré fringes are generated by down-sampling (thinning-out) of a grating image, and deformation of the grating is measured accurately by the phase analysis. In the OPPA method for measuring the shape of an object, the phase of a grating projected onto the object is detected by using the brightness data of one pitch of the grating, and then the 3D shape is analyzed with higher precision. In this research, the authors propose a method to measure small displacements of objects such as cracks using the sampling moiré method and the OPPA method. It is possible to measure incremental displacement of a crack width precisely and inexpensively. The theory and the applications are shown.
2. Phase Analysis of Grating
To analyze shape or deformation, grating phase analysis methods such as phase shifting method [
6] and Fourier transform profilometry [
7] are used. These phase analysis of grating provides accurate 3D shape or deformation.
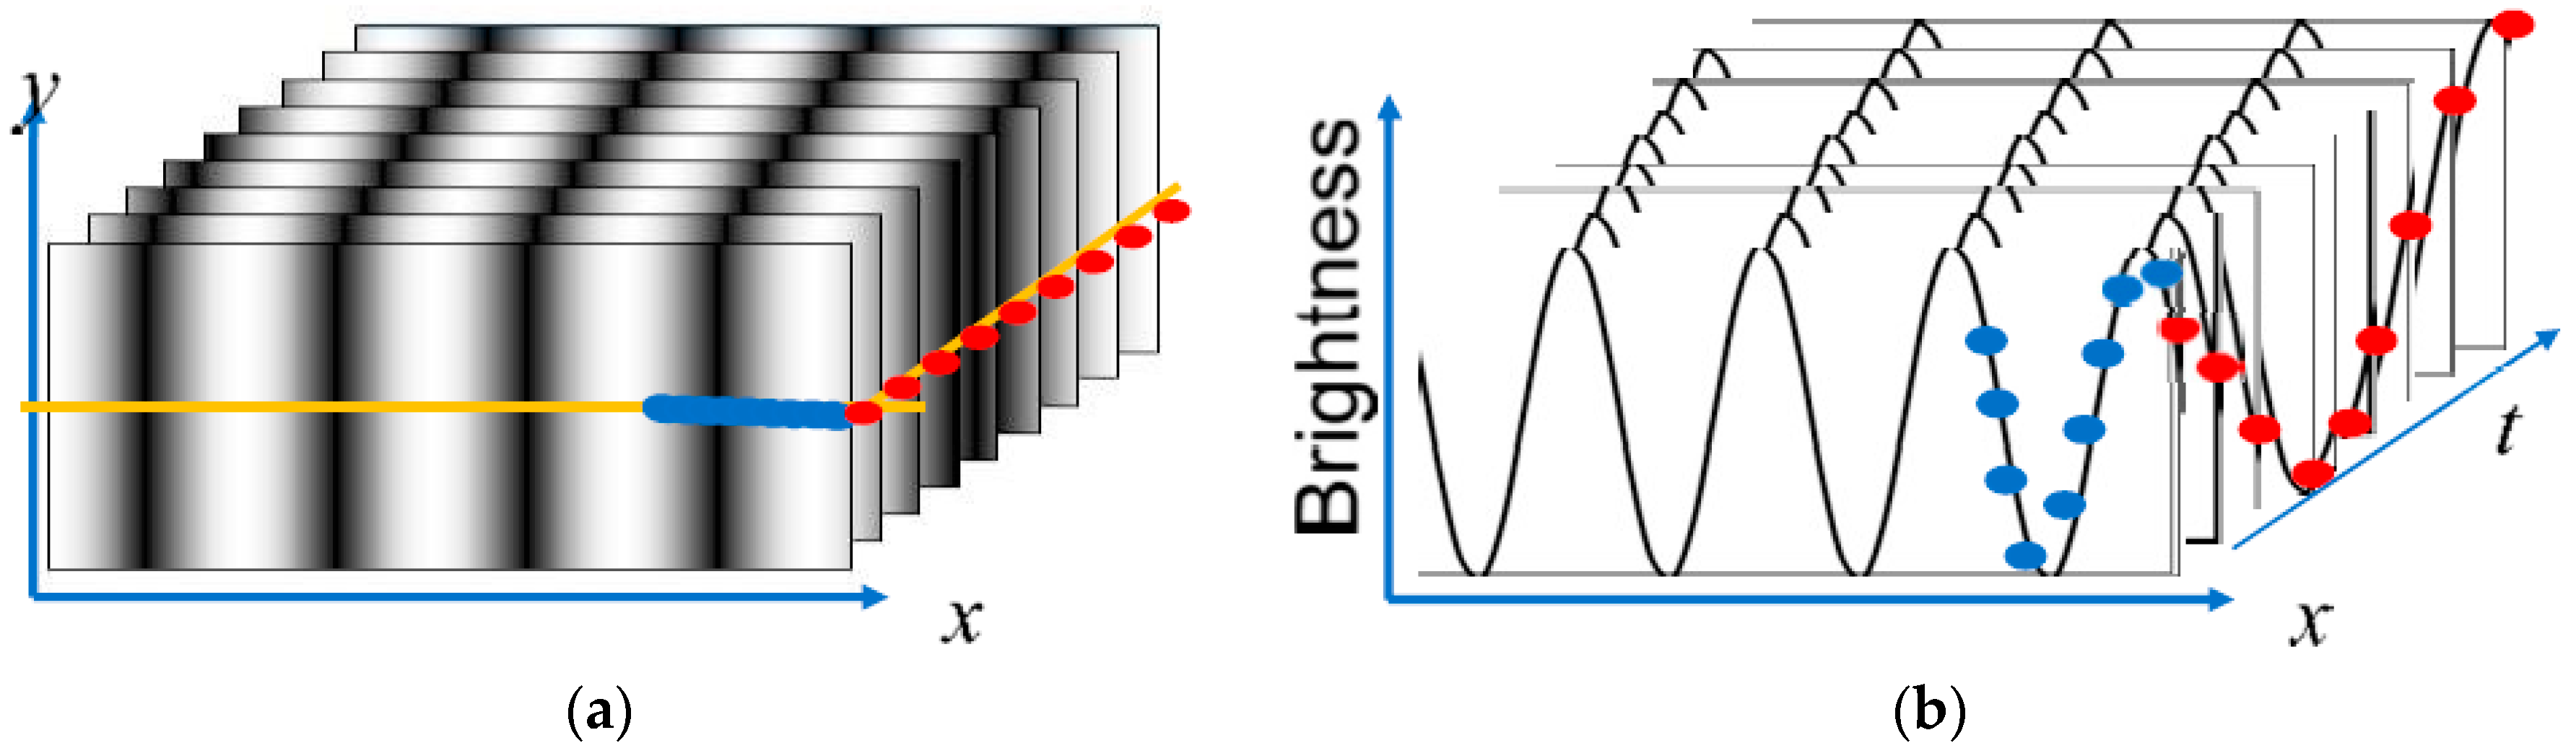
Figure 1 shows the schematic grating images obtained by shifting the phase of projected grating onto an object for measuring 3D shape of the object. In
Figure 1a, phase shifted nine images are shown. The brightness distributions along the center lines of the images are shown in
Figure 1b. The brightness change during one cycle of phase shifting at the end of the center lines is shown with red points. The Phase shifting method uses these brightness data of red points in
Figure 1a,b. However, it is also possible to analyze the phase by using blue points for one cycle along the center line of a single-shot image. Sampling moiré method and OPPA method use these blue point data for analyzing the phase. In phase shifting method, the object should not move during phase shifting. On the other hand, sampling moiré method and OPPA method are useful for real-time or high-speed measurement for moving objects because the phase analysis can be performed from a single-shot image of a structure with a grating.
2.1. Sampling Moiré Method [4]
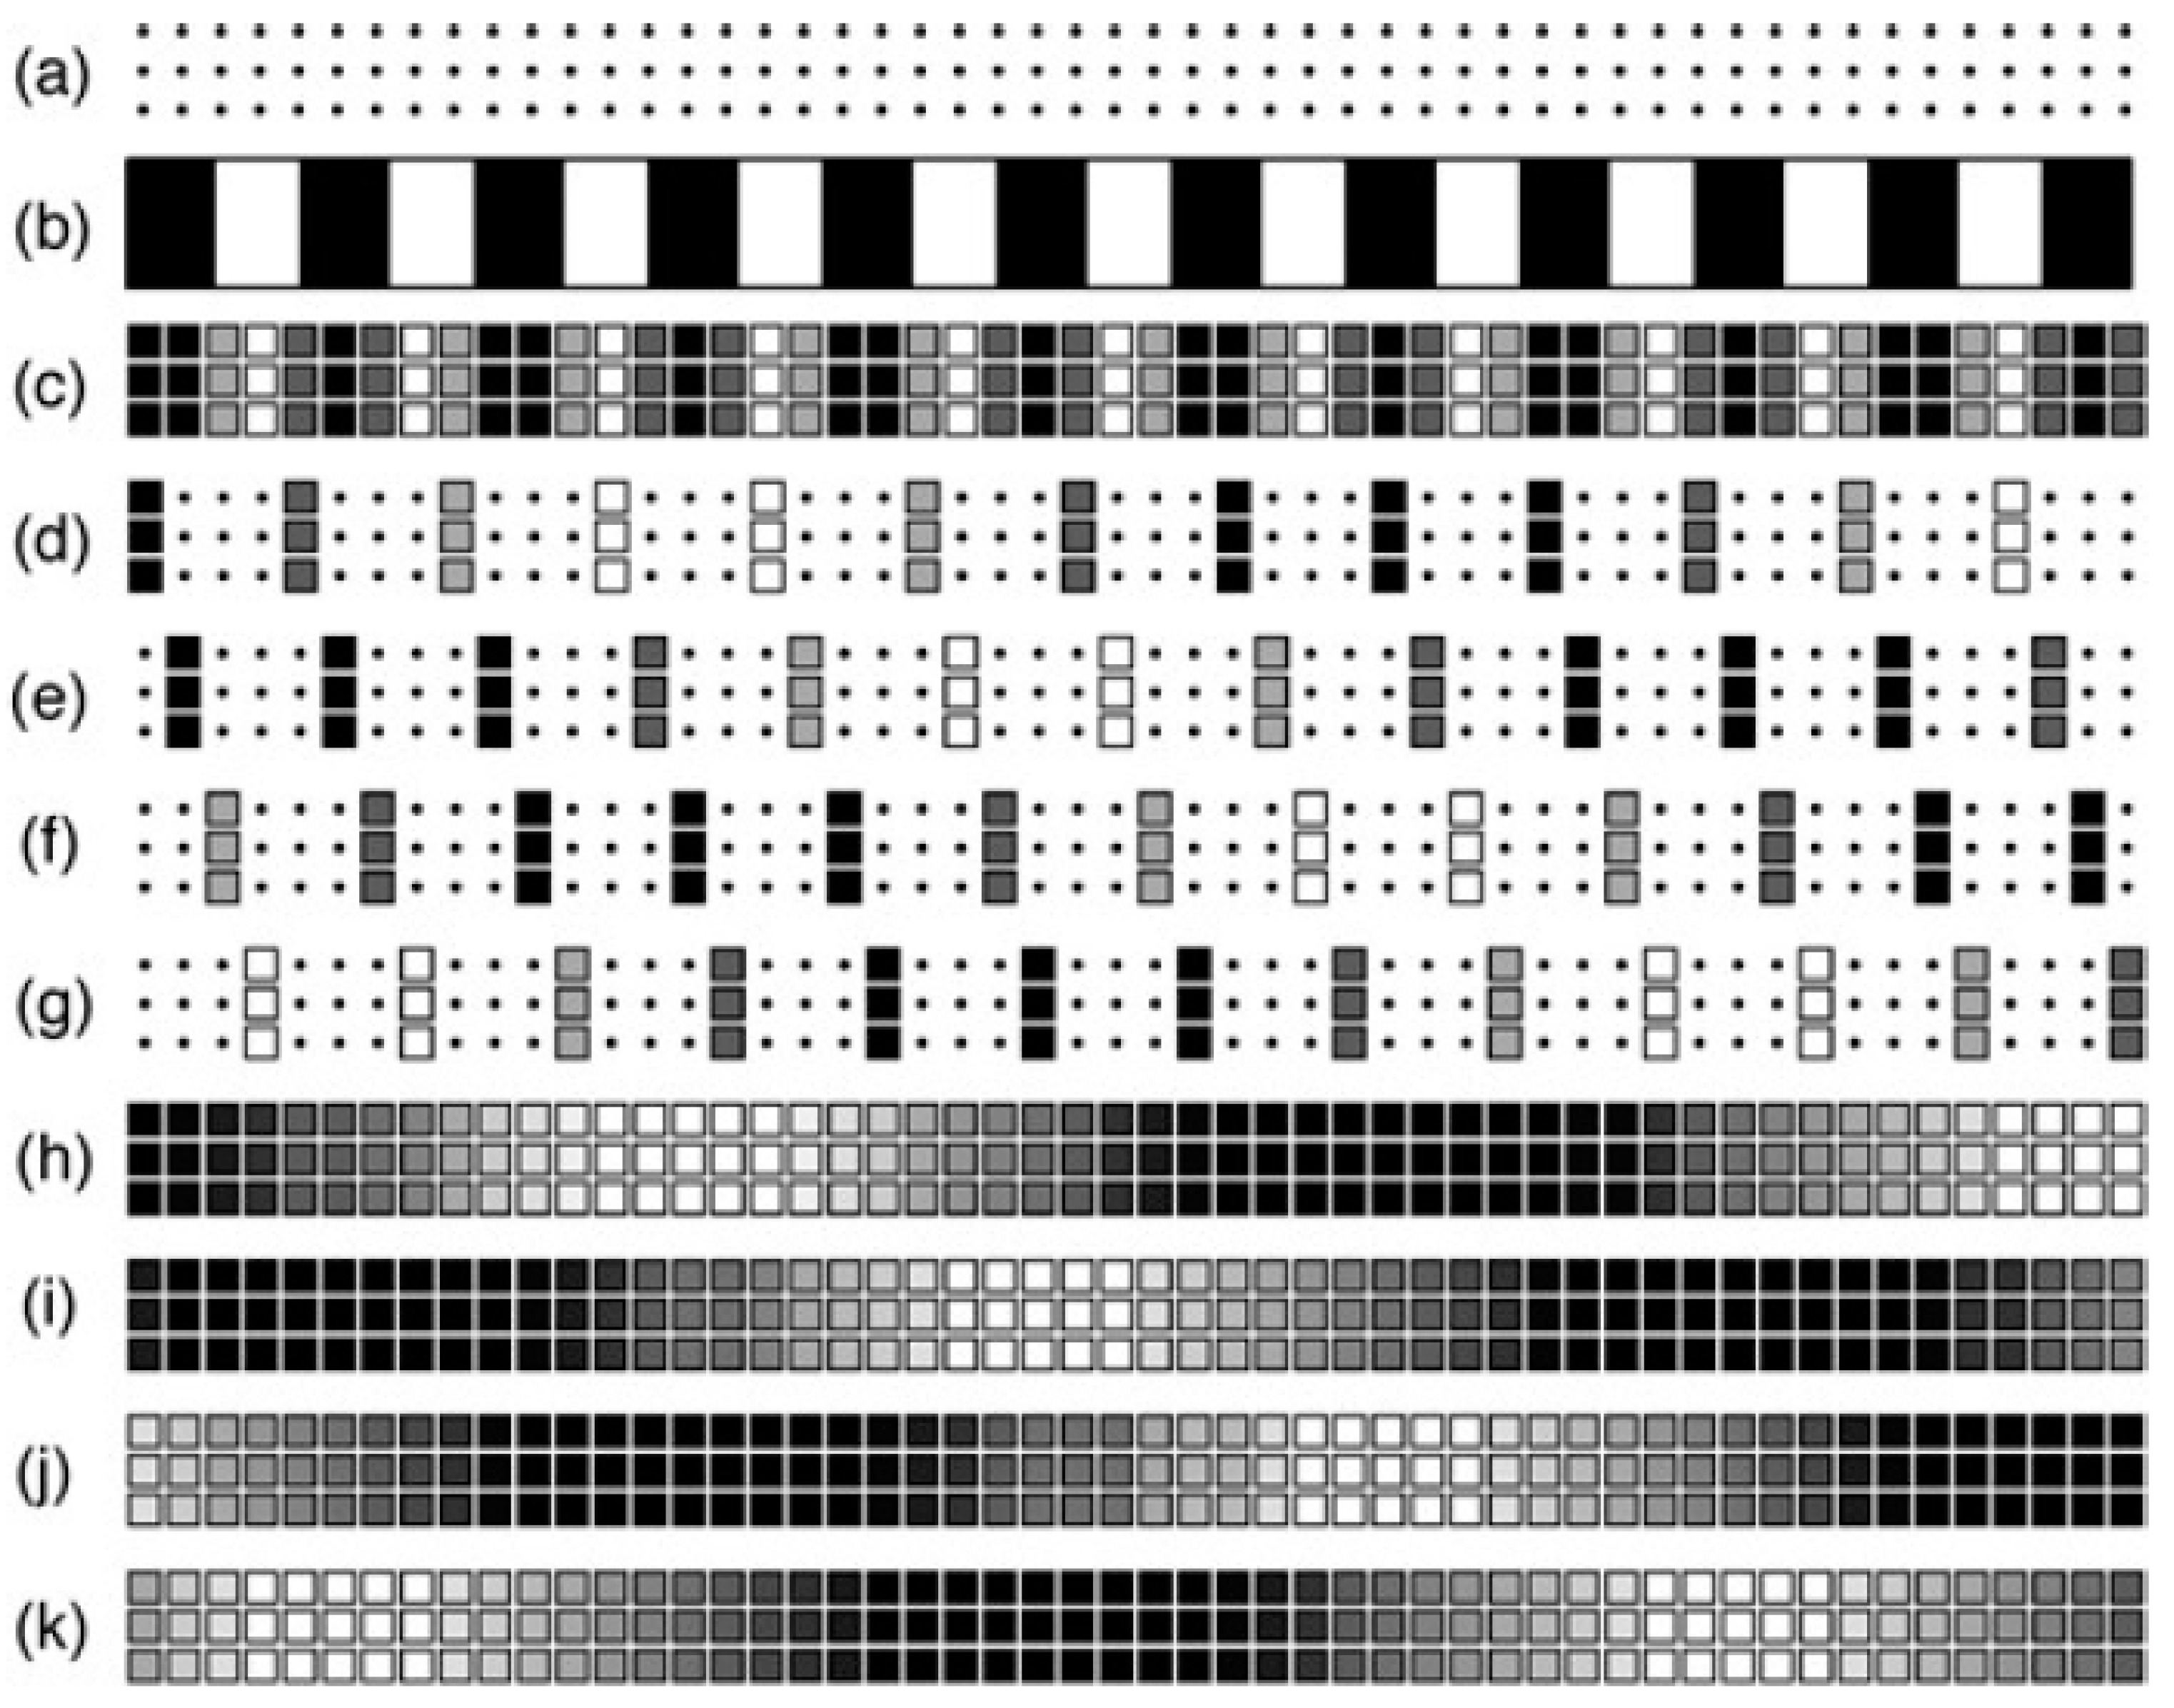
The theory of the sampling moiré method is shown in
Figure 2.
Figure 2a shows pixel points which are sampling points of a camera.
Figure 2b is the grating on an object.
Figure 2c is the images taken at the pixels.
Figure 2d–g show sampled image by changing the thinning-out phase that is, down sampling.
Figure 2h–k show interpolated images from
Figure 2d–g. They show phase- shifted moiré fringes. From these images the phase can be analyzed by phase shifting method.
2.2. One-Pitch Phase Analysis (OPPA) Method [5]
The authors have previously proposed a new method to analyze the phase of a grating using brightness data of one pitch of the grating without interpolation shown in Sampling Moiré Method.
To measure 3D shape, a moiré topography optical system is used as shown in
Figure 3. If the pixel pitch is adjusted to
N pixels of the camera for one-pitch of the grating image, the pixel number is constant
N at any height of the object and only the phase of the one-pitch grating changes according to the height. The system does not require the control system for projection of phase-shifting.
The accuracy is fine, and the analysis speed is higher than the 3D shape measurement methods using sampling moiré method. The cost of the system is very low. This method was applied to modal analysis of a rubber plate under changing vibrating frequency. In this study, the OPPA method was applied to analyze the phase of the continuous brightness data of one pitch of the grating.
2.3. Homography Transformation
To perform accurate phase analysis of the grating, it is necessary to take a photograph so that the one pitch of the grating matches an integer number of pixels strictly. To do this, the grating photograph should be taken from the front in the direction perpendicular to the grating plane; this is troublesome for users. Even when the camera is facing an arbitrary direction, if the grating image is converted so that the image is viewed from the front and it has an integer number of pixels for one pitch of the grating by homography transformation, photographing will be easier. In this paper, the effects and the accuracy are examined by the homography transformation.
3. Grating for Crack Measurement
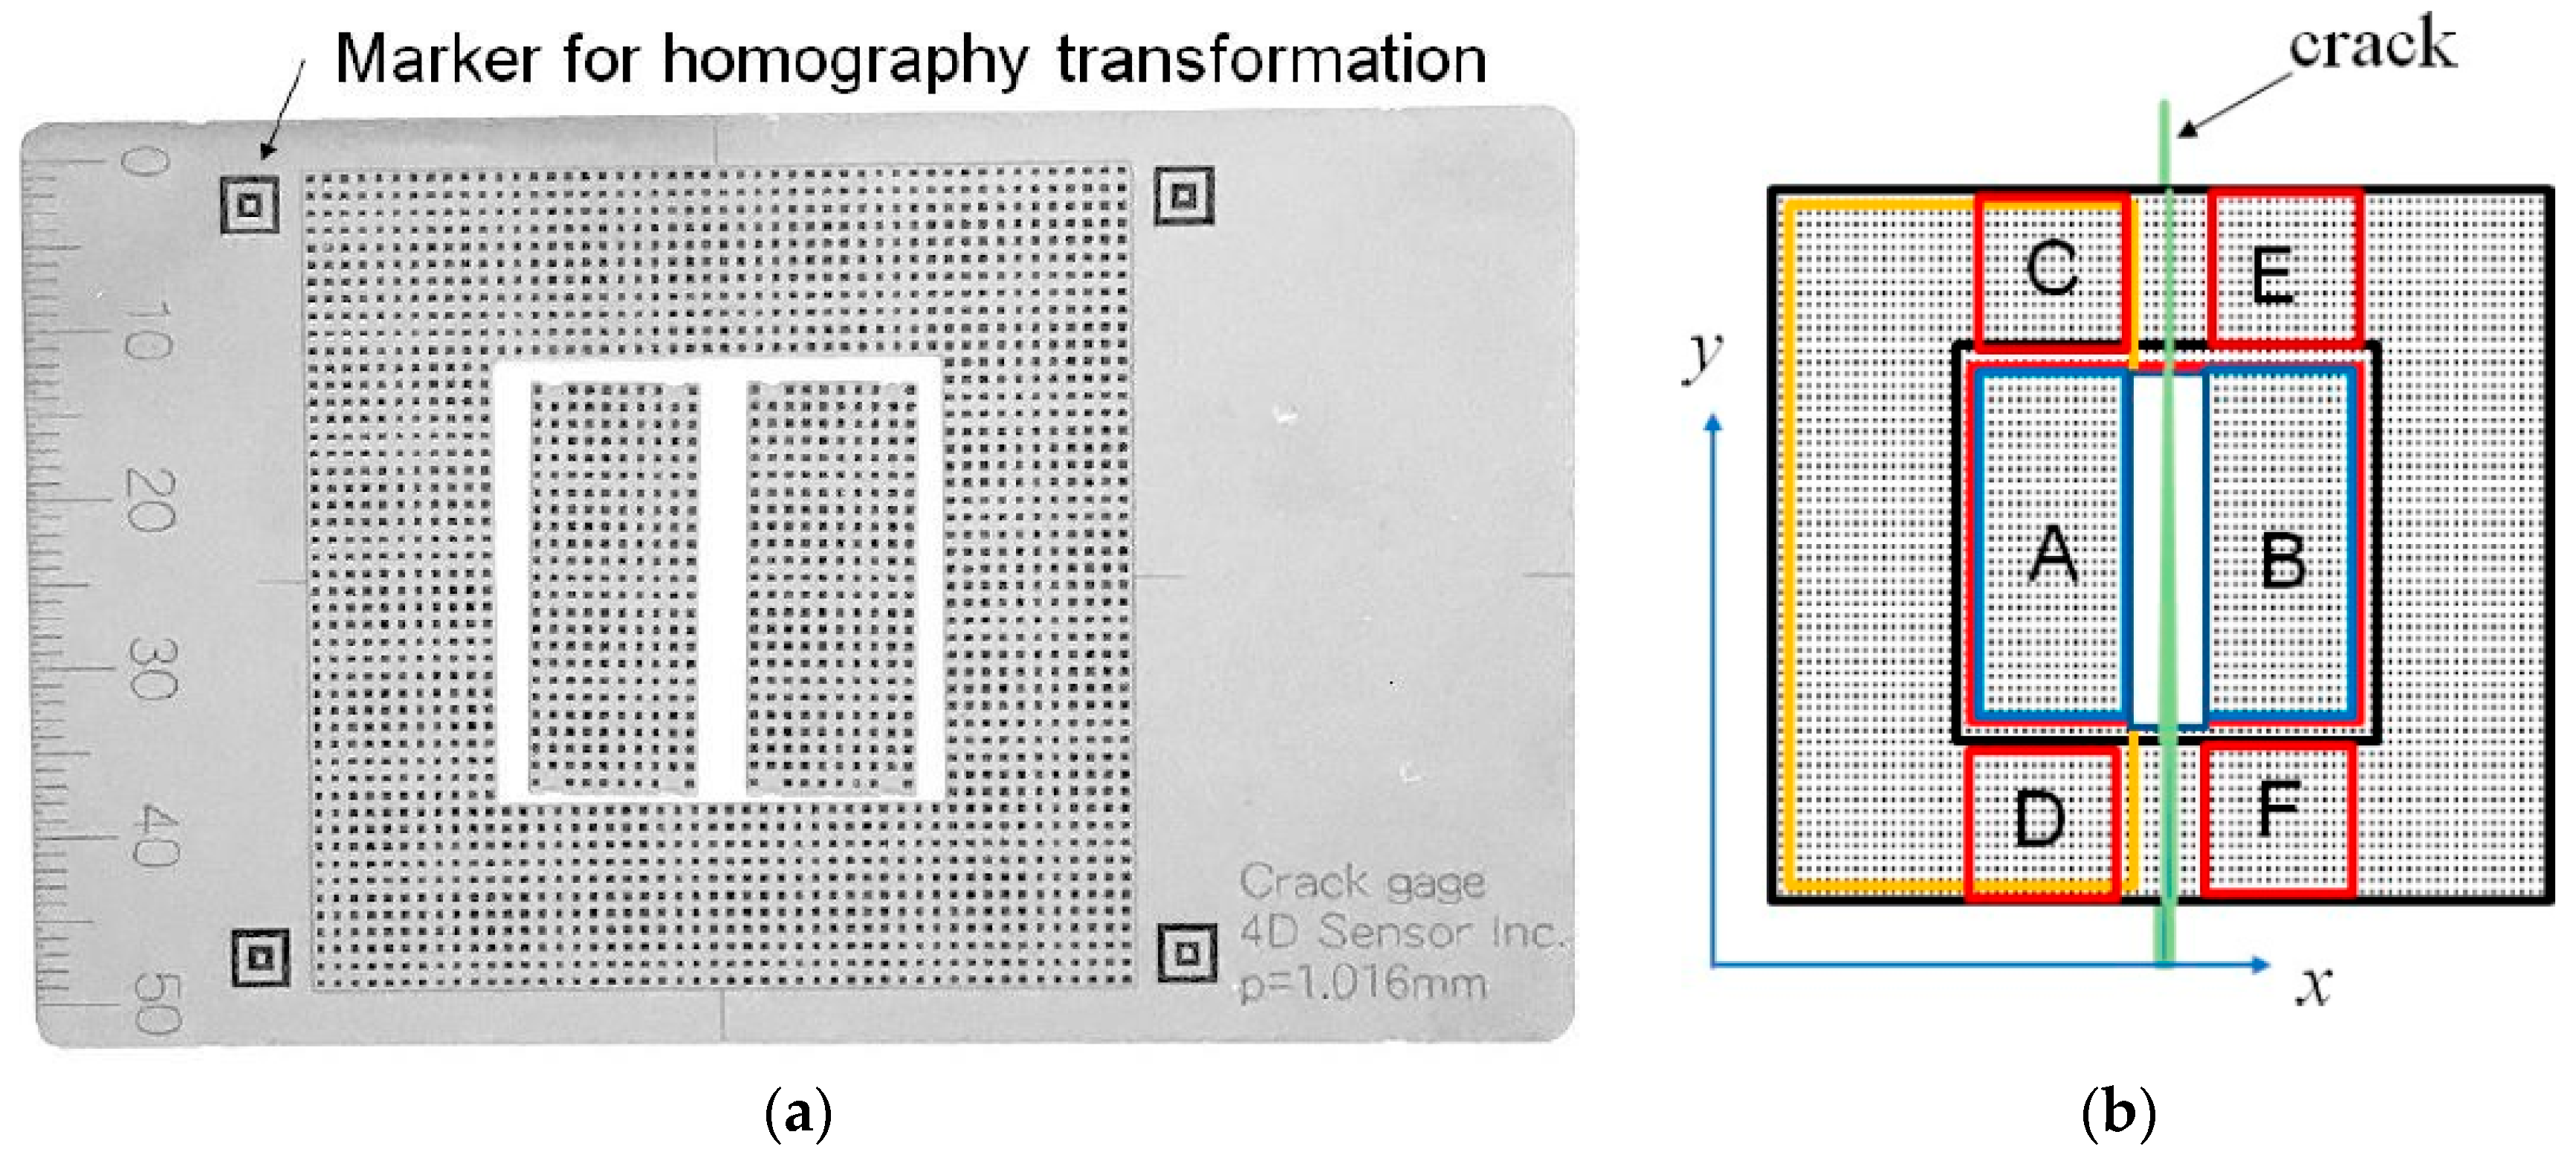
A set of three gratings used in this study is shown in
Figure 4. These gratings are made of 0.3 mm thickness stainless steel plate. It is composed of aligned 0.5 mm black squares with 1 mm pitch in the
x and
y directions, respectively. The rectangular grating plates A and B are pasted on both sides of the crack which is along the y-direction as shown in
Figure 4a.
The deformation of the grating changes the phase. However, the camera angle changes the deformation of the grating. To cancel the effect of the phase deformation according to the camera angle, gratings C, D, E and F are set on the same outer grating plate as shown in
Figure 4b. They do not deform because the outer grating plate is pasted at only the right edge far from gratings C, D, E and F. Gratings C and D are the same
x-directional position and apart the same
y-directional distance from the grating A. Gratings E and F are the same
x-directional position apart the same distance from the grating B. At the outer 4 corners, there are 4 markers for homography transformation. By detecting these markers, it is possible to automatically analyze the grating positions and the displacements.
Near the crack tip of a structure, the distributions of the displacement and the strain change greatly. However, at deviated positions from the crack tip, most of the displacement occurs at the cracked part, and at the other portions other than the crack. Thus, the deformation is almost rigid body deformation or substantially uniform elastic deformation. These gratings are photographed and the average displacements within each region of the gratings are measured by the sampling moiré method and/or the OPPA method.
To obtain the displacement, the phase of each plate is analyzed from continuous brightness data of one pitch of the grating. The brightness data is Fourier transformed and frequency one is extracted from the frequency spectrum. The inverse Fourier transform provides a very natural cosinusoidal wave and the phase calculation provides very accurate phase information. After calculating the phase difference between the phases before and after deformation, the phase differences in both the rectangular areas on both sides of the crack are averaged. The phase difference provides the increment of the crack opening width.
However, in photography, the position and direction of the camera are different each time. Even in this case, if each image is converted to a view seen from the front using the Homography transformation and one pitch can be accurately matched to an integer pixel, the phase analysis of the grating is performed with high accuracy.
The increment ∆
u of crack width is obtained from the average phases ∅
𝑩, ∅
𝑨, ∅
𝑬, ∅
𝑪, ∅
𝑭 and ∅
𝑫 in the regions
A,
B,
C,
D,
E and
F, respectively, using Equation (1).
4. Experimental Set-Up
Figure 5 shows the experimental set-up used in this paper. A precision moving table which moves vertically on a vibration isolation table is used for providing accurate displacement. The resolution of this moving table is 0.1 μm. The gratings shown in
Figure 4 are used by rotating 90 degrees shown in
Figure 5. The upper grating plate A is attached to the moving part of this moving table. The lower grating plate B is attached to the jig placed on the vibration isolation table. At the same time, the lower end of the peripheral grating plates with the regions C, D, E and F is fixed to the jig. The displacement of the grating plate is given by moving the precision moving table upward. The grating is recorded by a camera (Omron Sentech STC-MBS241U3V) with 1920 × 1200 pixels from the normal direction to the grating plates. In
Section 5.2, the grating is recorded from oblique directions at an angle of 0°, 5°, 10°, 15°, 30°, 45° to the normal direction of the grating plate.
5. Experimental Results
5.1. Measurement Error When Photographing from the Front
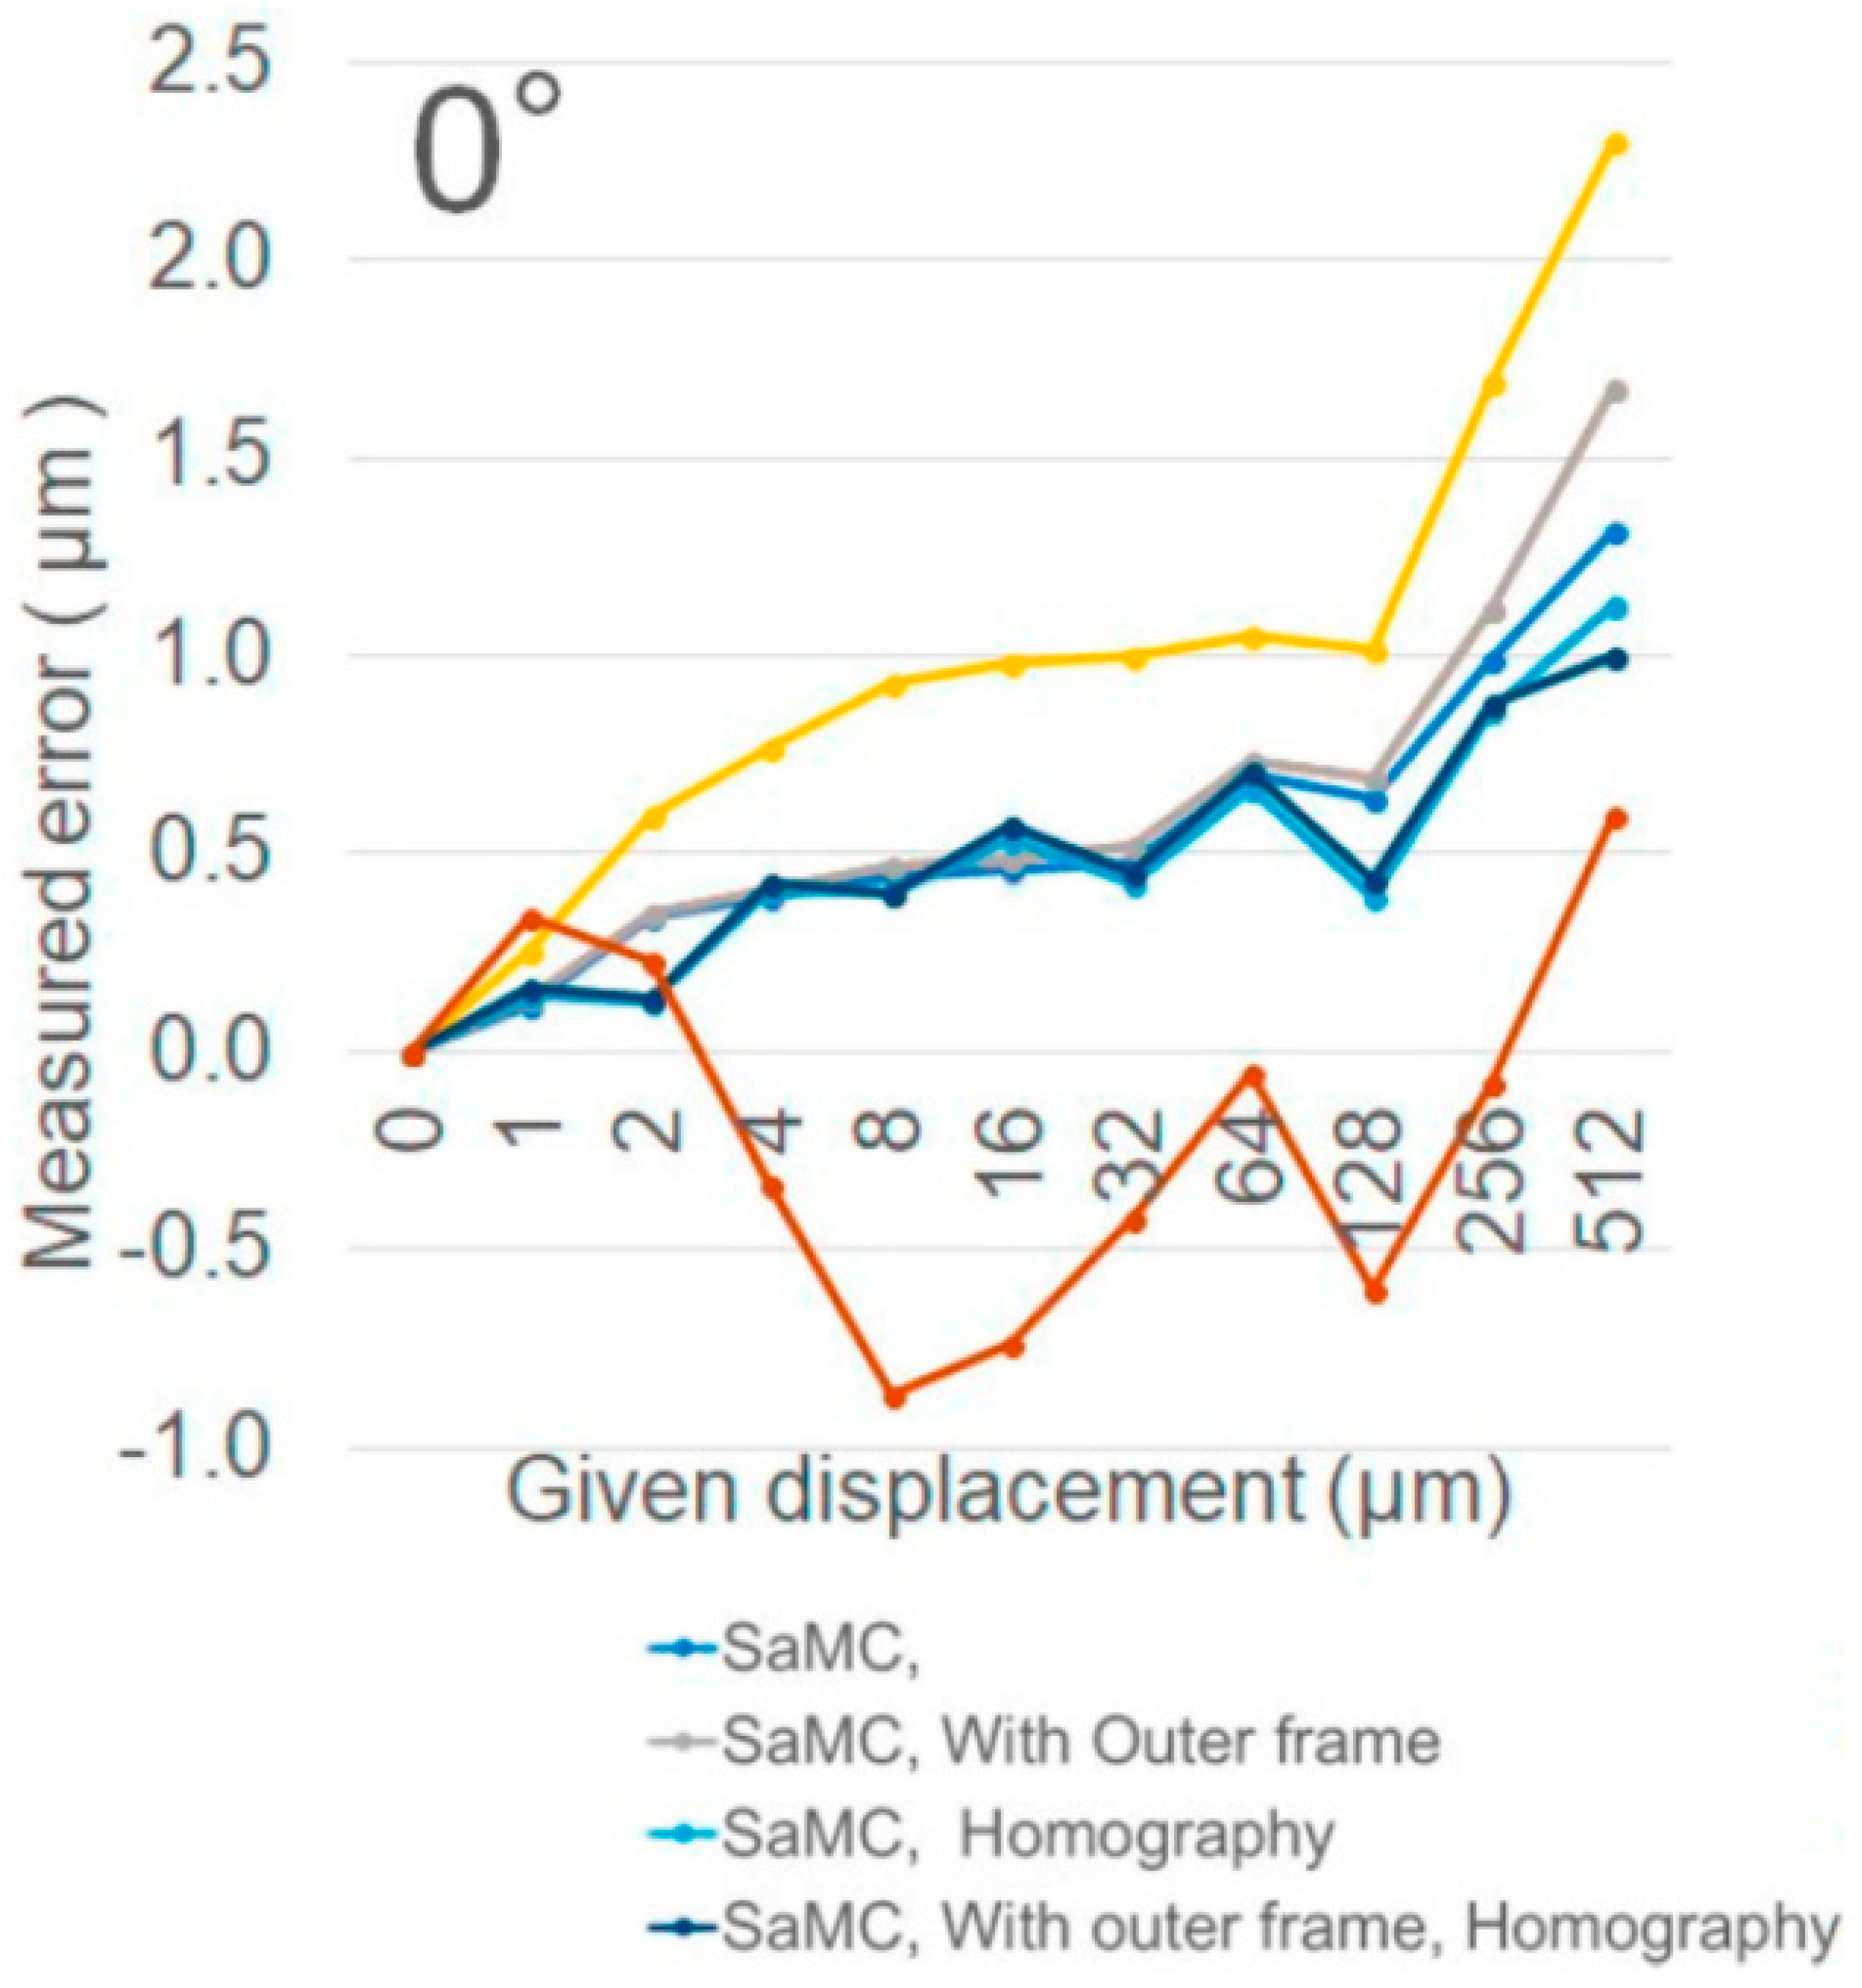
Figure 6 shows the error between the amount of movement given to the moving table and the amount of the displacement analyzed by the sampling moiré method and the OPPA method when the gratings are photographed from the front apart from the grating. The error is the difference between the given displacement of the moving table and the analyzed displacement amount. As a result, the accuracy is within the range of 0 to 2.3 μm. The displacement increment can be measured very accurately.
There is not a remarkable difference in the errors analyzed by the Sampling moiré method and the OPPA method.
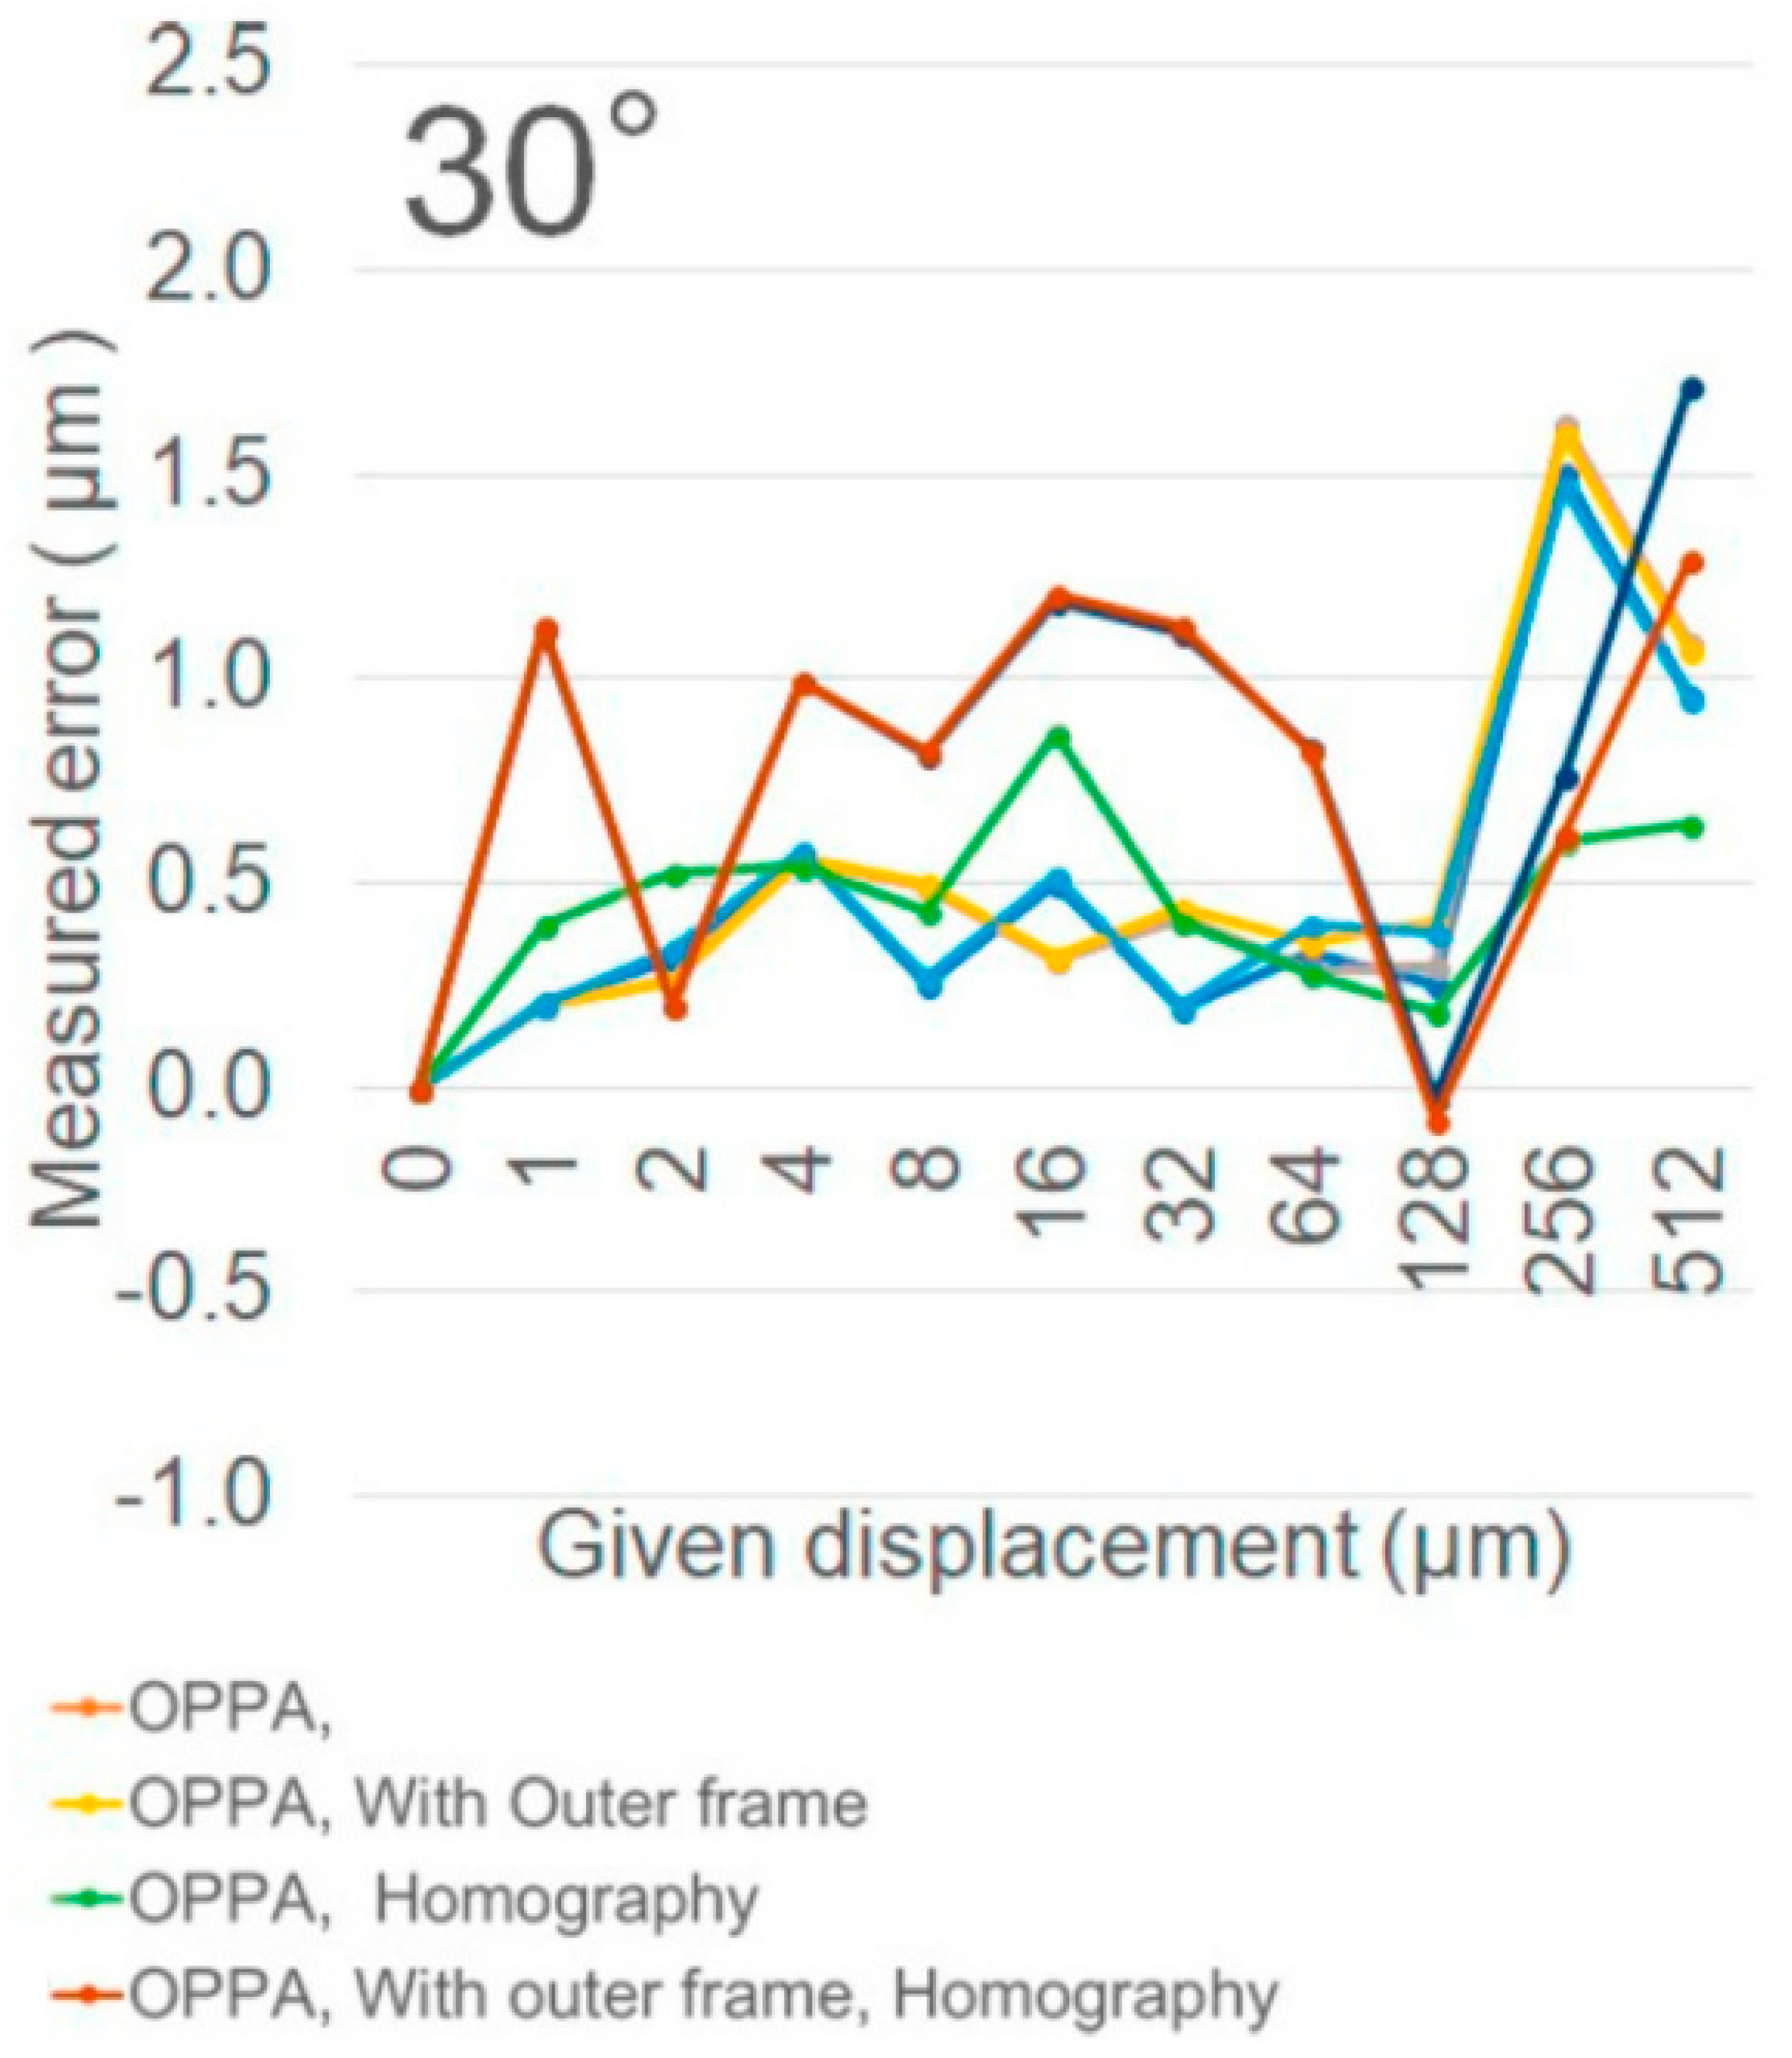
5.2. Measurement Error When Photographing from Oblique Direction
Figure 7 shows the displacement errors when the camera optical axis from the axis perpendicular to the grating plane is changed to be 30 degrees. From this, the errors are almost same as
Figure 6. The displacement can be measured with extremely high accuracy even when it is photographed from an oblique angle.
5.3. Measurement Errors in the Cases with and without Homography Transformation
In the case of the experiments in
Figure 6 and
Figure 7, phase analysis is also performed with and without the homography transformation. The results also contain the same order errors with good accuracy.
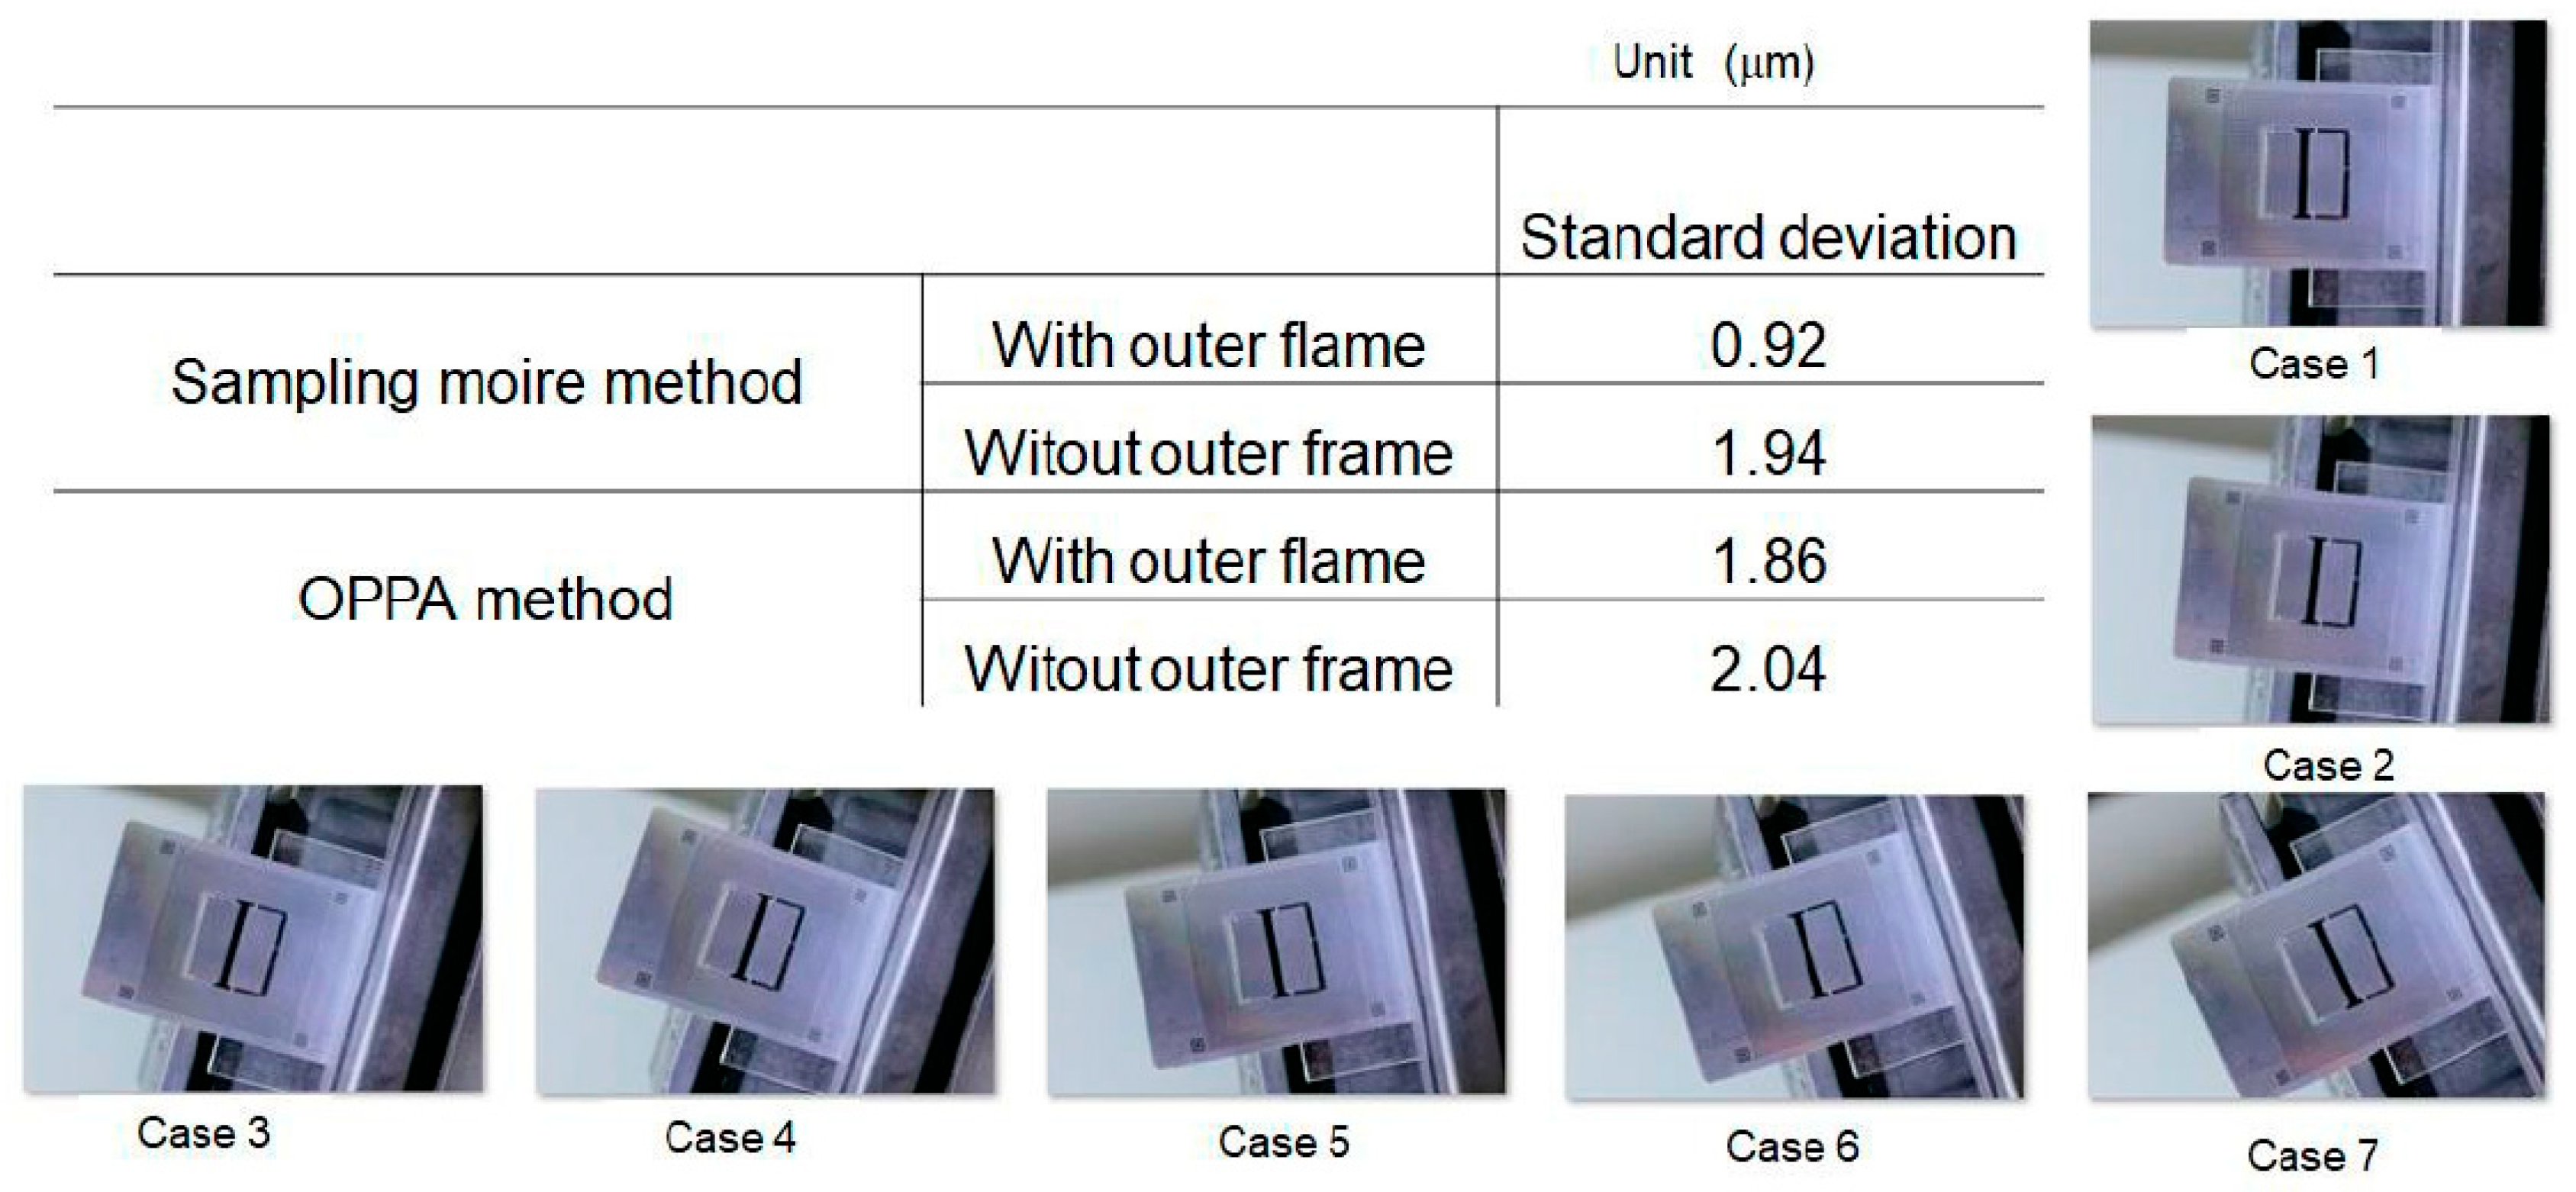
5.4. Repeatability
Experiments in
Section 5.1 were repeated 100 times. The standard deviations of the respective errors are examined for the cases with and without the outer grating frame, and the cases with and without homography transformation. The standard deviations of all the errors in each case are shown in
Table 1. Each standard deviation of the accuracy in the four case is very small, and the accuracy is approximately 0.2 μm.
5.5. Accuracy When Rotating Camera
When the camera is rotated around the axis perpendicular to the grating plane, the accuracy is examined. The photos are shown in
Figure 8. The displacement differences between the data in Case 1 and the other cases are analyzed. As shown in
Figure 8, when the camera rotates, it becomes slightly larger with an error of −2 μm.
6. Conclusions
The proposed methods using the sampling moiré method and the OPPA method are useful in measuring the increment of crack width. The accuracy is almost 1 μm. When conditions are good, crack width increments can be measured with a resolution of 0.1 μm. The proposed methods are very robust. In this study, the data number is not so large, and a few conditions are examined. In the near future, many experiments under various conditions will be examined
Up to now, bridges have not been periodically inspected. Recently, bridges in Japan are inspected once every five years. However, after a crack has occurred, it is dangerous to wait five years for another inspection. It is necessary to inspect as frequently as possible and constantly monitor whether the crack is increasing. By using the proposed method, it is possible to detect the increment by inspecting every other day so that an early warning can be issued.


