1. Introduction
Fatigue crack growth leads to failure of metal structures subjected to cyclic loading. With respect to prediction of remaining lifetime, monitoring and accurate characterization of fatigue cracks, amongst others, is of vital importance. Fatigue crack propagation is a complex phenomenon which involves many aspects that are not all translated into highly predictive models. Complexities arise due to various causes such as multiaxial loading, load interaction and environmental effects, and so on.
Fatigue crack propagation is essentially described by means of fracture mechanics principles. The trajectory of a fatigue crack tip can be numerically described by means of stress intensity factor evolutions in three different modes (tension, in-plane shear, out-of-plane shear). The rate of fatigue crack growth can be calculated based on crack growth resistance curves, such as the well-known Paris-Erdogan law. Meanwhile, several crack detection and measurement techniques have been developed to allow the experimental study of fatigue crack growth. These techniques widely utilize the physical performance of the specimen under load. For example, back face strain gauge or clip-on gauges correlate the compliance of a specimen to crack length. Direct current potential drop (DCPD) and alternating current potential drop (ACPD) measure variations in electrical potential due to fatigue damage during fatigue crack propagation. Infrared thermography, ultrasonic inspection and acoustic emission make use of temperature, reflecting high frequency sound waves and acoustic emission signals respectively to detect fatigue crack extension or damage. Their signals are quite sensitive and easily polluted by environmental factors. Optical methods, such as the digital image correlation (DIC) [
1,
2] technique, attract interest because of their contactless mode of operation and high accuracy.
In this paper, DIC is used to identify the crack trajectory (and, particularly, the crack tip) in a modified CT specimen and numerical simulations are carried out based on the extended finite element analysis. Experimental and numerical fatigue crack propagation trajectories are compared, showing an overall good correspondence.
2. Numerical Tools
2.1. Fatigue Crack Identification via DIC
In this paper, digital image correlation (DIC) is used to identify the fatigue crack trajectory during a cyclic load test on a modified compact tension specimen. By comparing small square subsets in images of reference and deformed surfaces of the specimen, DIC measures full-field displacement and strain. The DIC assisted algorithm for crack tip detection is based on maximizing the cross-correlation between two images in the spatial domain. It is conveniently computed in Fourier space, and a polynomial fit of the cross-correlation function allows one to locate its maximum with sub-pixel resolution. Minimization of the quadratic difference between images is equivalent to maximizing the cross-correlation. The advantage of doing this is that a global search for the maximum is easy to perform so it is quite tolerant to large displacements.
The Sobel edge detection algorithm [
3,
4,
5,
6] has been used to localize the crack edges and its tip by looking for maximum and minimum values of the first derivative of the greyscale intensity patterns in the DIC images. When the intensity gradient corresponding to a certain pixel location exceeds a predefined value, which is defined as leap threshold in this paper, this pixel location is considered as a crack edge.
2.2. Fatigue Crack Propagation Simulation
In terms of fatigue crack propagation simulation, a framework [
7] based on extended finite element (XFEM) analysis was used in this paper to calculate the fatigue crack trajectory under multi-axial loading. The framework establishes the simulation by discretizing stress intensity factors along the entire fatigue crack front to determine how it propagates in length and in orientation, and then updating the crack front for a renewed analysis. Such iterative process can be achieved through a devoted coupling between model pre-processing, simulation and post-processing modules (making use of Python scripting and ABAQUS finite element analysis software), until unstable fracture failure or crack arrest is reached.
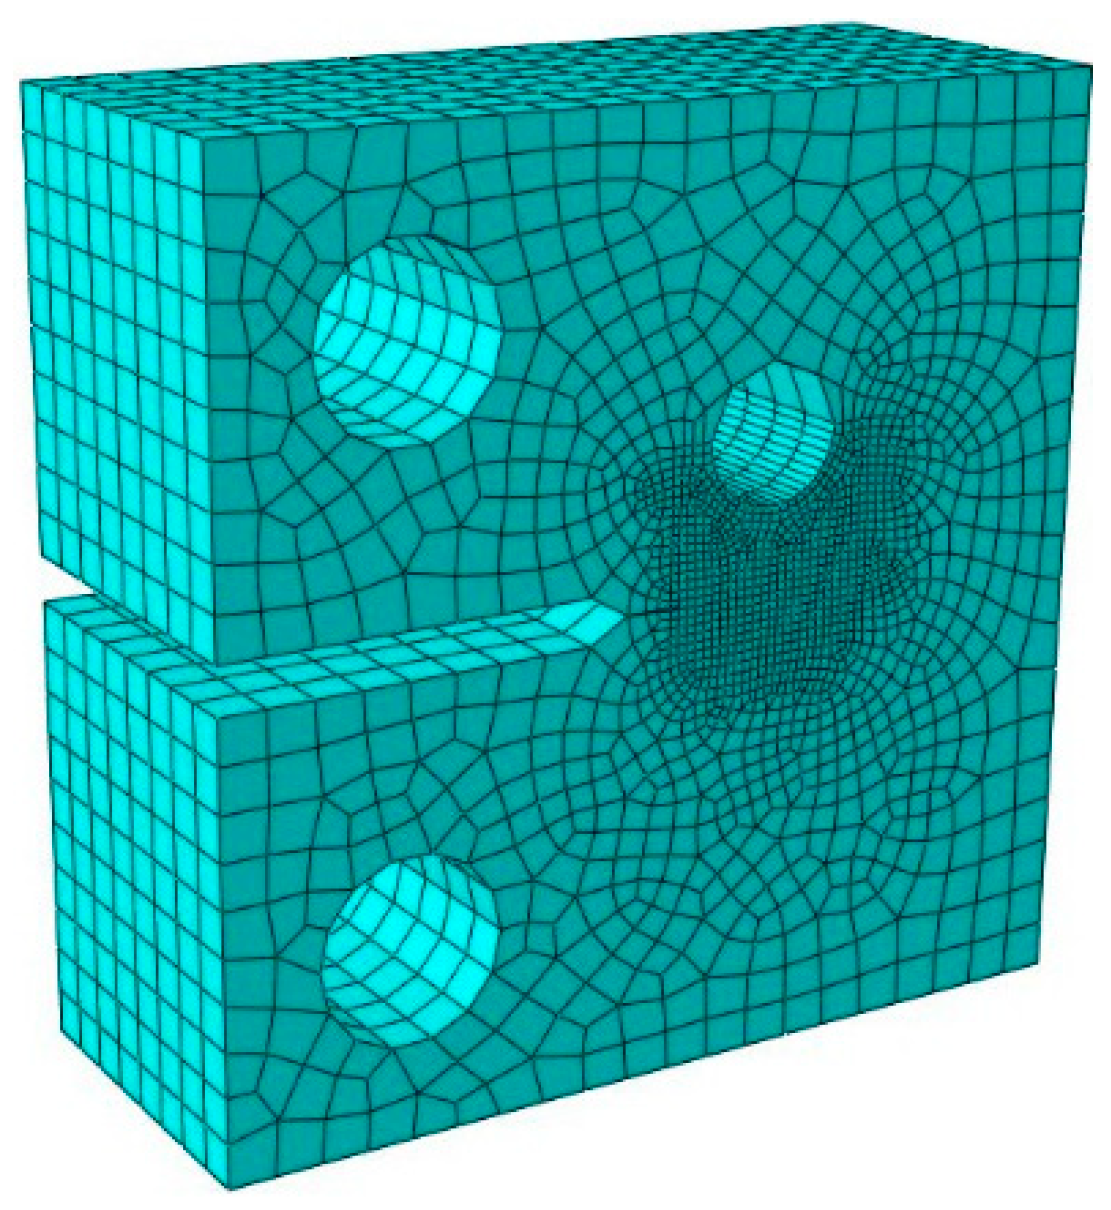
Simulations were carried out in the same configuration on modified CT specimens. The mesh strategy is shown in
Figure 1, which an 8-node linear brick element is used with reduced integration and hourglass control. Approximate global seeding size was 2 mm, moreover, the volume between the notch and the additional hole was refined to 0.4 mm. Total number of element was 11,584.
3. Experimental Details
3.1. Material and Specimen Configuration
A high strength low alloy steel DNV F460 whose mechanical properties are listed in
Table 1, has been chosen for the experimental validation study. C and m are parameters of the Paris-Erdogan fatigue crack growth law and
is a material constant of Walker’s propagation law [
8];
is the threshold stress intensity factor range.
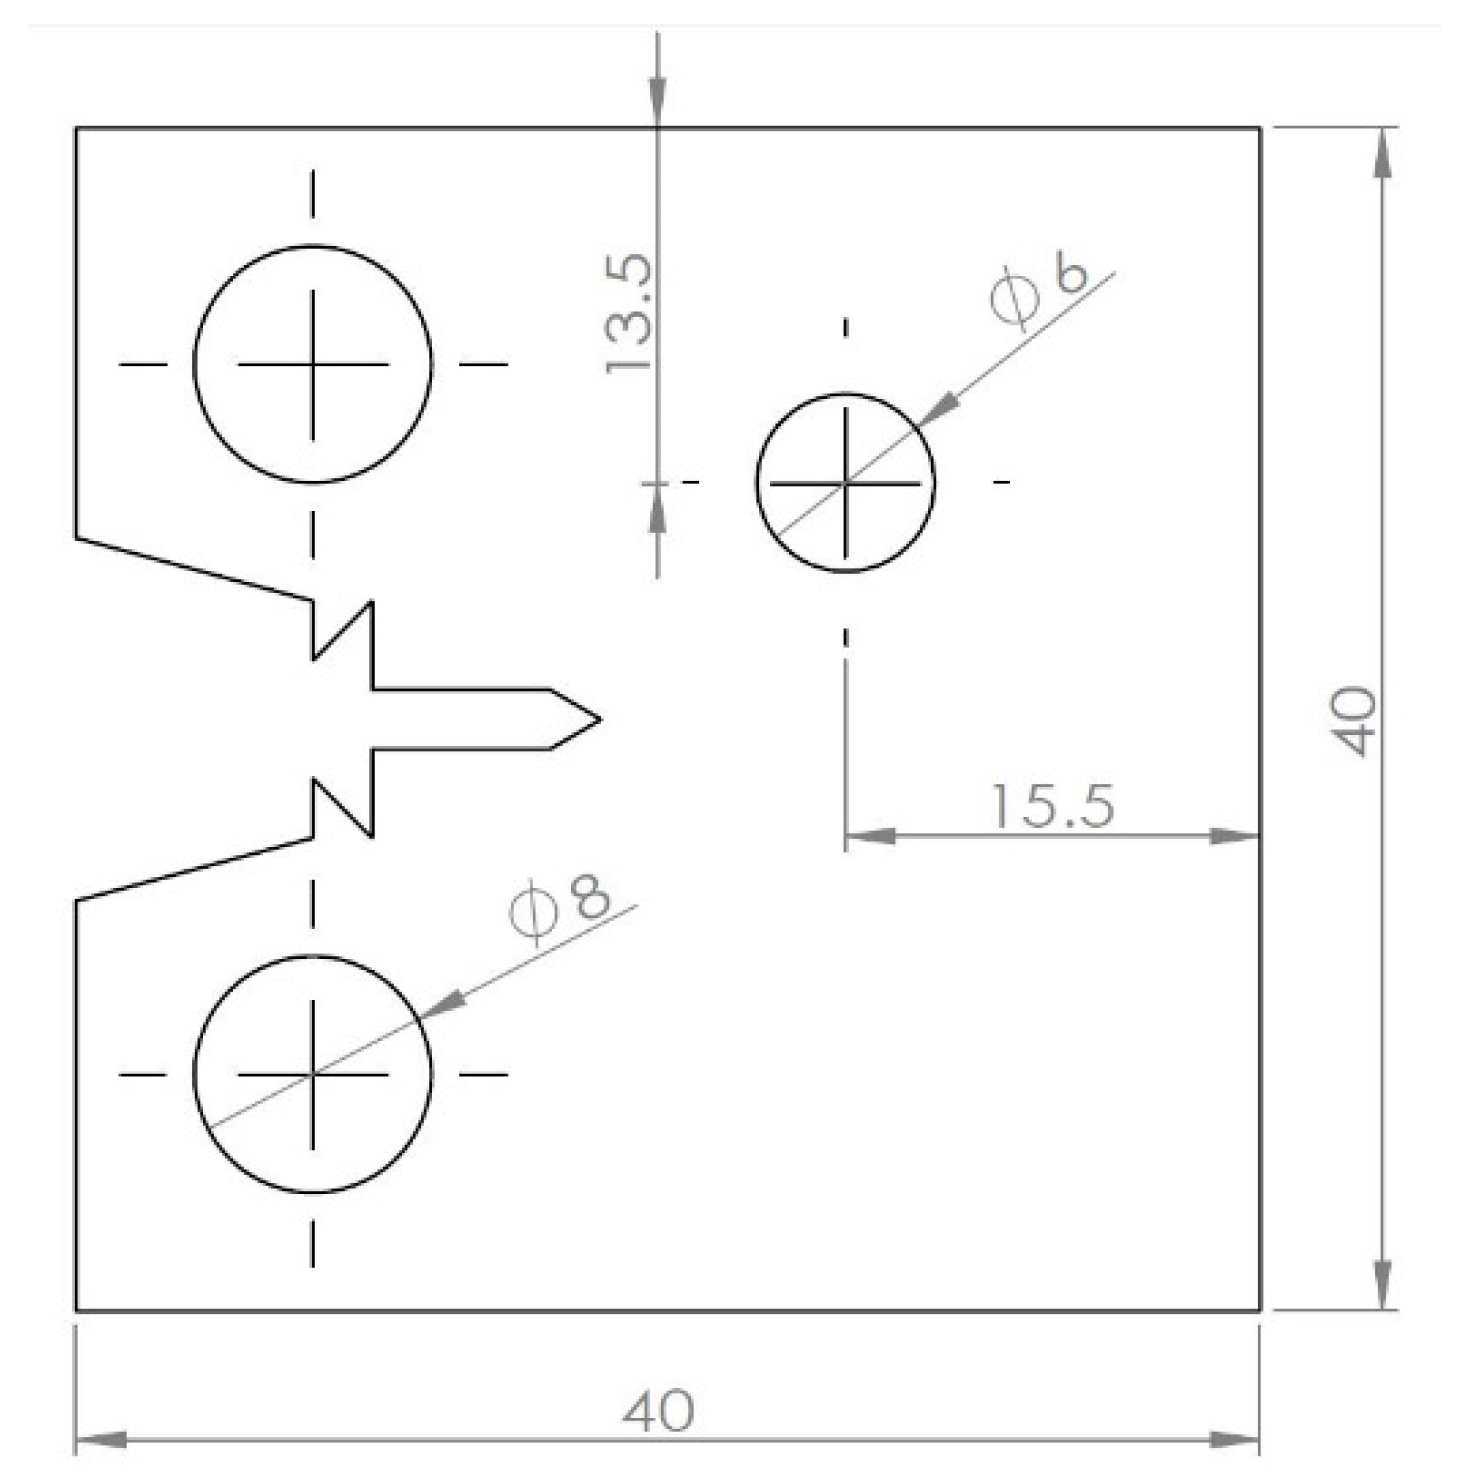
The specimens have been designed in the form of standardized compact tension specimens with an additional hole, as illustrated in
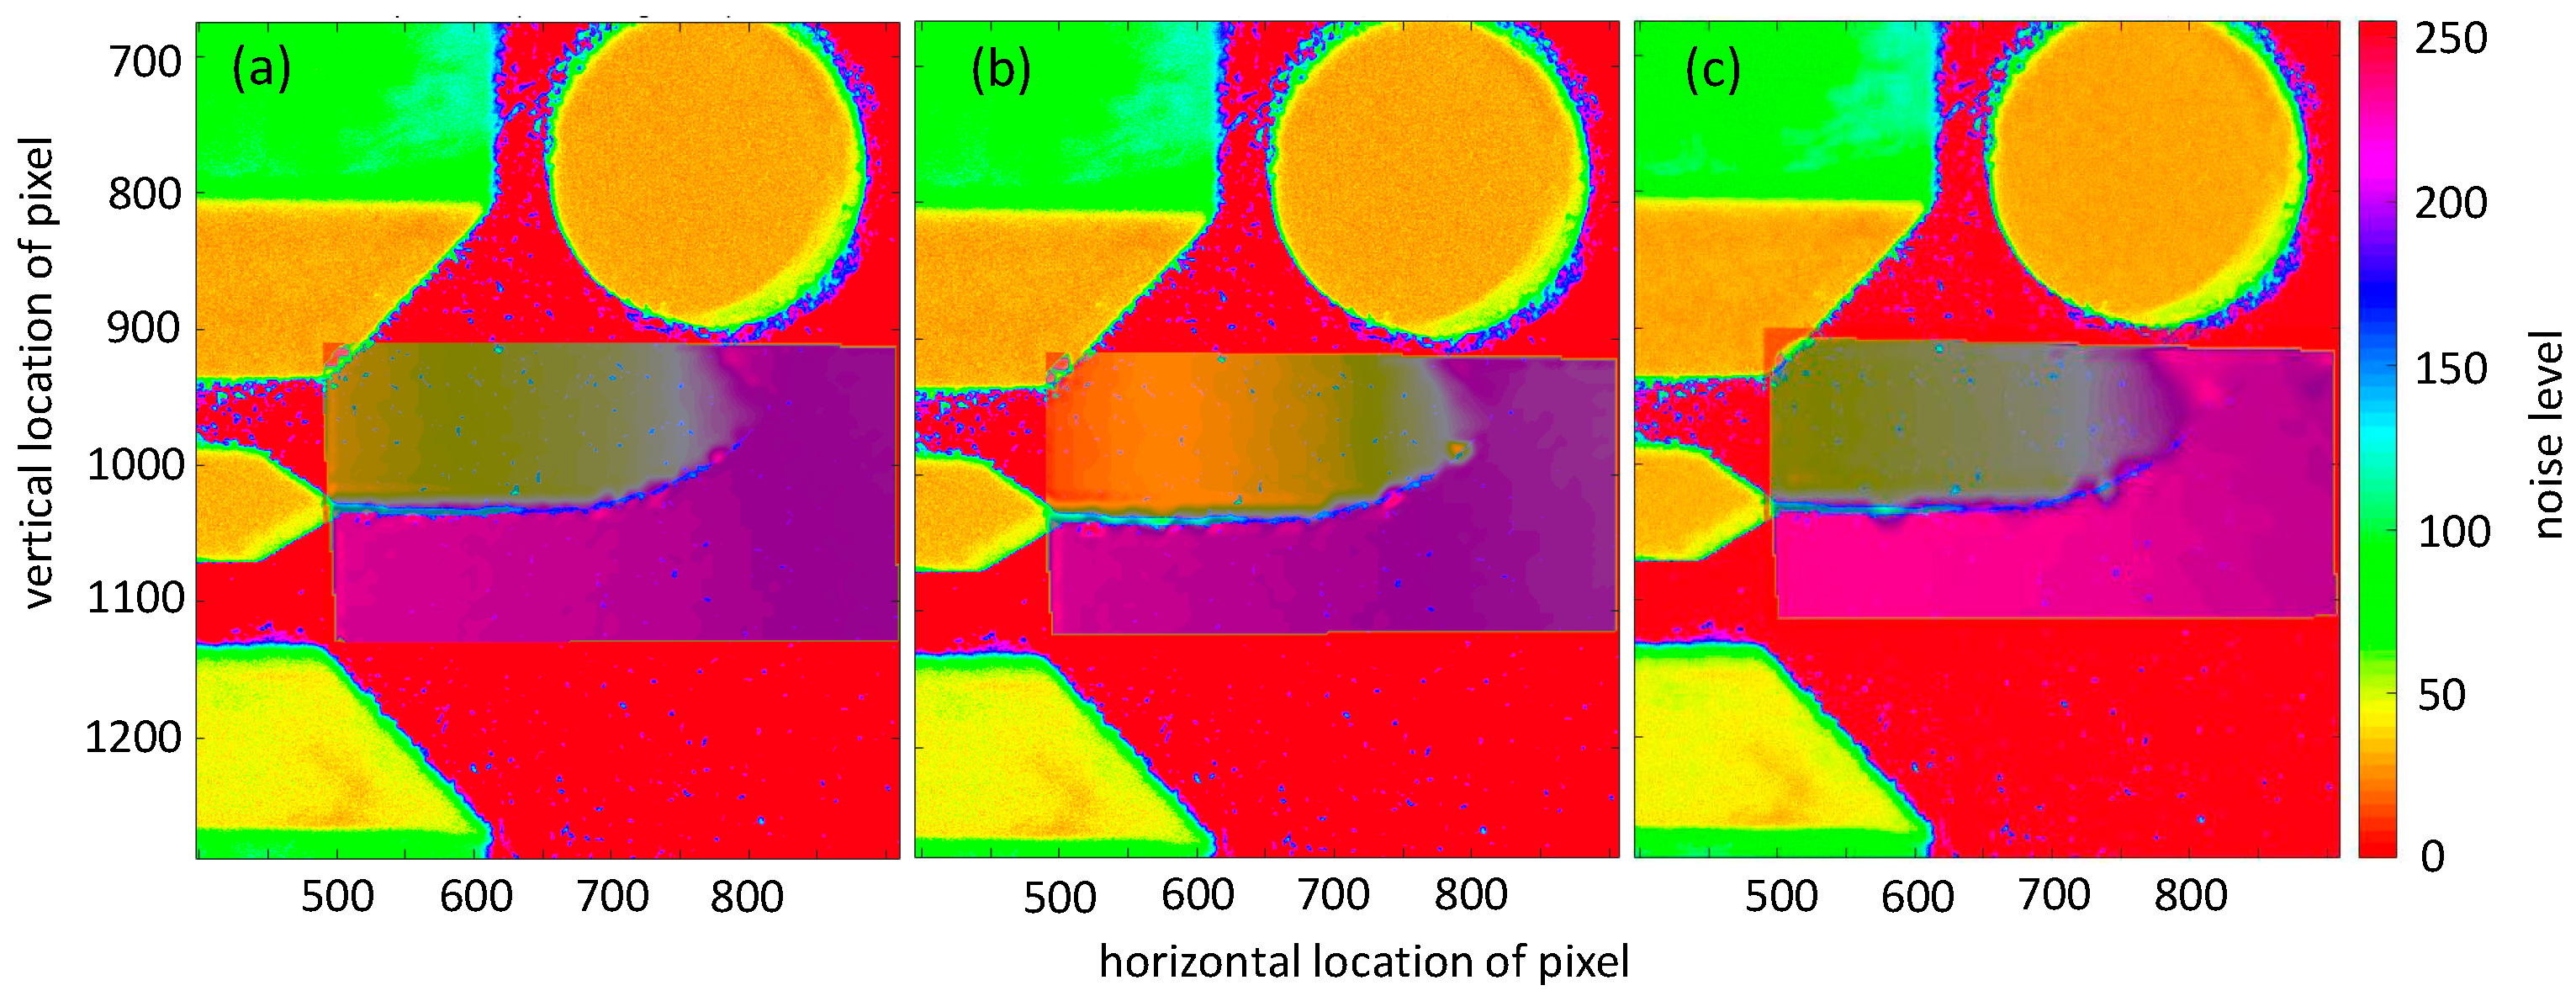
Figure 2. The stress and strain fields in front of the notch are asymmetrically distributed due to the presence of the additional hole. During fatigue propagation, the crack path will deviate towards this hole. On the surface of specimens, black speckle patterns were sprayed on a white background layer. In practice, speckle pattern should be of high contrast, contains random speckles, consistent dot sizes, and equal amounts of black and white on the sample’s surface. Areas of interest will produce low levels of noise and may be tracked with high levels of certainty if those conditions are met.
3.2. Experimental Procedure
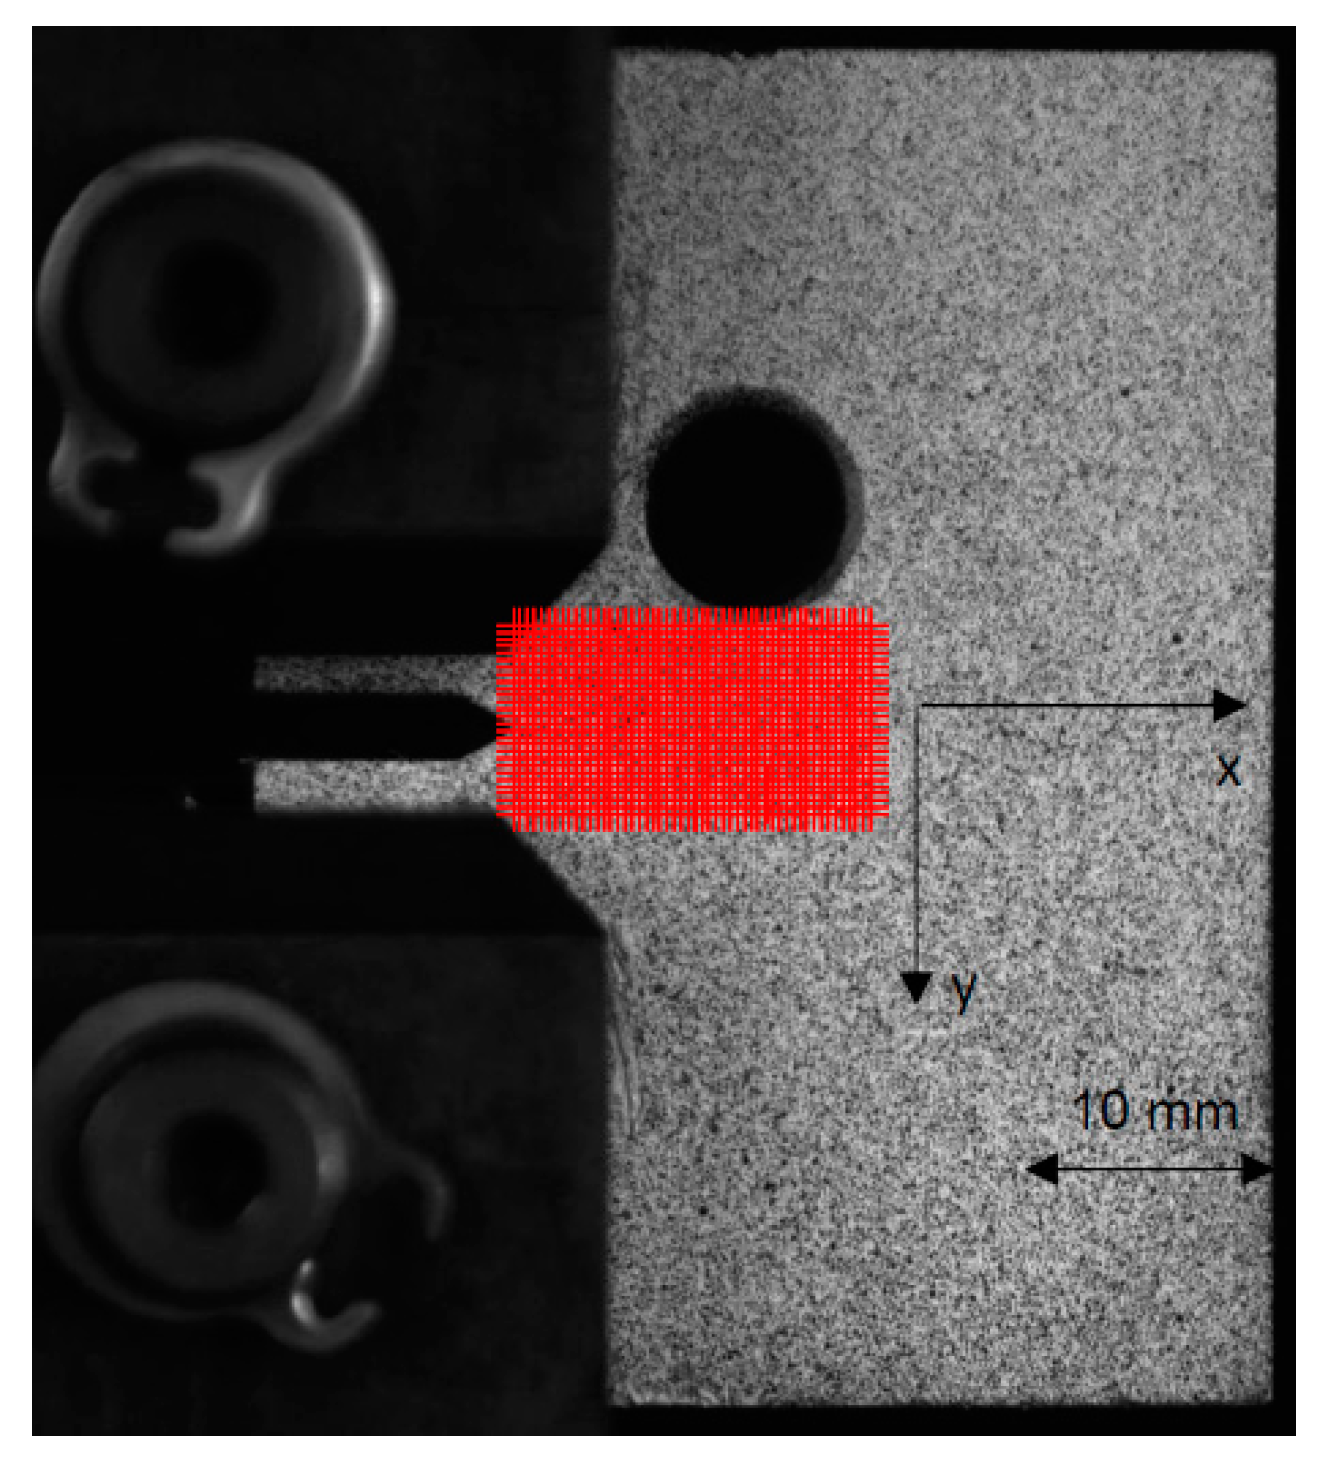
Before actual testing started, the specimen had been fatigue pre-cracked to make sure that a sharp crack tip is created according to ASTM E647 [
9]. Following pre-cracking, a servo-hydraulic ESH 150 kN universal testing machine was used to perform cyclic sinusoidal loading with a maximum value of 13.8 kN and minimum value of 5.2 kN at a frequency of 10 Hz. To perform DIC measurements, a camera system was used, consisting of a synchronized monochromatic 14 bits camera having a resolution of 5 mega-pixels. Diffuse lighting was provided by two external white light sources.
To obtain accurate results, following attention points were important. Images were always taken at maximal crack opening and lighting conditions were kept constant during testing. The high quality (density; size; contrast) of the speckle pattern and camera focus promoted the high accuracy of DIC calculations.
160 images taken during the test were selected that reveal the entire process of crack propagation. An area in front of the notch with a height of 200 pixels and width of 250 pixels was selected to generate DIC analysis grids, as illustrated in
Figure 3.
4. Results and Discussions
4.1. DIC Results
The vertical displacements were calculated for three different grid resolutions (grids containing 1442 points, 882 points and 392 points respectively). This is illustrated for image no. 158 in
Figure 4. Obviously, the higher the number of grid points chosen, the more accurately the crack is plotted. On the other hand, the disadvantage of higher grid resolution is that computational time is longer as well.
4.2. Compison of Fatigue Crack Trajectory
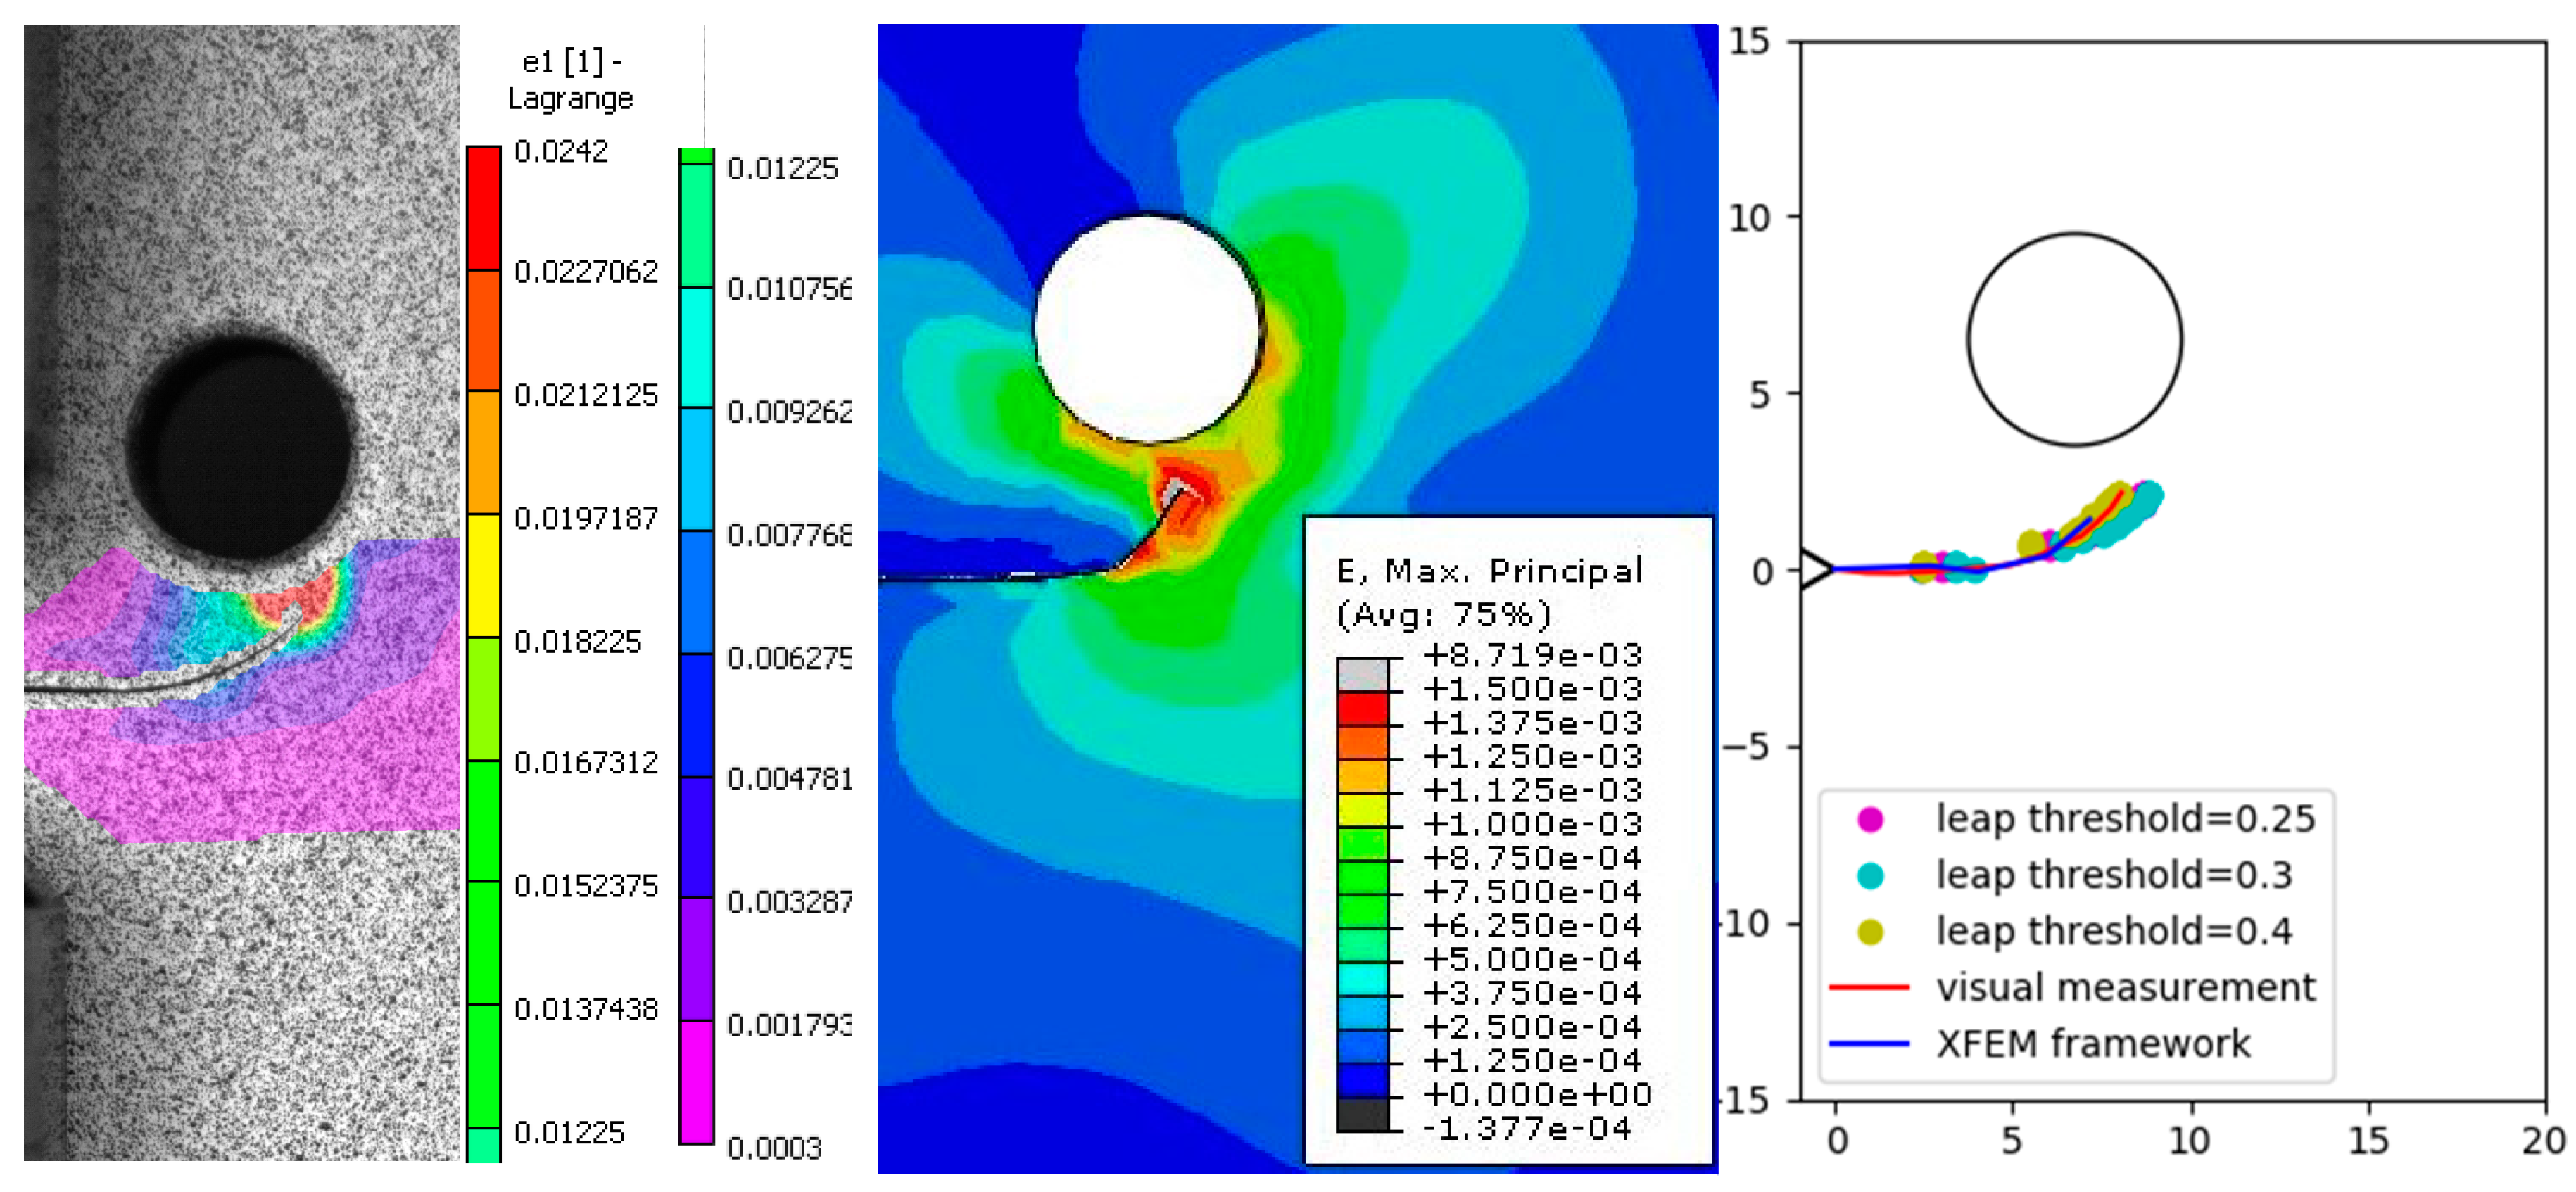
Contours of maximum principal strain obtained via DIC and XFEM simulation are illustrated in Figure (left + center image). The numerically predicted results show similar contours around the crack and a similar crack propagation trajectory as compared to the experimentally measured data (right image). As introduced above, the crack trajectory was traced by subsequent crack tip detection applying the Sobel algorithm to DIC images during fatigue crack propagation. Different leap threshold values have been used to evaluate the accuracy of the Sobel edge detection algorithm. Figure illustrates that the accuracy is not significantly influenced by leap threshold values in the range of 0.25 to 0.4.
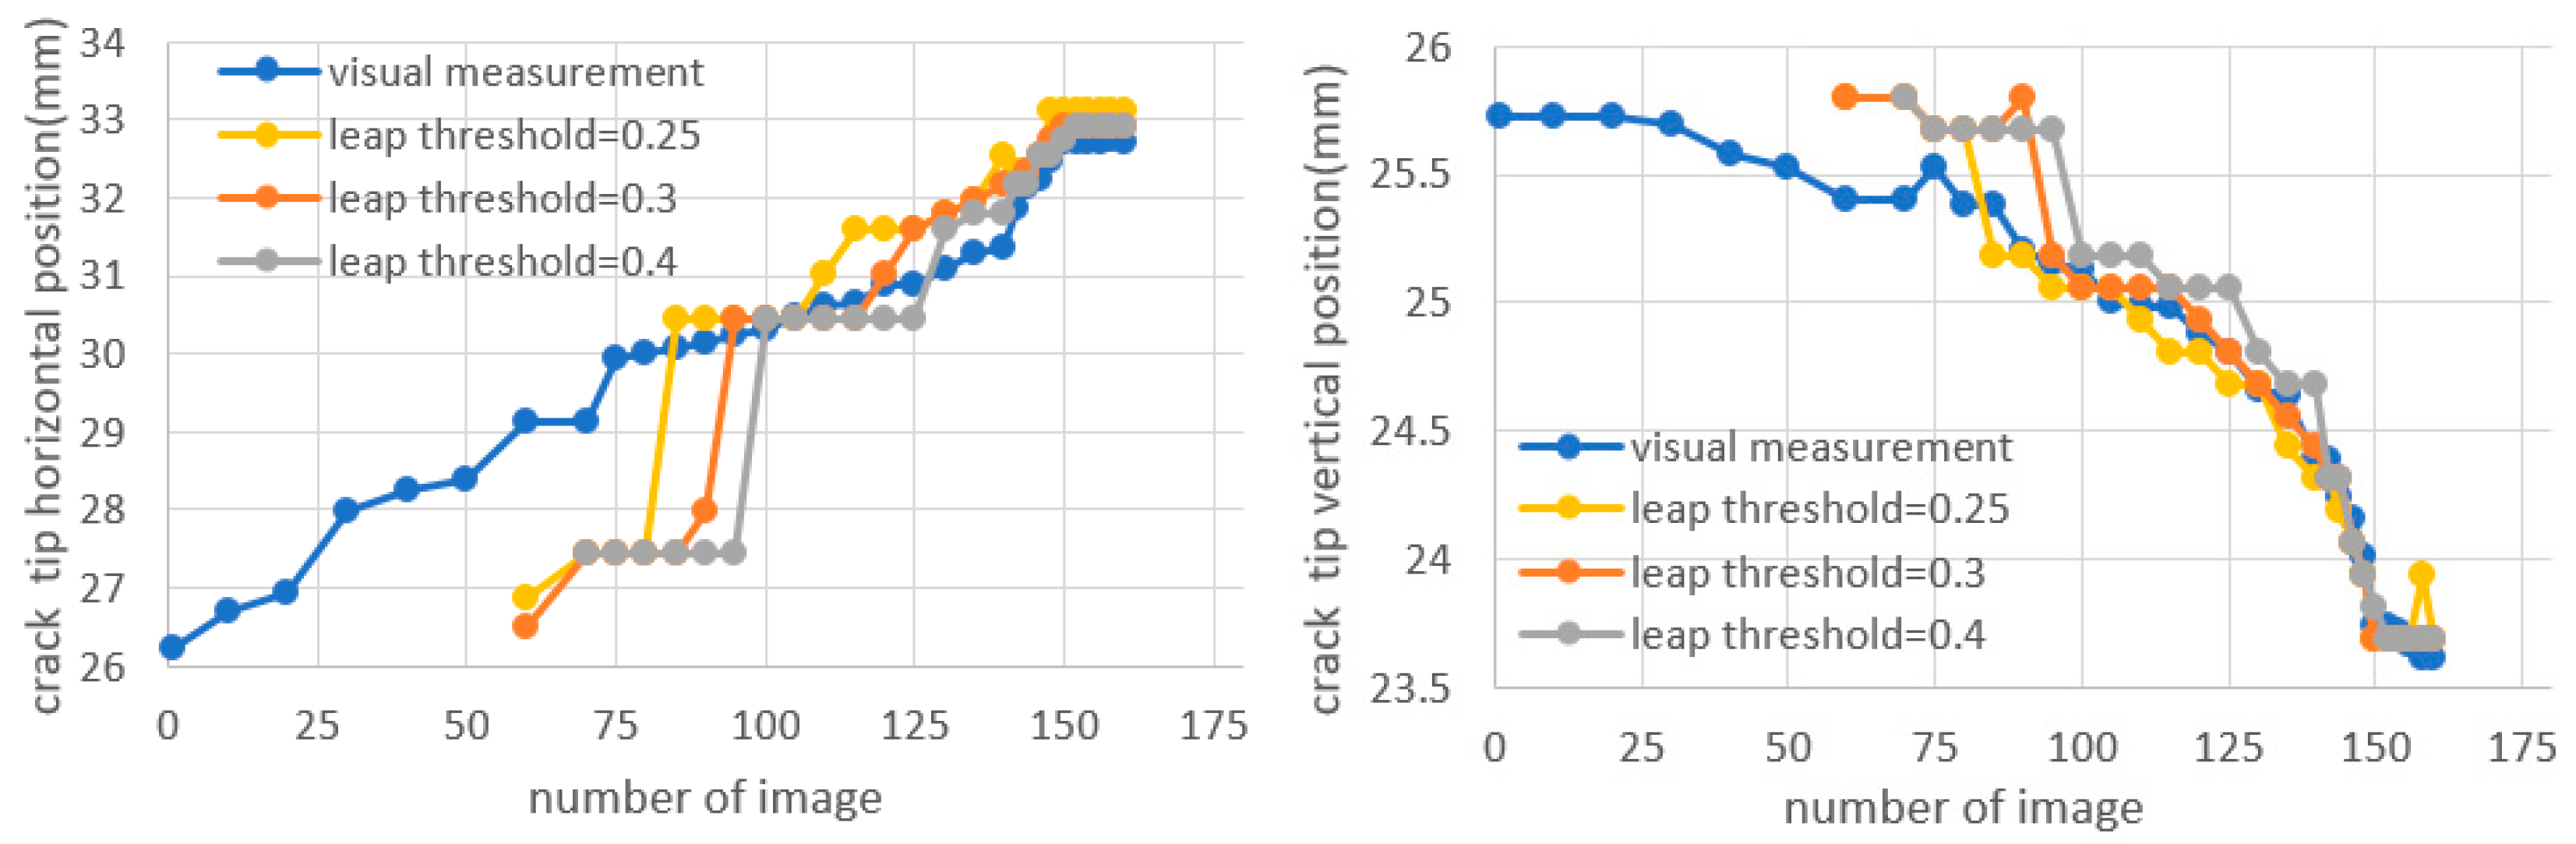
Figure 5 subdivides the measured crack tip positions in terms of their horizontal and vertical positions in
Figure 6; this figure essentially confirms the above.
5. Conclusions
In this paper, an approach based on DIC and edge detection algorithms was implemented for the identification of the fatigue crack trajectory. A modified CT specimen was used to impose crack path deviation due to the presence of an additional hole. The following analysis evaluated robustness and accuracy of the DIC based Sobel algorithm for detection of an irregular crack propagation path. The DIC method produced similar crack trajectories compared with visually measured values. A sensitivity analysis showed that the leap threshold value of greyscale intensity gradient did not significantly influence the accuracy over a broad range. Equivalent strain at the crack tip calculated by DIC method agreed well with results predicted by an XFEM based framework. The developed tools can be utilized for further studies involving irregular fatigue crack growth in optically accessible specimens.


