Proceeding Paper

Quasi-Static and Dynamic Testing of Annealed Float Glass †

by
Karoline Osnes
1,2,*,
Odd Sture Hopperstad
1,2 and
Tore Børvik
1,2
1
Structural Impact Laboratory (SIMLab), Department of Structural Engineering, Faculty of Engineering, Norwegian University of Science and Technology (NTNU), NO-7491 Trondheim, Norway
2
Centre for Advanced Structural Analysis (CASA), NTNU, NO-7491 Trondheim, Norway
*
Author to whom correspondence should be addressed.
Presented at the 18th International Conference on Experimental Mechanics (ICEM18), Brussels, Belgium, 1–5 July 2018.
Proceedings 2018, 2(8), 495; https://doi.org/10.3390/ICEM18-05412
Published: 29 June 2018
(This article belongs to the Proceedings of The 18th International Conference on Experimental Mechanics)

Abstract

:
Three different experimental set-ups were employed in the investigation of the fracture strength of annealed float glass. These included four-point bending tests on three different specimen sizes, and quasi-static and dynamic pressure tests. The latter tests were conducted in a shock tube, i.e., a device that produces pressure loadings similar to that from a far-field blast event. The experimental work demonstrated that the fracture strength of glass varies largely within the same test set-up. It also revealed that the fracture strength and its scatter are dependent on the size of the specimen, the boundary conditions and the loading situation. By employing a newly proposed strength prediction model, which relies on the physical fracture behaviour of glass, the trends observed in the experiments were correctly recreated.

1. Introduction

In recent years, there has been a large increase in the use of glazed areas in buildings. This includes glass in large panels, roofs and beams, in addition to entire facades. As a result, the glass is required to act as a structural component that needs to carry considerable loads. Additionally, due to the terrorist threats in today’s society, glass structures must often be designed to withstand extreme loadings such as blast pressures from explosions. In the event of such an attack, the most frequent injuries are due to accelerated fragments of failed glass components [1]. This increases the complexity of the design process, and calls for a better understanding of glass’ load-carrying capacity. It further requests the development of numerical tools and models capable of predicting fracture and crack propagation in glass.
It is widely known that the fracture strength of glass is stochastic in nature [2], and is due to the presence of micro-structural surface flaws. These flaws cause glass plates to fail primarily in tension, with opening (mode I loading) and growth of the flaws [3]. The identification of the fracture strength of glass is not straightforward, and depends on the combination of the flaw properties and the applied stress. Consequently, the glass strength is dependent on the geometry of the structural component, the boundary condition and the loading situation. The fracture initiation may also not necessarily occur at the point of maximum stress. The complexity of the design process is increased when including effects of strain rate, as present in rapid loading scenarios. This is because flaws need time to grow [4], but this effect is challenging to quantify. There is naturally a great need for numerical methods capable of predicting the fracture behaviour of glass. However, it is also necessary to perform experiments for use in validation of such models. Additionally, needless to say, these experiments need to be done in a precise manner with the use of accurate measuring techniques.
In this work, three different experimental set-ups are used to investigate the fracture strength of annealed float glass depending on specimen geometry, boundary condition and loading situation. This includes quasi-static four-point bending tests on three different test specimens of a relatively small size, and uniform quasi-static and dynamic pressure tests on larger glass plates. The dynamic pressure tests involve subjecting the glass plates to a blast pressure by use of the SIMLab Shock Tube Facility [5], while the quasi-static pressure tests employ a slowly increasing water pressure.
The results from the experiments will be used to validate a strength prediction model of glass [6], which is based on the work by Yankelevsky [7]. This stochastic model aims at predicting the glass strength without the need for material tests.

2. Material and Methods

2.1. Glass Material

All specimens used for the experimental work in this study are made up by clear annealed soda-lime silica glass. Glass is generally a brittle material and behaves linear-elastically to the point of fracture. Furthermore, fracture in glass is a highly stochastic process, to which microscopic surface flaws are responsible. When these flaws are subjected to tensile stresses, they will open and, if the stresses are of a critical value, grow into larger cracks in an unstable manner. This will normally lead to glass failure, as the chance of crack arrest for glass is relatively small. The fracture strength (or the onset of unstable flaw growth) of glass can be determined by linear fracture mechanics, i.e.,
K I = K I C ,                 K I = Y σ π a
Here, K I is the stress intensity factor for mode I loading (opening of a crack), K I C is the fracture toughness, σ is the remote stress normal to the flaw, Y is a geometric factor, and a is the flaw depth. Y is further dependent on the flaw shape a / c , where c is the length of the flaw [8].

2.2. Digital Image Correlation

In the tests on the larger glass plates, a three-dimensional point-tracking procedure was employed to obtain the deformation of the glass (and the velocity of free-flying glass fragments) during the tests. White circles with a central black dot (optical targets) were painted on the glass, while the in-house Digital Image Correlation (DIC) code eCorr [9] was used to track their displacements. The procedure has earlier been validated against laser measurements [6].

2.3. SIMLab Shock Tube Facility

The SIMLab Shock Tube Facility (SSTF) was employed to subject glass plates to a pressure loading close to that from a far-field explosion. This is done by a build-up air pressure, which is sent through the shock tube and eventually transforms into a blast wave. When the blast wave reaches the glass specimen, which is placed at the rear end of the shock tube, it is reflected. The reflected pressure represents the loading experienced by the tested specimen. For a more thorough description of the SSTF, and the general experimental set-up, we refer to Aune et al. [5].

3. Experiments

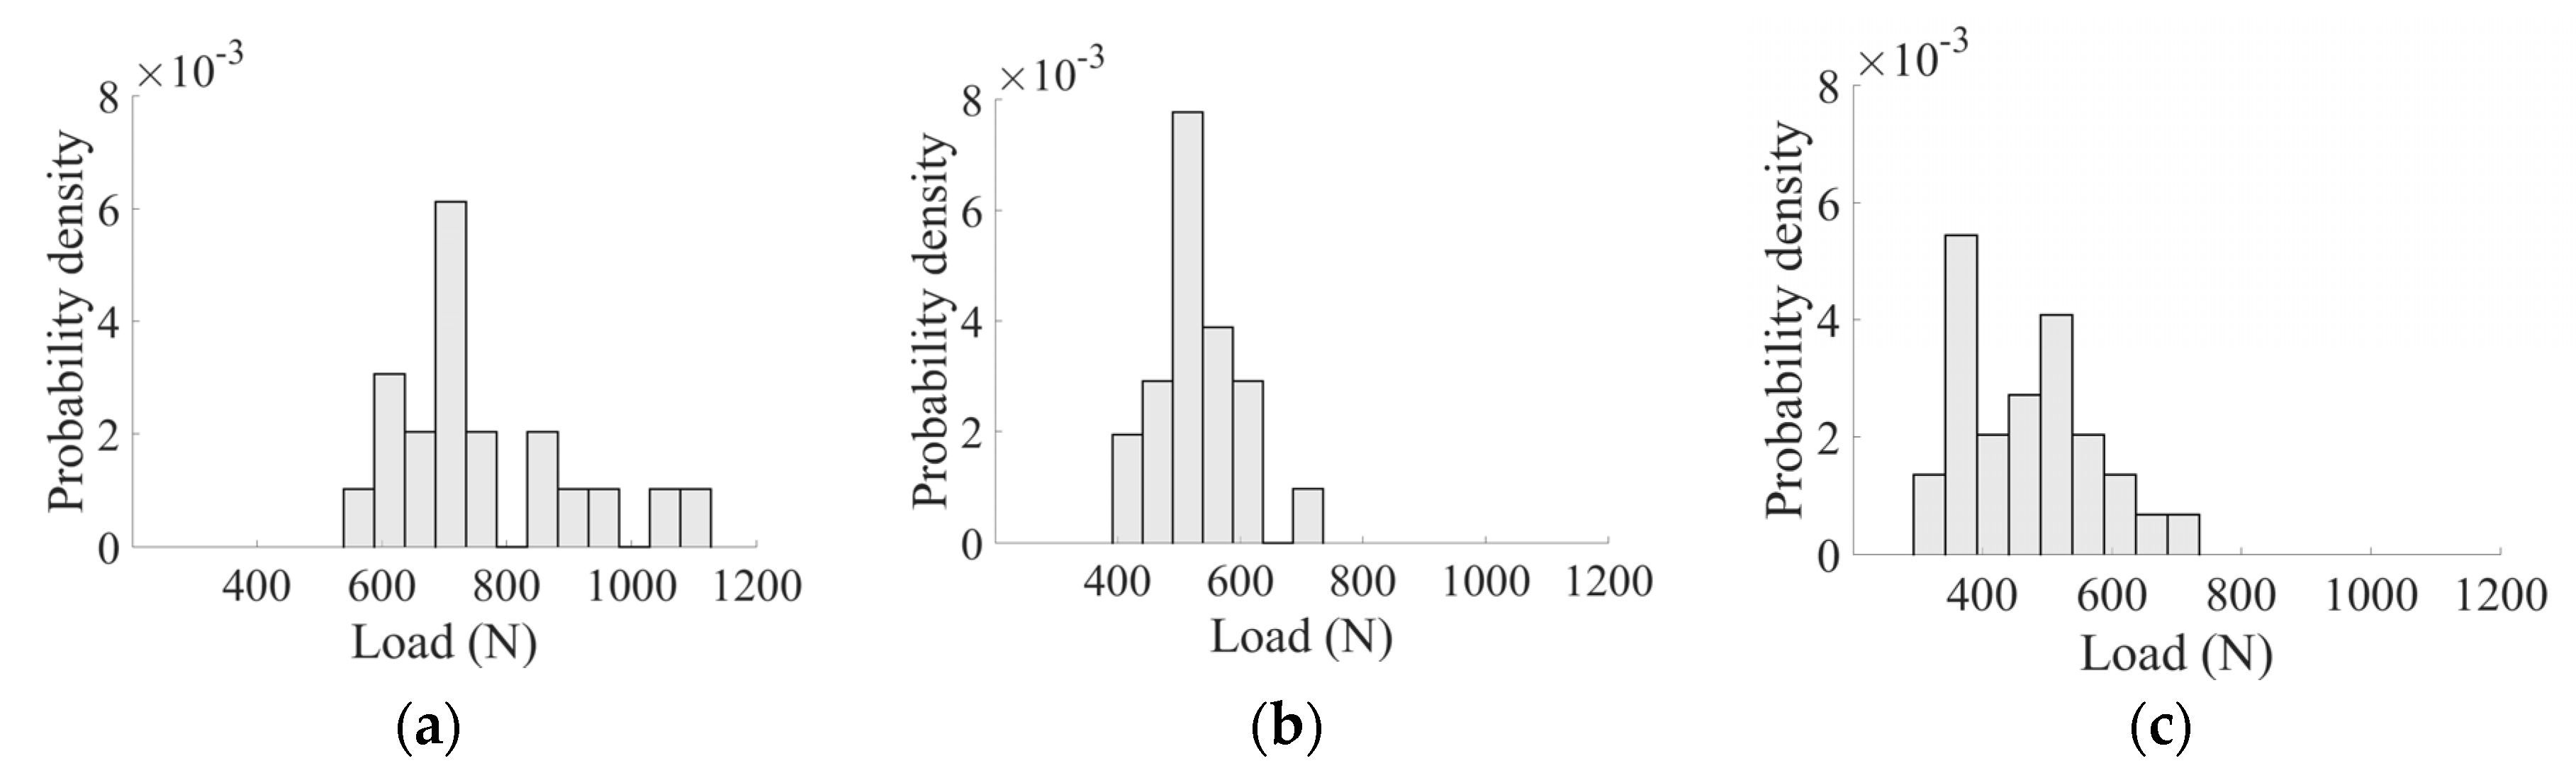
3.1. Four-Point Bending Tests

Quasi-static four-point bending tests of glass were performed on three different specimen sizes, denoted small (100 mm × 20 mm × 4 mm), medium (200 mm × 40 mm × 4 mm) and large (300 mm × 60 mm × 4 mm) specimens [6]. The support span was 20 mm shorter than the length of the specimens, while the loading span was half of the support span. High-strength steel cylinders with a diameter of 6 mm were used for support and loading application. Specimens failing at the edges were disregarded in this study, which led to a total of 20, 21, and 30 (out of 31) valid tests for the small, medium and large specimens, respectively. The applied load at failure is presented in Figure 1. Note that the ordinate, denoted the probability density, refers to a normalized occurrence. This is calculated by c i / ( N w i ) , where c i is the number of elements in the bin, N is the total number of elements and w i is the width of the bin.
The failure loads can be transformed to the maximum tensile stresses at failure by
σ f = 3 F f L s 4 w h 2
where F f is the failure load, L s is the support span, w is the width and h is the thickness of the specimen. This leads to the range σ f = [110.8; 207.2], [86.4; 144.7] and [67.7; 153.8] MPa for the small, medium and large specimens, respectively. This implies that an increased area leads to a decrease in fracture strength. As an increased surface area would normally contain more flaws, this is an expected result.

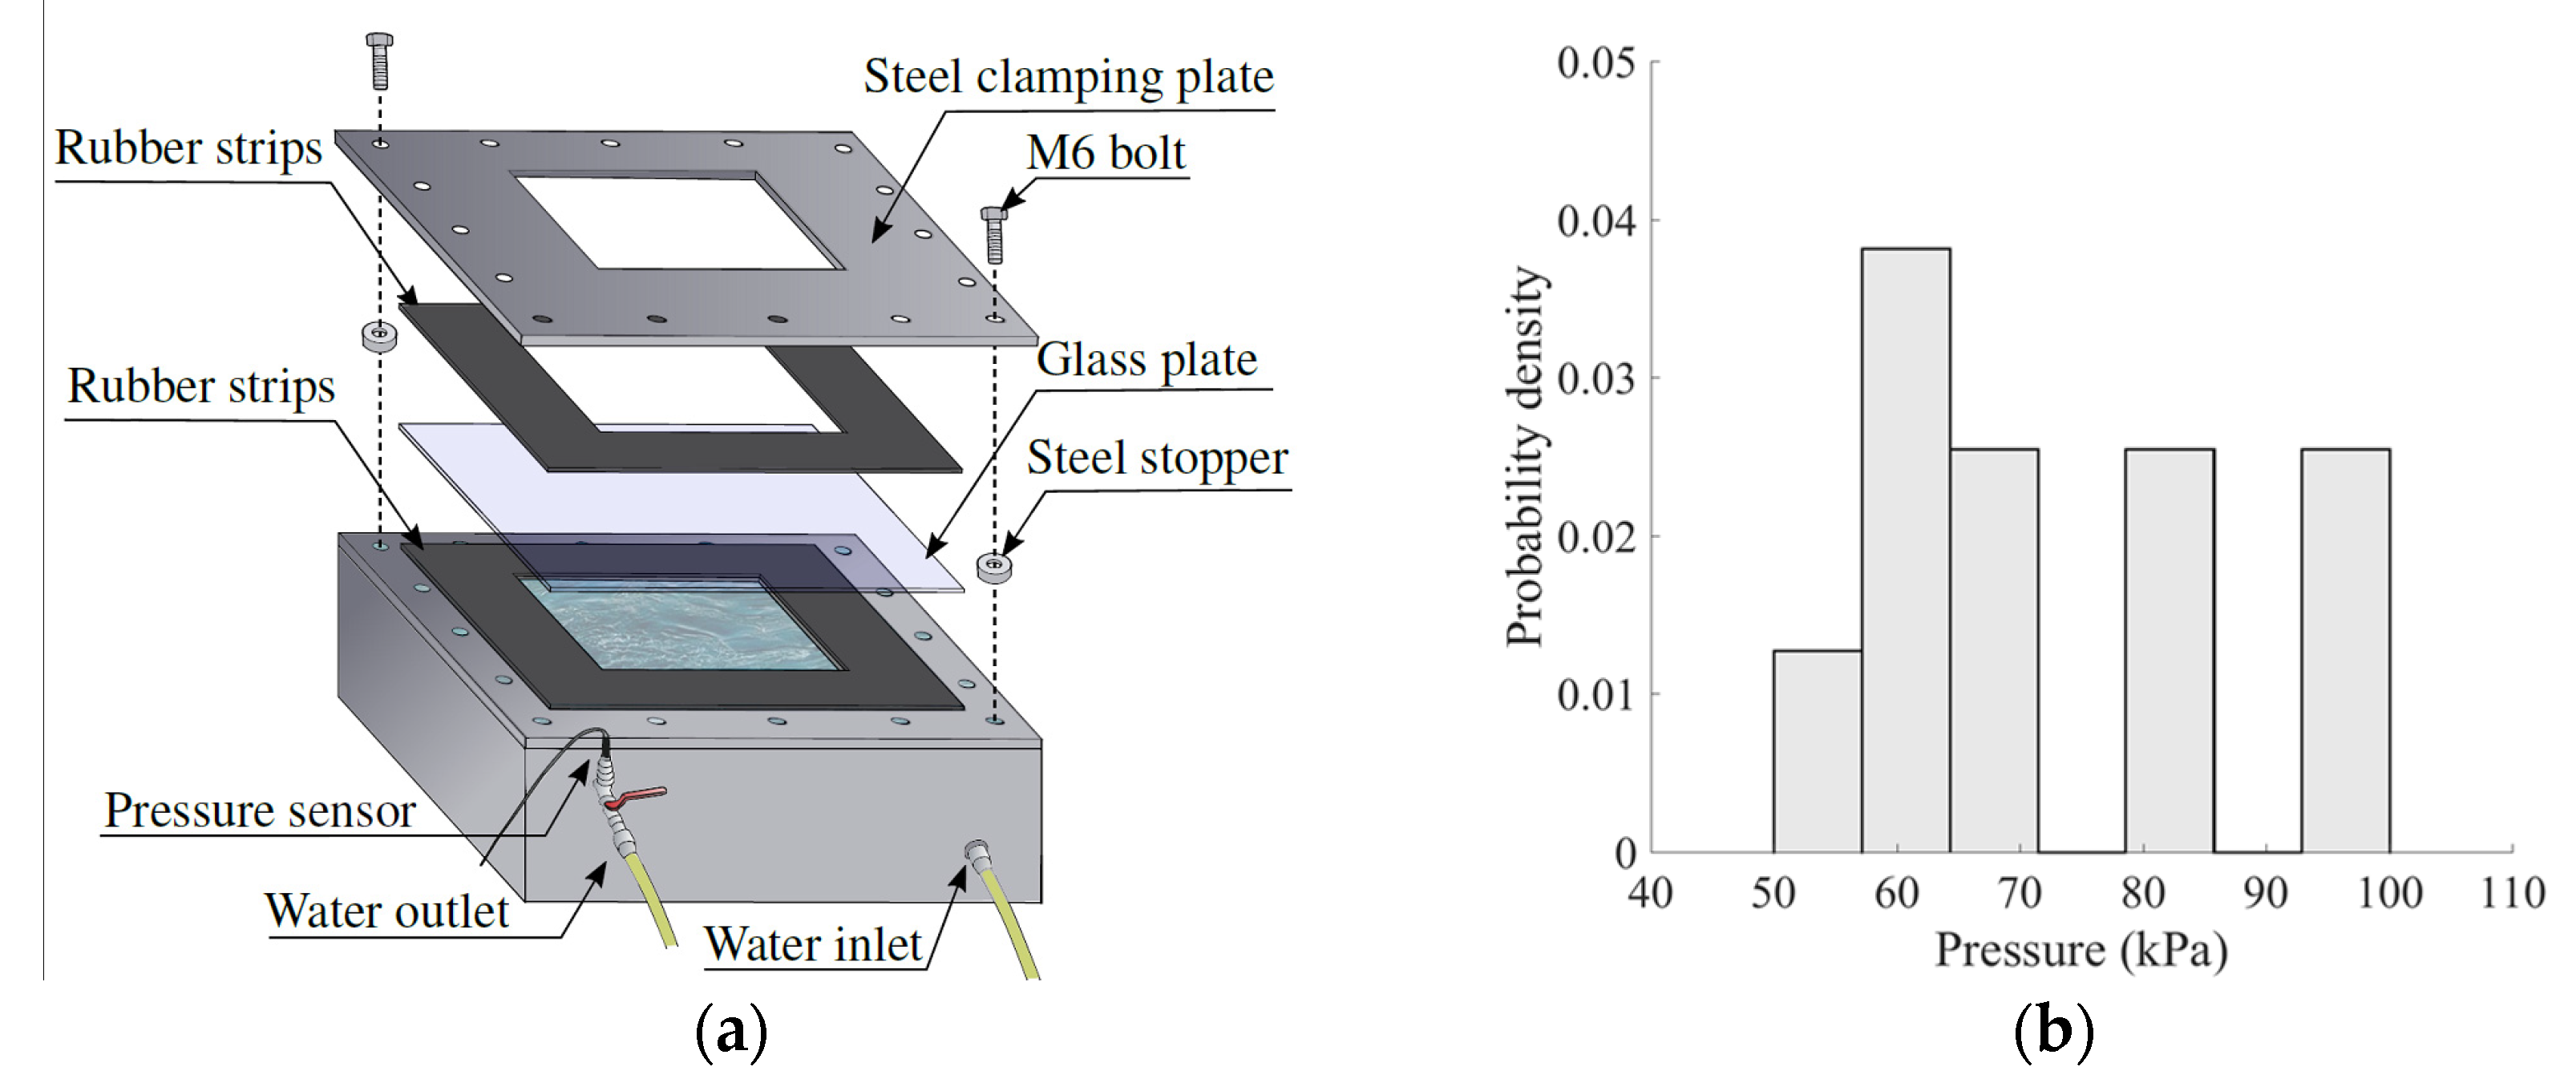
3.2. Quasi-Static Pressure Tests

Quasi-static pressure tests were performed on 11 glass plates with dimensions of 400 mm × 400 mm × 3.8 mm [6]. The tests were carried out in a steel chamber, and the pressure loading was introduced by slowly filling the chamber with water. To enable the use of point tracking, two AVT Prosilica GC2450 high-speed cameras (with a logging rate of 15 Hz) were used to record the tests. The glass plate was fixed between steel plates by 16 equidistant M6 bolts. To avoid premature damage of the glass, 4 mm thick rubber strips were placed on either side of it. Furthermore, to fasten the upper steel plate properly, while limiting the pressure on the rubber and glass, 11.7 mm thick steel stoppers were placed on the bolts. See Figure 2a for an illustration. Figure 2b presents the applied pressure at failure. By analysing the problem in the finite element code Abaqus [10], without considering failure, the corresponding maximum in-plane stress was found to be in the range σ f [54; 94] MPa.

3.3. Shock Tube Tests

Twelve blast pressure tests were performed on glass plates with dimensions of 400 mm × 400 mm × 3.8 mm [6]. The fastening of the glass plate in the SSTF was similar to the quasi-static pressure tests, with use of rubber strips and steel stoppers. Table 1 summarizes the results from these tests, where P m a x (in kPa) refers to the maximum overpressure, t f r a c (in ms) is the time of fracture initiation, D m a x (in mm) is the maximum centre displacement before fracture, and v f r a g (in m/s) is the maximum glass fragment velocity. The tests are divided into three groups (A, B, C), depending on P m a x .
It can be seen from Table 1 that two out of the 12 glass plates did not fracture (B-04 and B-08). As the maximum applied pressure in e.g., group A was smaller, this illustrates the stochastic behaviour of glass fracture. Additionally, it can be seen that glass plates exposed to (almost) the same pressure, did not fracture at the same point in time.

4. Strength Prediction Modelling

A model for predicting the fracture strength of glass was recently proposed by Yankelevsky [7]. The model presented here is based on that work, but it includes additional features and adjustments.

4.1. Model Basis and Procedure
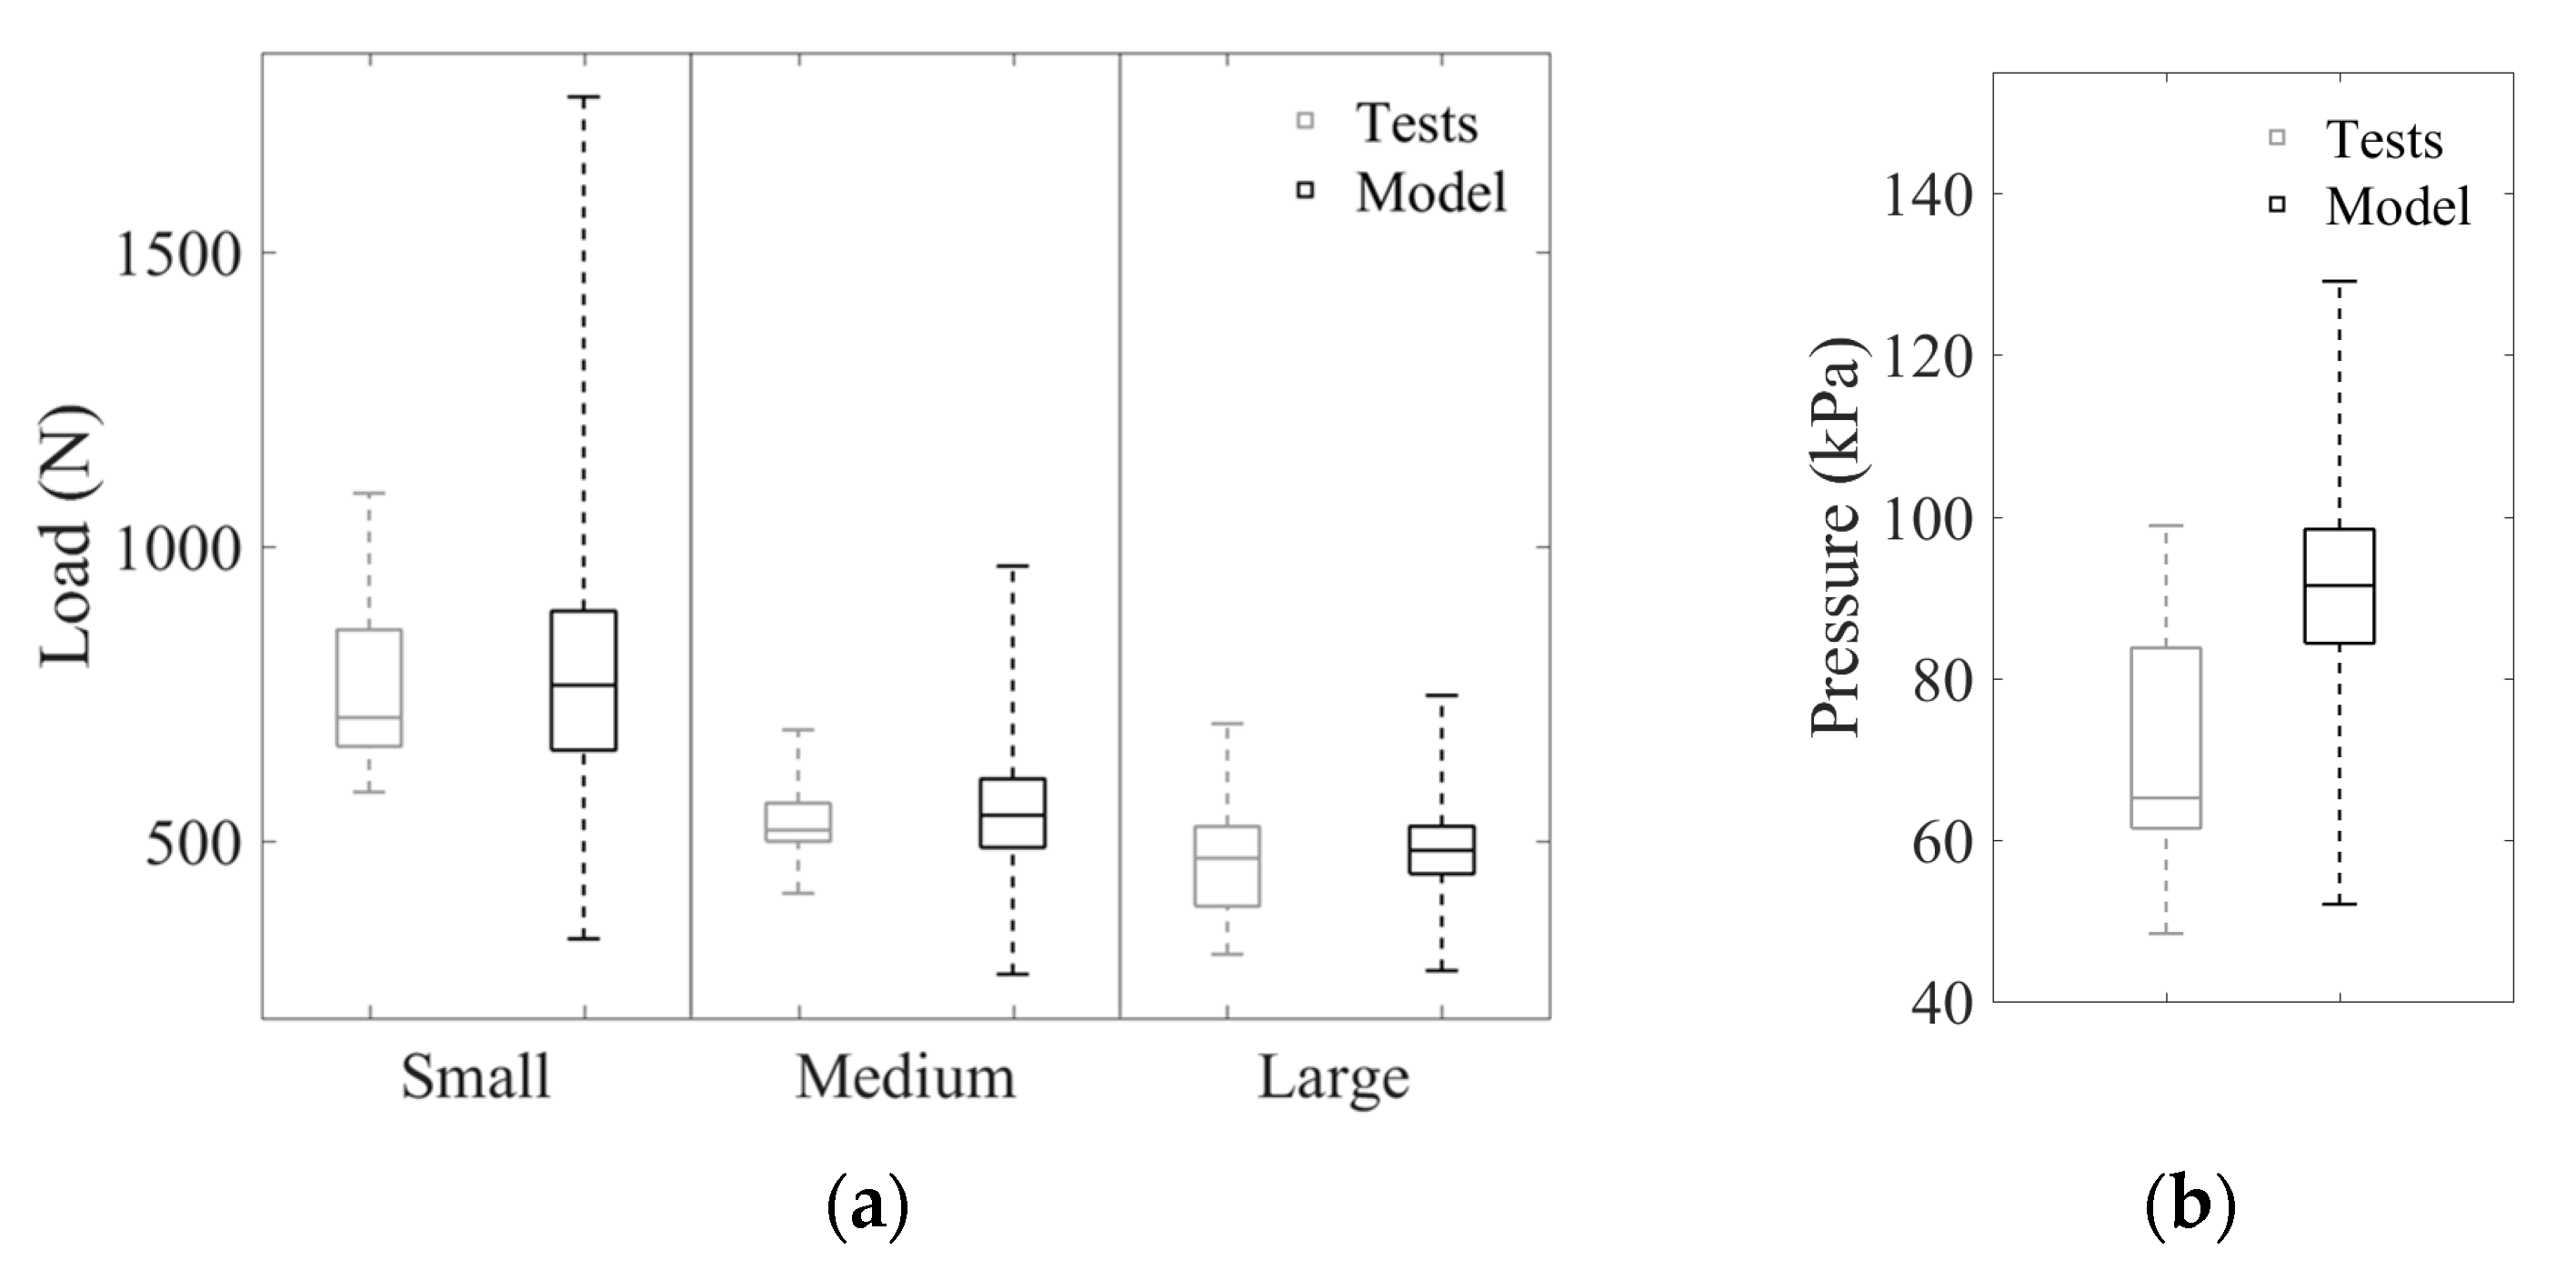
The basis of the strength prediction model is the fracture criterion given by Equation (1). For a given problem, the stresses in a glass plate (excluding fracture) can be provided by a finite element simulation, or if possible, an analytical calculation. In the strength prediction model, this information is combined with a flaw map, i.e., information about the position, size and orientation of the flaws in the glass plate. The flaw map is varied over n iterations in a Monte Carlo simulation, and in each iteration, the fracture criterion given by Equation (1) is checked. From this, we can obtain n   values of the fracture strength (given by stress, load, displacement, etc.), and time and position of fracture initiation. An estimated failure percentage can also be found. See [6] for more details.
The required input of the strength prediction model is given below.
  • Fracture toughness K I C
  • Flaw shape a / c
  • Flaw density ρ m a x
  • Maximum flaw depth a m a x
  • Area of jumbo plate A j u m b o
  • Number of iterations n
  • Stress history in glass from a FE simulation
The parameter A j u m b o refers to the area of a larger glass plate (jumbo plate) in which the analysed specimens are cut from.

4.2. Model Results

In the following, all three presented experimental set-ups were analysed by the strength prediction model. The stress histories in the glass were obtained by simulations in Abaqus, which were validated by the experimental data (pre-fracture). The following input parameters were employed for the strength prediction analyses. It is referred to Osnes et al. [6] for a justification of the chosen parameters.
  • K I C = 0.75 MPa m [11]
  • a / c = 1
  • ρ m a x = 2 flaws/cm2
  • a m a x = 100 μm
  • A j u m b o = 3210 × 6000 mm2
  • n = 5000
In Figure 3, the applied load at fracture from the experiments and the strength prediction model is compared for the four-point bending tests and the quasi-static pressure tests in “box plots”. In such a plot, the lower and the upper edges of the “box” mark the 25th and the 75th percentiles of the data, while the central line marks the median. The outer dashed lines include the rest of the data. For the four-point bending tests, the experimental results appeared within the predicted ones, with the median at approximately the same value. For the quasi-static pressure tests, the strength prediction model slightly overestimated the failure load; however, the majority of the test data (i.e., the “box”) appeared within the predicted values. This deviation might be explained by subcritical crack growth, i.e., stable growth of the flaws before failure. This effect is not considered in the model.
For the shock tube tests, the load was not gradually applied as for the quasi-static tests, and a failure load could not be compared for the tests and model in the same manner. Instead, the time of fracture initiation t f r a c is presented (see Figure 4a). Additionally, the predicted failure percentage was found to be 94.2, 99.8 and 100 for group A, B and C, respectively. Compared to the experimental results, this is too high. However, it should be noted that to draw any definite conclusions, a much larger number of experimental tests must be carried out. Nevertheless, it is known that the fracture strength of glass generally increases with the loading rate [4], and the chosen value for K I C might not be applicable. Therefore, a new simulation with an increased value (0.85 MPa m ) was performed (see Figure 4b).
The failure percentages were found to be 53.4, 94.6 and 100 for group A, B and C, which agrees better with the experimental results. The median values for t f r a c found in the experiments are also closer to the predicted ones. Note that K I C should in reality depend on the strain rate rather than being kept constant.

5. Concluding Remarks

The fracture strength of glass has been investigated in three different experimental set-ups; quasi-static four-point bending tests, quasi-static pressure tests and dynamic blast pressure tests. As expected, the experiments illustrated the stochastic nature of fracture in glass. This was shown by large variations in fracture strength within the same test set-up, including dependency on the loading and boundary conditions. Furthermore, a strength prediction model for glass, which is based on the existence of microscopic surface flaws, has been applied. It was shown that the model has a great potential when it comes to predicting the fracture strength in glass, as it managed to successfully capture many trends in the experiments. However, to improve the performance and accuracy of the model, a more thorough investigation of both glass’ loading rate dependency and the input parameters is necessary.

Author Contributions

The presented study has been conducted by K.O. in connection with her Ph.D. studies at NTNU, under supervision of T.B. and O.S.H.

Acknowledgments

The authors gratefully appreciate the financial support from CASA (project number 237885), Centre for Research-based Innovation (CRI), at the Norwegian University of Science and Technology (NTNU).

Conflicts of Interest

The authors declare no conflict of interest.

References

  1. Shariat, S.; Mallonee, S.; Stephens-Stidham, S. Summary of Reportable Injuries in Oklahoma: Oklahoma City Bombing Injuries. 1998. Available online: https://www.ok.gov/health2/documents/OKC_Bombing.pdf (accessed on 13 July 2018).
  2. Beason, W.L.; Morgan, J.R. Glass failure prediction model. J. Struct. Eng. 1984, 110, 197–212. [Google Scholar] [CrossRef]
  3. Wachtman, J.B.; Cannon, W.R.; Matthewson, M.J. Mechanical Properties of Ceramics, 2nd ed.; John Wiley & Sons: Hoboken, NJ, USA, 2009. [Google Scholar]
  4. Larcher, M.; Solomos, G.; Casadei, F.; Gebbeken, N. Experimental and numerical investigations of laminated glass subjected to blast loading. Int. J. Impact Eng. 2012, 39, 42–50. [Google Scholar] [CrossRef]
  5. Aune, V.; Fagerholt, E.; Langseth, M.; Børvik, T. A shock tube facility to generate blast loading on structures. Int. J. Prot. Struct. 2016, 7, 340–366. [Google Scholar] [CrossRef]
  6. Osnes, K.; Børvik, T.; Hopperstad, O.S. Shock tube testing and strength modelling of annealed float glass. 2018; in press. [Google Scholar]
  7. Yankelevsky, D.Z. Strength prediction of annealed glass plates—A new model. Eng. Struct. 2014, 79, 244–255. [Google Scholar] [CrossRef]
  8. Newman, J.; Raju, I. An empirical stress-intensity factor equation for the surface crack. Eng. Fract. Mech. 1981, 15, 185–192. [Google Scholar] [CrossRef]
  9. Fagerholt, E. Field Measurements in Mechanical Testing Using Close-Range Photogrammetry and Digital Image Analysis. Ph.D. Thesis, Norwegian University of Science and Technology (NTNU), Trondheim, Norway, 2012. [Google Scholar]
  10. Dassault Systemes Simulia Corporation. Abaqus, Version 6.14; Dassault Systemes Simulia Corporation: Providence, RI, USA, 2014. [Google Scholar]
  11. Anstis, G.; Chantikul, P.; Lawn, B.R.; Marshall, D. A critical evaluation of indentation techniques for measuring fracture toughness: I, Direct crack measurements. J. Am. Ceram. Soc. 1981, 64, 533–538. [Google Scholar] [CrossRef]
Figure 1. Probability density of force at failure for (a) small, (b) medium and (c) large specimens [6].
Proceedings 02 00495 g001
Figure 2. Quasi-static pressure tests: (a) assembly of the test set-up and (b) applied pressures at failure.
Proceedings 02 00495 g002
Figure 3. Failure load determined by laboratory tests and the strength prediction model in (a) four-point bending tests and (b) quasi-static pressure tests.
Proceedings 02 00495 g003
Figure 4. Time of fracture initiation t f r a c in shock tube tests for group A, B and C determined by experiments and the strength prediction model, with K I C set to (a) 0.75 MPa m and (b) 0.86 MPa m in the model.
Proceedings 02 00495 g004
Table 1. Summary of the blast tests in the SSTF [6].
Test P m a x t f r a c   1 D m a x   v f r a g   Test P m a x   t f r a c   1 D m a x   v f r a g  
A-0153.01.214.5215.8C-0173.41.295.8921.5
A-0251.61.385.0614.7C-0273.21.336.4822.3
B-0163.70.883.2324.5B-0563.31.004.2921.8
B-0264.61.255.4018.8B-0662.90.923.6819.3
B-0365.51.465.6417.3B-0764.01.335.7719.0
B-0462.5 × 5.44 × B-0862.9 × 5.96 ×
1  t = 0 corresponds to the arrival time of the blast wave at the glass plate.
Publisher’s Note: MDPI stays neutral with regard to jurisdictional claims in published maps and institutional affiliations.

