Proceeding Paper

Calibration of Hardness Transfer Functions Based on Micro Tensile and All Weld Metal Tensile Tests of Heterogeneous Welds †

1
Soete Laboratory, Department of EEMMeCS, Ghent University, Technologiepark Zwijnaarde 903, Zwijnaarde 9052, Belgium
2
Faculty of Mechanical Engineering, University of Maribor, Smetanova ulica 17, 2000 Maribor, Slovenia
*
Author to whom correspondence should be addressed.
Presented at the 18th International Conference on Experimental Mechanics (ICEM18), Brussels, Belgium, 1–5 July 2018.
Proceedings 2018, 2(8), 468; https://doi.org/10.3390/ICEM18-05372
Published: 19 June 2018
(This article belongs to the Proceedings of The 18th International Conference on Experimental Mechanics)

Abstract

:
In order to assess the integrity of welded structures, it is important to accurately know the material characteristics of the weld regions. A weldment is heterogeneous i.e., strength properties vary at different locations within the weld. This influences the behavior of the structure when it is subjected to loading. Hence, the evaluation of material properties within the weld region plays a pivotal role in structural integrity assessment. Traditionally, tensile tests provide constitutive properties like tensile strength and yield strength along with stress (σ)—strain (ε) curves. Alternatively, hardness indentations are also used to procure strength properties of a material. Several transfer functions have been formulated to convert hardness values to strength properties. The validity of these transfer functions with the presence of strength variations is questionable, as these relations do not consider the aspect of heterogeneity. Accordingly, in this research, a heterogeneous weld was considered to assess the relation between Vickers hardness (HV5) and strength properties. Two tensile test configurations were considered—All Weld Metal Tensile Tests (AWMTT) and Micro Tensile Tests (MTT). While AWMTT provides average weld stress-strain properties, MTT provide local properties. These results help to validate the hardness transfer functions and thus calibrate them appropriately. Hardness maps were obtained on polished weld macrographs. The material properties obtained from three methods were compared and significant variations were observed. Based on these differences, an experimentally calibrated transfer function is implemented. With this relation, it is possible to predict weld behavior more accurately and appropriately using hardness maps and tensile tests.

1. Introduction

Evaluating heterogeneity within welds has been an important part in assessing the integrity of a welded structure. Local variations of stress-strain behavior lead to scattered defect tolerance predictions [1]. Hence, it is important to comprehend weld heterogeneity and quantify the variations. In order to achieve that, researchers have utilized different methods like hardness indentations and micro tensile tests [2,3,4]. However, micro tensile tests are cumbersome to adopt. Vickers hardness mapping performed on a section of a weld is comparatively effortless (e.g., using automated devices) and standards [5,6] provide ‘transfer functions’ to convert hardness values to strength properties like ultimate tensile strength (Rm), yield strength (Rp0.2) and strain hardening exponent (n). Standards ISO 18265 [6] relates Vickers macro hardness (HV5, in this study) to Rm and ISO 15653 [5] relates HV5 to Rm and Rp0.2. These hardness transfer functions have been developed based on averages of generic property databases. Moreover, they do not particularly consider the effect of strength heterogeneity which is different for each weld. Hence, the question arises about the robustness of the available standard transfer functions and their sound applicability at all locations within welds.
Transfer functions of the abovementioned standards have been analyzed by Naib et al. [7] using Finite Element (FE) simulations and used to predict the load-displacement output of fracture toughness experiments. High errors were observed between experiments and simulations using the standard transfer functions (up to 20% error in load). An experimental calibration procedure was developed to obtain material specific transfer functions, producing average simulation errors on load of less than 5%. The transfer function Equations are given below.
Tensile   strength ,   R m = R m ( A W M T T ) H V H V A W M T T
Yield   strength ,   R p 02 = R p 02 ( A W M T T ) H V H V A W M T T
Here R m ( A W M T T )   and   R p 0.2 ( A W M T T ) are ultimate tensile and yield strength obtained from All Weld Metal Tensile Test (AWMTT) and are curve fitted using least squares method [8] and H V A W M T T is the average hardness in the circular cross section of the AWMTT sample.
To directly validate the soundness of the obtained transfer functions within heterogeneous welds, local strength properties have been obtained by Micro Tensile Tests (MTT). The material properties obtained from MTT tests have been compared with properties predicted by hardness transfer functions. In this paper, the Equations (1) and (2) along with standardized Equations are assessed for their capability in predicting MTT results. The paper is structured as follows. The considered weld material is introduced in Section 2, the testing procedures for All Weld Metal Tensile Tests and Micro Tensile Testing are described in Section 3, Section 4 describes and discusses the results and Section 5 concludes.

2. Material

A welded (X bevel) S690 steel plate was utilized in this study. This weld had a strength overmatching (OM) and undermatching (UM) region by applying different filler metals at either sides of the plate. The weld is illustrated in Figure 1a.
Vickers hardness (HV5) mapping [9] was performed to assess hardness variations across the weld. ~1000 indents were induced on the surface with 50 N (5 kgf) load and these HV5 values were collected on a 2D contour plot showing hardness variations (Figure 1b). 50% and more difference in hardness is observed between the OM and UM region. This gives an idea about the significant heterogeneity present in the weld joint. Also notable (but outside the scope of this paper) are high peak hardness values in the heat affected zones. This weld was sectioned for AWMTT and Micro Tensile Testing (MTT) testing.

3. Testing Procedure

The process followed in this research is listed below:
-
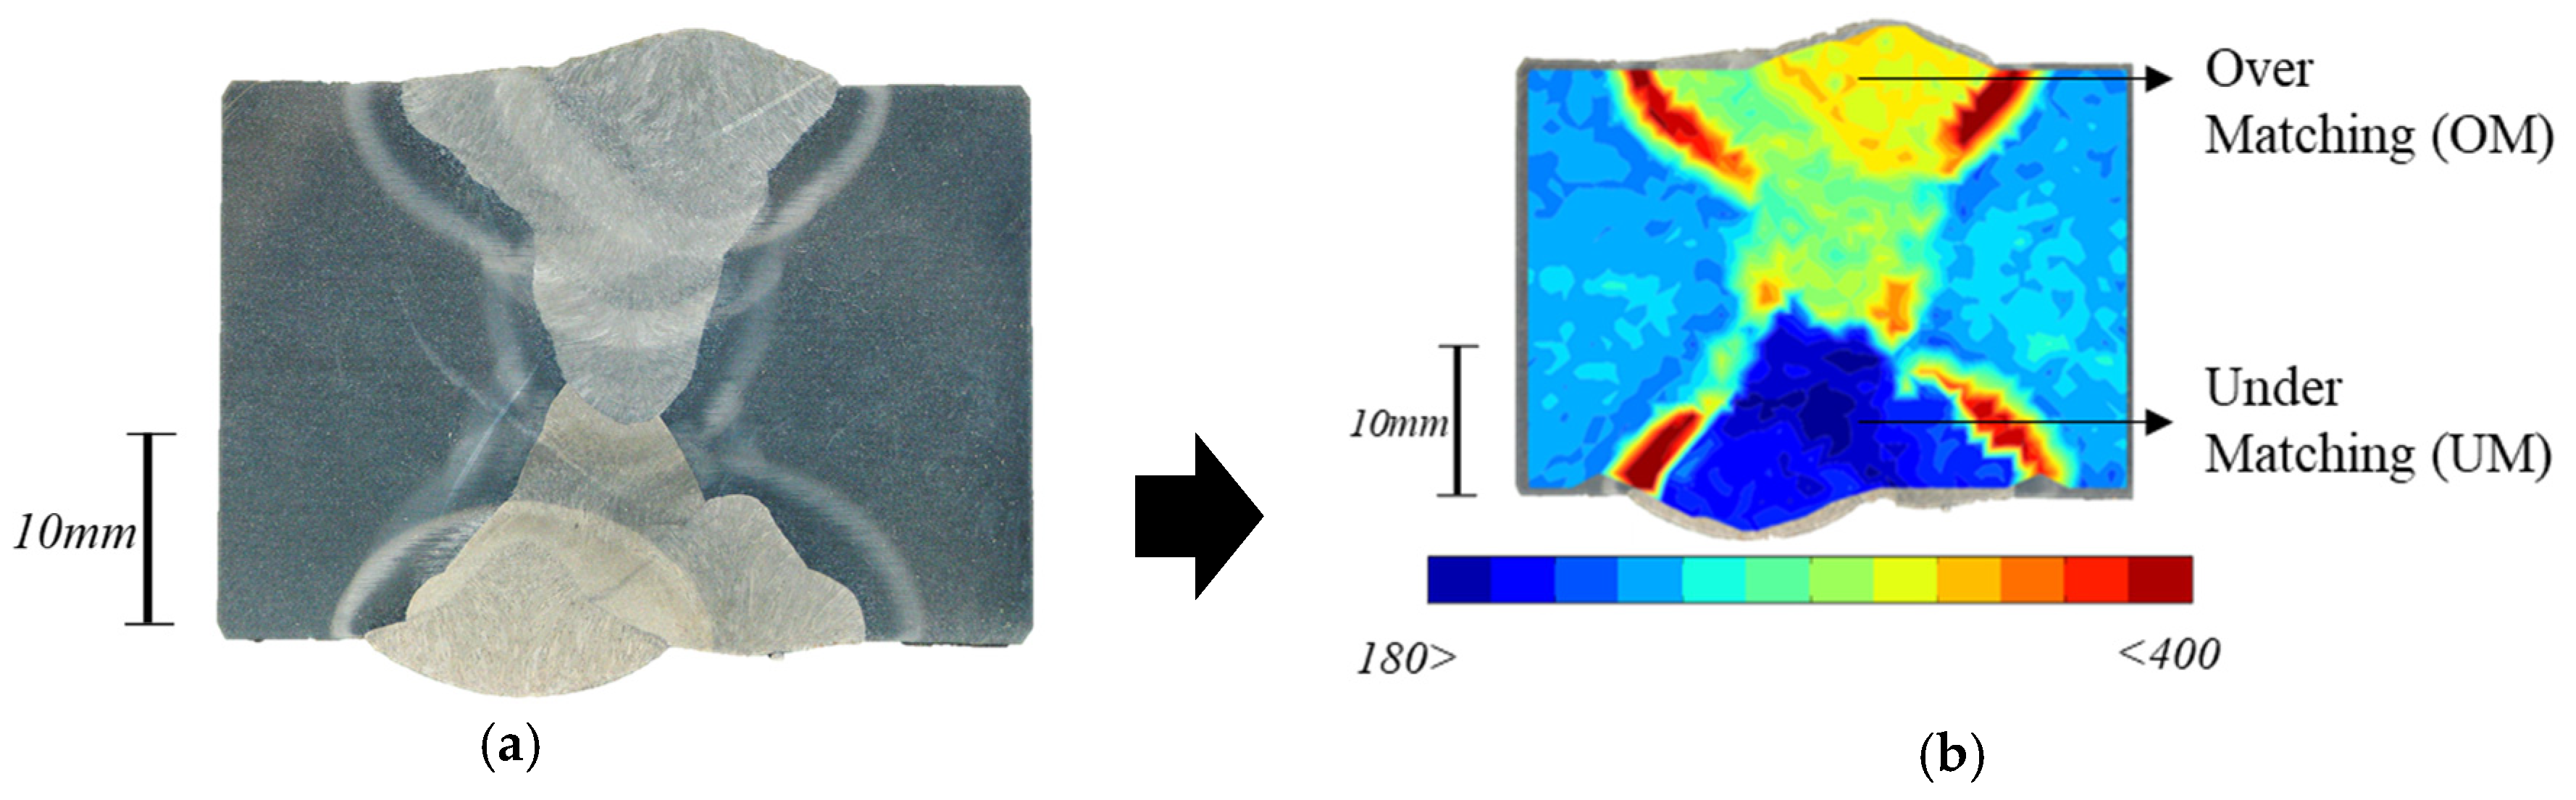
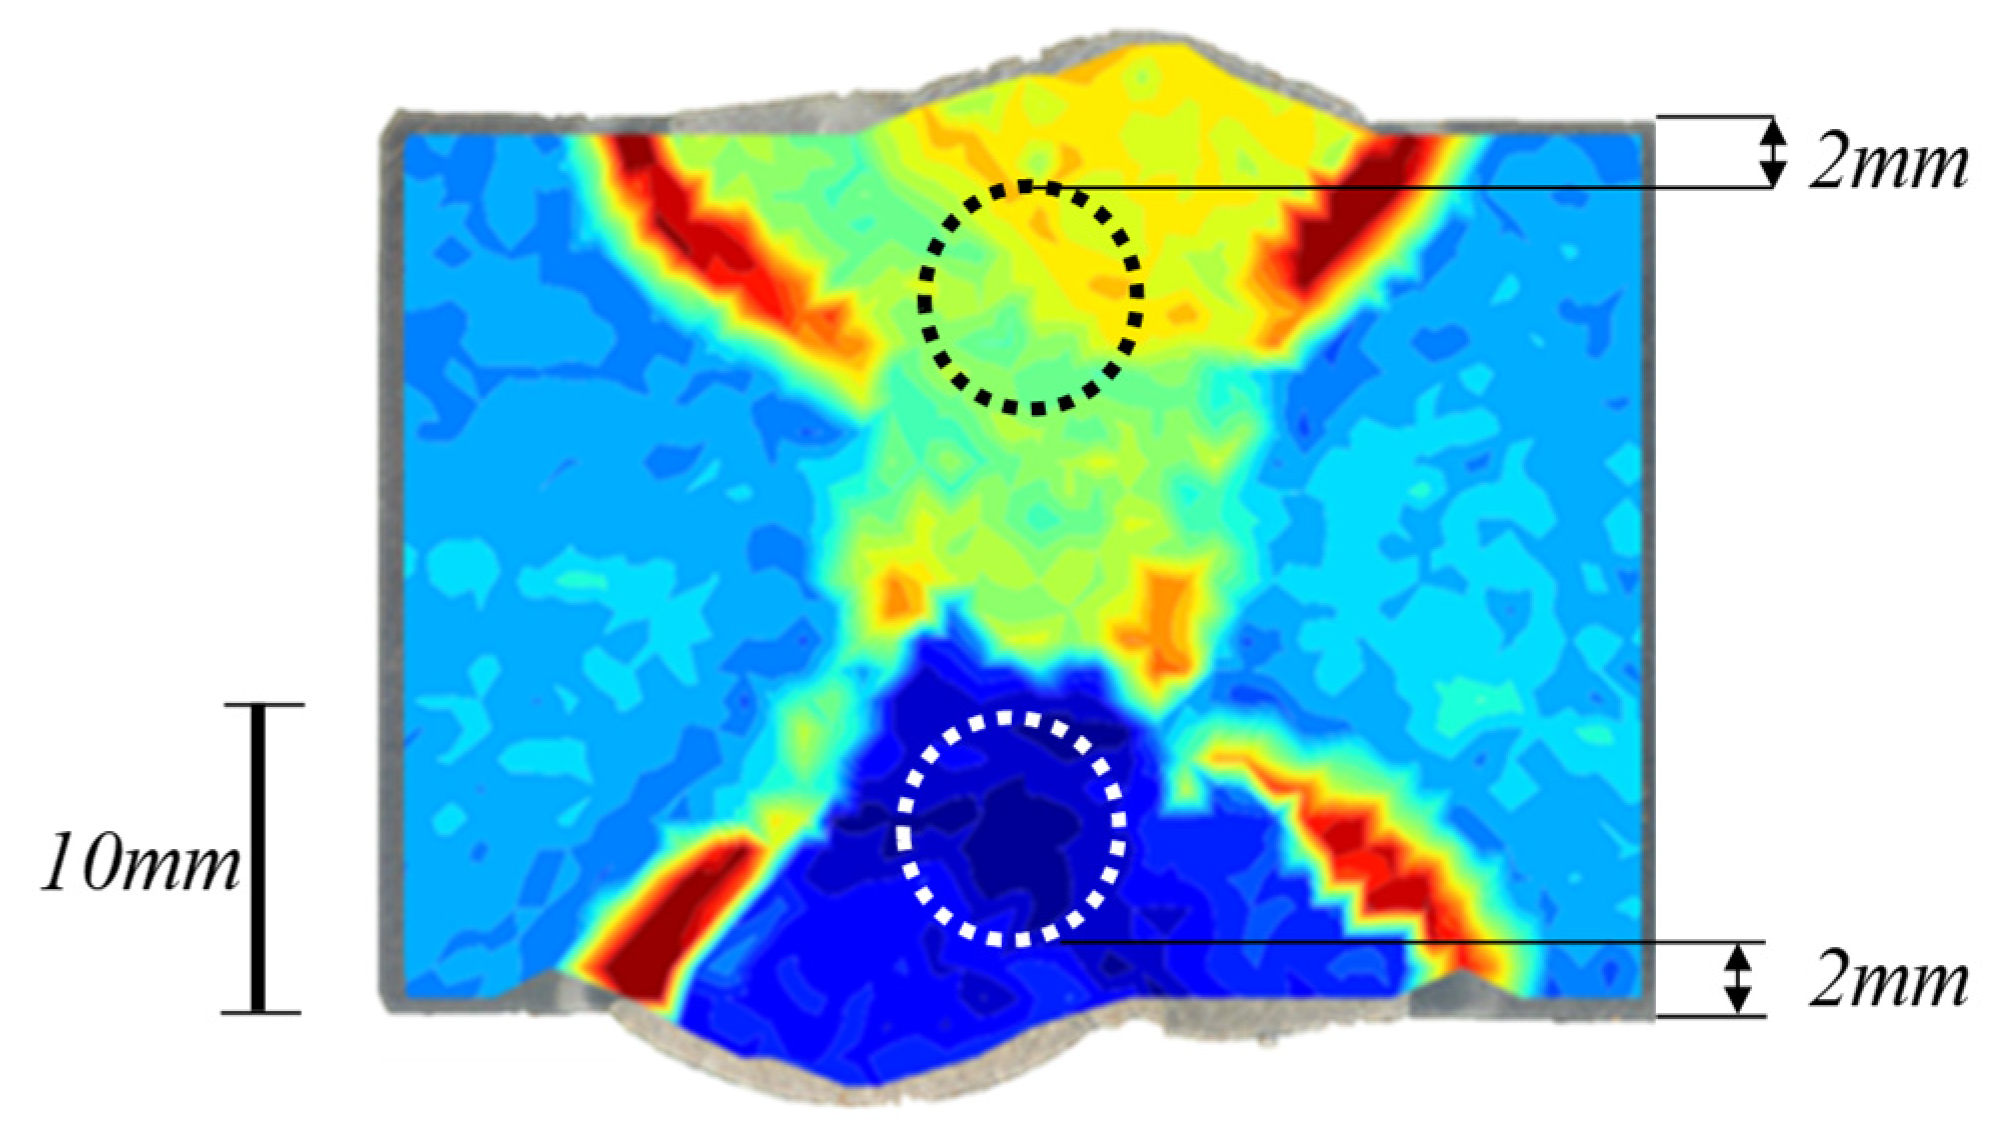
Two AWMTT specimens were extracted in the OM and UM region. Hence, R m ( A W M T T )   a n d   R p 02 ( A W M T T ) were obtained for both weld regions. From the hardness map shown in Figure 1b, the average hardness values were gathered in the circular region representing the cross section of the AWMTT specimens were extracted (see Figure 2) ( H V A W M T T is obtained).
-
16 MTT specimens were tested (8 OM and 8 UM specimens) and Rp02(MTT) and Rm(MTT) were correspondingly obtained for each specimen. The specimen ends were further subjected to hardness indentations to obtain HV5 values Out of 8 specimens in each configuration, first four were selected starting from cap of the weld and the other four were chosen starting at a distance of 8 mm. These specimens were chosen in accordance with the location of the extraction of AWMTT specimen approximately.
Detailed explanations of the AWMTT and MTT test procedures are given in Section 3.1 and Section 3.2.

3.1. All Weld Metal Tensile Tests

Round bar AWMTT specimens of 5 mm gauge diameter were extracted from each weld region mentioned in Section 3.1. These specimens were subjected to tensile testing to obtain average stress-strain properties within the sampled weld region. Hardness transfer functions (1) and (2) were calibrated on the basis of the yield and ultimate tensile strength values, and average hardness values HVAWMTT in circular regions selected in the hardness map of a weld macrograph. The AWMTT specimens were extracted near the location of hardness macrographs to minimize effects of heterogeneity in the welding direction (which is neglected in this study) on the AWMTT based transfer functions. Figure 2 shows the location of extraction of AWMTT. The tests were performed in accordance with ASTM E8/E8M-11 [9].

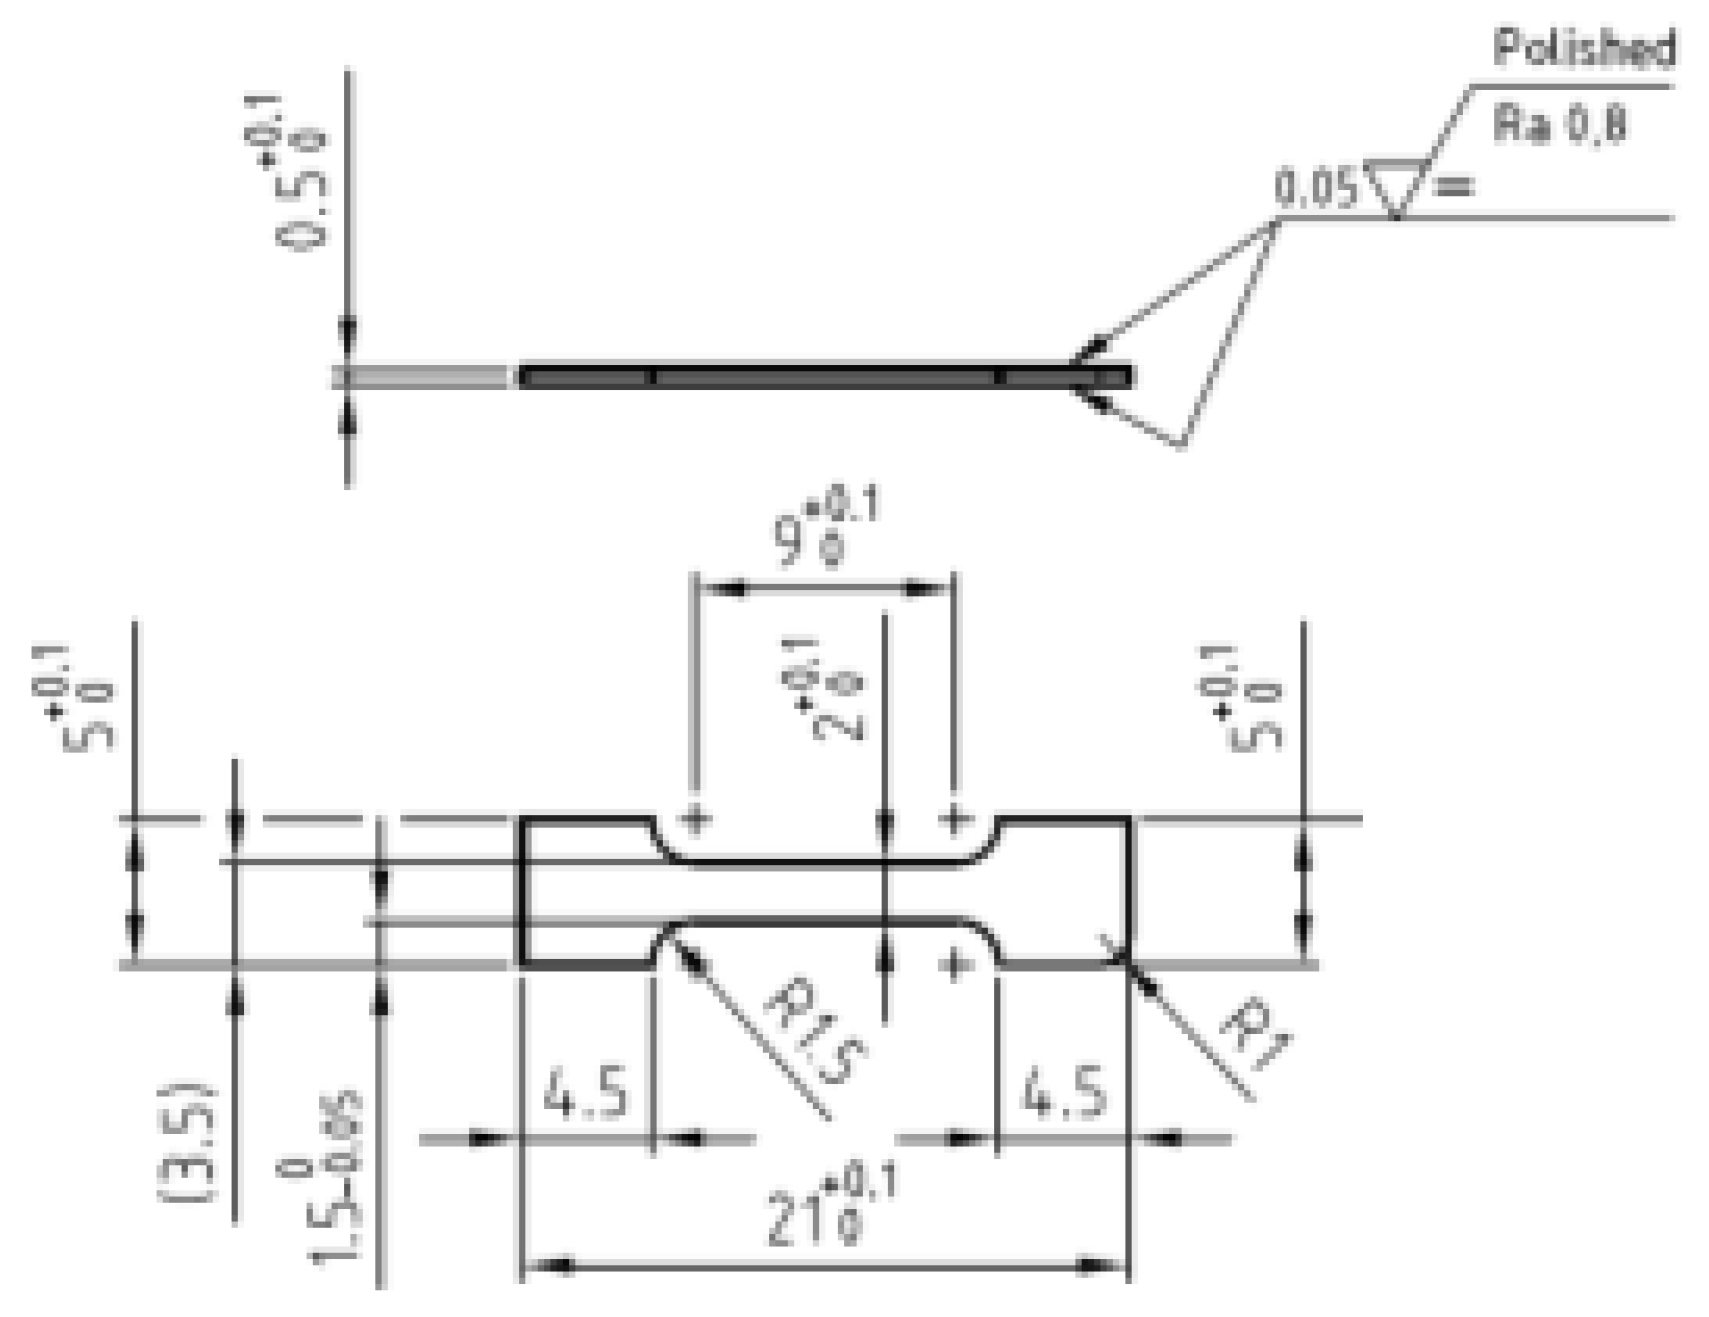
3.2. Micro Tensile Tests

MTT specimens were extracted from the weld by means of electrical discharge machining (EDM). This technique is suitable as no mechanical forces are applied to the vulnerable specimens. Dog bone shaped blocks were taken out in the welding direction, and were divided into 0.7-mm-thick slices (Figure 3) [4]. These were then ground on both sides to a thickness of 0.5 mm, thus removing the brittle heat-affected zone associated with the EDM. One block was entirely located in the weld and oriented in the through-thickness direction, whereas other blocks sampled base metal, HAZ and weld metals at the OM and UM sides. Results of 16 specimens in the OM and UM weld regions (8 from each region) of the latter blocks are discussed in this paper. The dog bone geometry has a nominal cross-sectional area of 1 mm2 and was adopted from [10].
Digital image correlation was used to measure full-field displacements within the MTT, out of which the strain was calculated. The specimens were painted white, followed by applying black speckles which were then monitored by cameras which captures images throughout the test [4]. These images are then post processed using devoted software (ARAMIS) for DIC analysis.

4. Results and Discussions

In this section, the strength properties i.e., yield strength (Rp02) and tensile strength (Rm) values obtained from AWMTT and MTT specimens, along with Vickers hardness maps, are utilized to validate the Equations (1) and (2). Using the values obtained from the above tests, plots were created comparing MTT results against corresponding HV values. The data points are then compared against different HV transfer functions (Figure 4 and Figure 5). The Equations derived from ISO 18265 (linear regression of tabulated data) and directly provided by ISO 15653, along with Equations (1) and (2), are plotted. Notably, ISO 18265 provides a transfer function for Rm only, whereas ISO 15653 additionally informs how to calculate Rp02 from HV. Along with these lines, strength properties (Rp02 and Rm) acquired from MTT tests are plotted against hardness values from the same samples as MTT(OM) and MTT(UM).
The following can be observed from Figure 4 and Figure 5.
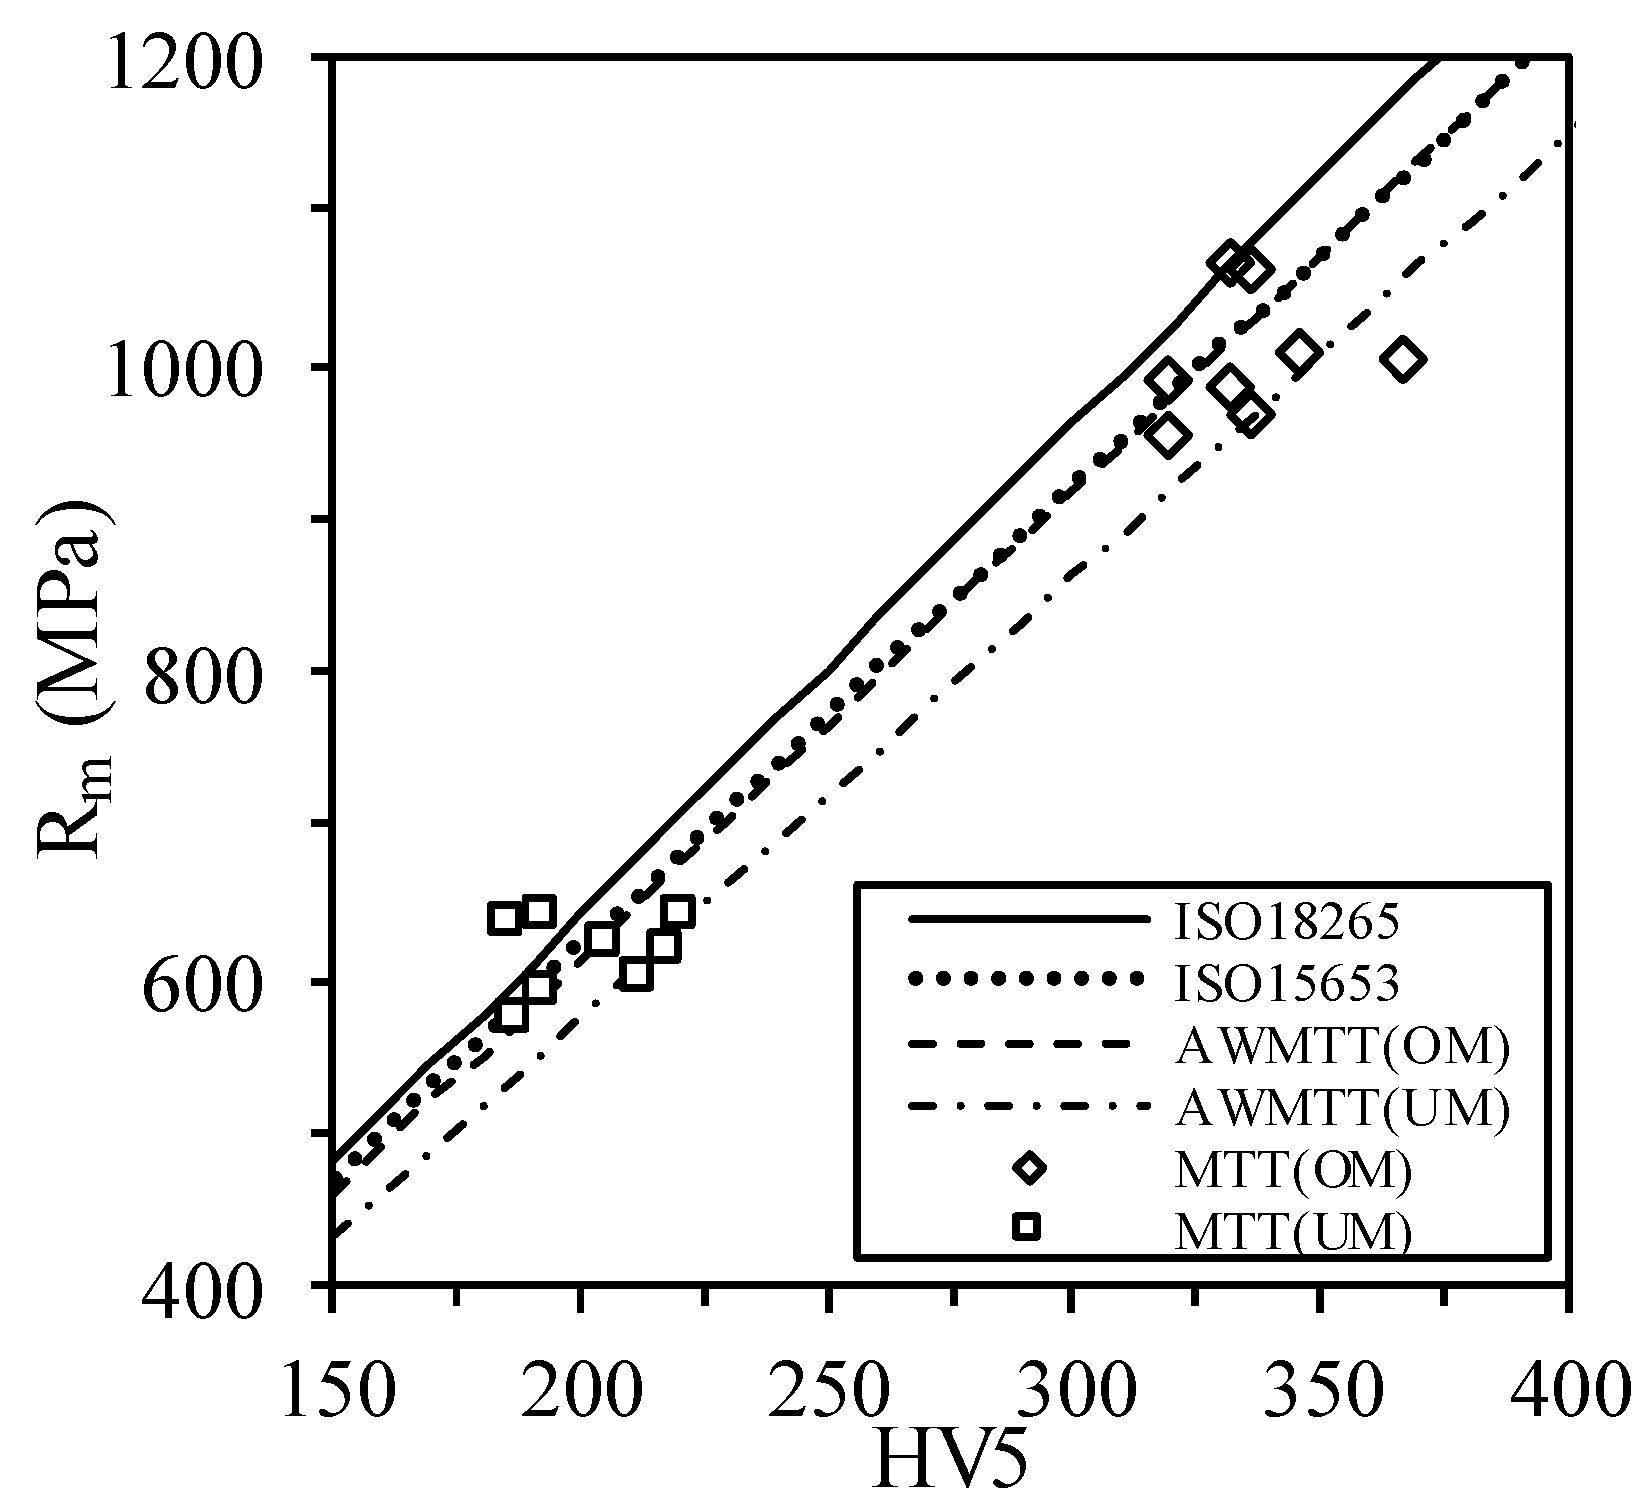
  • The hardness and strength values of the MTT specimens confirm the very strong differences in properties between the UM and OM weld regions.
  • Equations (1) and (2) predict lower values of Rm when compared with the standard Equations as seen in Figure 4. For instance, the ultimate tensile strength predicted from the AWMTT data of the undermatching region is ~5% lower than that given by ISO 18265. In Figure 5, a similar deviation is observed for yield stress.
  • AWMTT analysis of the UM and OM regions yields an updated hardness transfer functions. This highlights the material-specific character of the relation between hardness and strength properties, and confirms that the generic nature of standardized HV transfer functions may invoke errors.
  • Focusing on Rp02 (Figure 5), the differences between different transfer functions are subtle compared to the scatter in data points obtained from the MTT test data. This relates to the knowledge that HV is theoretically stronger related to Rm [11]. The scatter in the Rp02 dataset results from local variations in strain hardening behavior (which are not captured by the transfer functions). In contrast, experimental scatter is limited for Rm and, there, the AWMTT based transfer function appears to better represent the average of the MTT datasets. Notwithstanding the higher scatter for the Rp02 plot, the corresponding HV transfer functions manage to capture the general trend and to quantify the large differences between the yield strengths of UM and OM weld metal.
  • Averaging all specimens and configurations, the differences obtained between AWMTT based calibrated transfer functions and MTT results are 3.2% for Rm and 5.2% for Rp02. This is less than the deviations when using standard transfer functions which show average differences of ~11% for Rm (ISO 18265); and ~7% for Rm and ~18% for Rp0.2 (ISO 15653).
With these observations, it turns out that experimentally calibrated transfer functions (based on HV mapping and a simple standard AWMTT test) agree with actual HV-strength relations obtained from (more challenging) micro tensile tests. Moreover, a similar agreement is not observed when using generic, standardized hardness transfer functions.

5. Conclusions

In this research, experimentally calibrated hardness transfer functions were used to obtain yield strength (Rp02) and tensile strength (Rm). The calibration procedure is straightforward and based on a Vickers hardness map and a standard all-weld metal tensile test. These transfer functions were compared with standardized relations, and their outcomes were validated against local hardness and strength data obtained from micro tensile test specimens. The examinations were performed on a highly heterogeneous weld, consisting of a strength overmatching and strength undermatching region (with respect to the base metal properties).
The results show that the generic nature of standardized transfer functions does not represent the material specific nature of HV-strength relationships, whereas subtle differences between materials can be captured by the experimentally calibrated transfer functions. Using these transfer functions can provide a better estimation of weld strength properties which allows for more accurate estimations of structural behavior (as illustrated in previous work of the authors, see reference [7]). Therefore, we advise the AWMTT based procedure as a pragmatic alternative to adopting standardized, generic transfer functions.

Author Contributions

S.N. is the author and main contributor in performing this research. P.Š. and N.G. contributed towards the ideology, assistance and instrumentation of Micro Tensile Tests (MTT) at Maribor University and is also a collaborator of this research project. Producing the welds for testing is also their contribution. W.D.W. and S.H. supervise this research project at Ghent University and contributed overall insights of this project.

Acknowledgments

The authors would like to acknowledge FWO Vlaanderen (Research Foundation—Flanders, research grant nr. G.0609.15N) and ARRS (Slovenian Research Agency) for the support provided during this research.

Conflicts of Interest

The authors declare no conflict of interest. The founding sponsors had no role in the design of the study; in the collection, analyses, or interpretation of data; in the writing of the manuscript, and in the decision to publish the results.

References

  1. Koçak, D.M. Fitnet—European Fitness for Service Network, GTC1—2001—43049; GKSS Forschungszentrum Geesthacht GmbH (GKSS): Geesthacht, Germany, 2006. [Google Scholar]
  2. Cam, G.; Kocak, M.; Erim, S.; Yeni, C. Determination of mechanical and fracture properties of laser beam welded steel joints. Weld. J. 1999, 78, 193s–201s. Available online: http://img2.aws.org/wj/supplement/june99/CAM.pdf (accessed on 26 July 2018).
  3. LaVan, D.A.; Sharpe, W.N. Tensile testing of microsamples. Exp. Mech. 1999, 39, 210–216. [Google Scholar] [CrossRef]
  4. Hertelé, S.; Bally, J.; Gubeljak, N.; Štefane, P.; Verleysen, P.; De Waele, W. Characterization of heterogeneous arc welds through minature tensile testing and vickers hardness mapping. Mater. Tehnol. 2016, 50, 571–574. [Google Scholar] [CrossRef]
  5. ISO. ISO 15653:2010—Metallic Materials—Method of Test for the Determination of Quasistatic Fracture Toughness of Welds; ISO: Geneva, Switzerland, 2010. [Google Scholar]
  6. ISO. ISO 18265:2013—Metallic Materials—Conversion of Hardness Values; ISO: Geneva, Switzerland, 2013. [Google Scholar]
  7. Naib, S.; Van Minnebruggen, K.; De Waele, W.; Hertelé, S. Sensitivity study of crack driving force predictions in heterogeneous welds using Vickers hardness maps. In Proceedings of the International NAFEMS Conference on Engineering Analysis, Modeling, Simulation and 3D-Printing (NAFEMS-3D–2016), Bangalore, India, 29–31 August 2016. [Google Scholar]
  8. Hertelé, S.; De Waele, W.; Denys, R.; Verstraete, M. Full-range stress–strain behaviour of contemporary pipeline steels: Part I. Model description. Int. J. Press. Vessel. Pip. 2012, 92, 34–40. [Google Scholar] [CrossRef]
  9. ASTM. ASTM E8/E8M-16a, Standard Test Methods for Tension Testing of Metallic Materials; ASTM: West Conshohocken, PA, USA, 2016. [Google Scholar]
  10. Koçak, M. Structural integrity of welded structures: Process-property-performance (3P) relationship. In Proceedings of the 63rd Annual Assembly & International Conference of the International Institute of Welding, Istanbul, Turkey, 11–17 July 2010; pp. 11–17. [Google Scholar]
  11. Tabor, D. The Hardness of Metals; Clarendon: Oxford, UK, 1951. [Google Scholar]
Figure 1. (a) weld section extracted from S690 test plate and (b) hardness (HV5) contour plot obtained from sample shown in (a) with approximately 1000 indents.
Proceedings 02 00468 g001
Figure 2. The AWMTT specimens were extracted at a 2mm distance from the plate surfaces in the OM and UM regions. They were extracted such that the entire cross section lies within the weld without intersecting the HAZ or the interface between OM and UM weld metal.
Proceedings 02 00468 g002
Figure 3. Extraction and dimensions of micro tensile specimens.
Proceedings 02 00468 g003
Figure 4. Hardness values (HV5) against tensile strength (Rm) from different transfer functions and experimental data.
Proceedings 02 00468 g004
Figure 5. Hardness values (HV5) against yield strength (Rp02) from different transfer functions and experimental data.
Proceedings 02 00468 g005
Publisher’s Note: MDPI stays neutral with regard to jurisdictional claims in published maps and institutional affiliations.

