1. Introduction
In aircraft engines, some pieces like the shaft, rotor blades, and gears are describing a rotating movement. These pieces are in contact with rotating and non-rotating parts of the engine through the bearings and gears. The different bearings and gears must be lubricated. Oil is used to lubricate the contact area and to cool down the engine thanks to its heat transfer properties.
To ensure effective operation of the engines, a significant number of sensors are used. In particular, the debris monitoring sensors play a major role. During the life of an engine, the contact patches produce oil-insoluble debris. This will be collected in the lubrication oil of the engine. The debris monitoring sensors’ function is to detect those particles in the oil and catch them. The analysis of the debris located in the oil allows us to detect the degradation of surfaces, assess the overall health of the engine and detect any anomalies.
The debris monitoring sensors play a role in preventive maintenance, assuring long engine service life and reducing maintenance costs. The goal of the sensors is to provide global real-time control of the mechanical system of the aero-engine.
2. Objective of the Study
The aim of this study is to compare the behaviour of the various debris monitoring sensors in the presence of a pollutant in the oil circuit. A test bench is built and will be part of an experiment on different debris monitoring systems. The study is divided into two parts. The first is the design, conception and assembly of an oil test bench for performing the different sensors tests. The second part is to realize the different debris monitoring sensor tests and compare the different types of sensors.
3. Oil Debris Monitoring Sensors
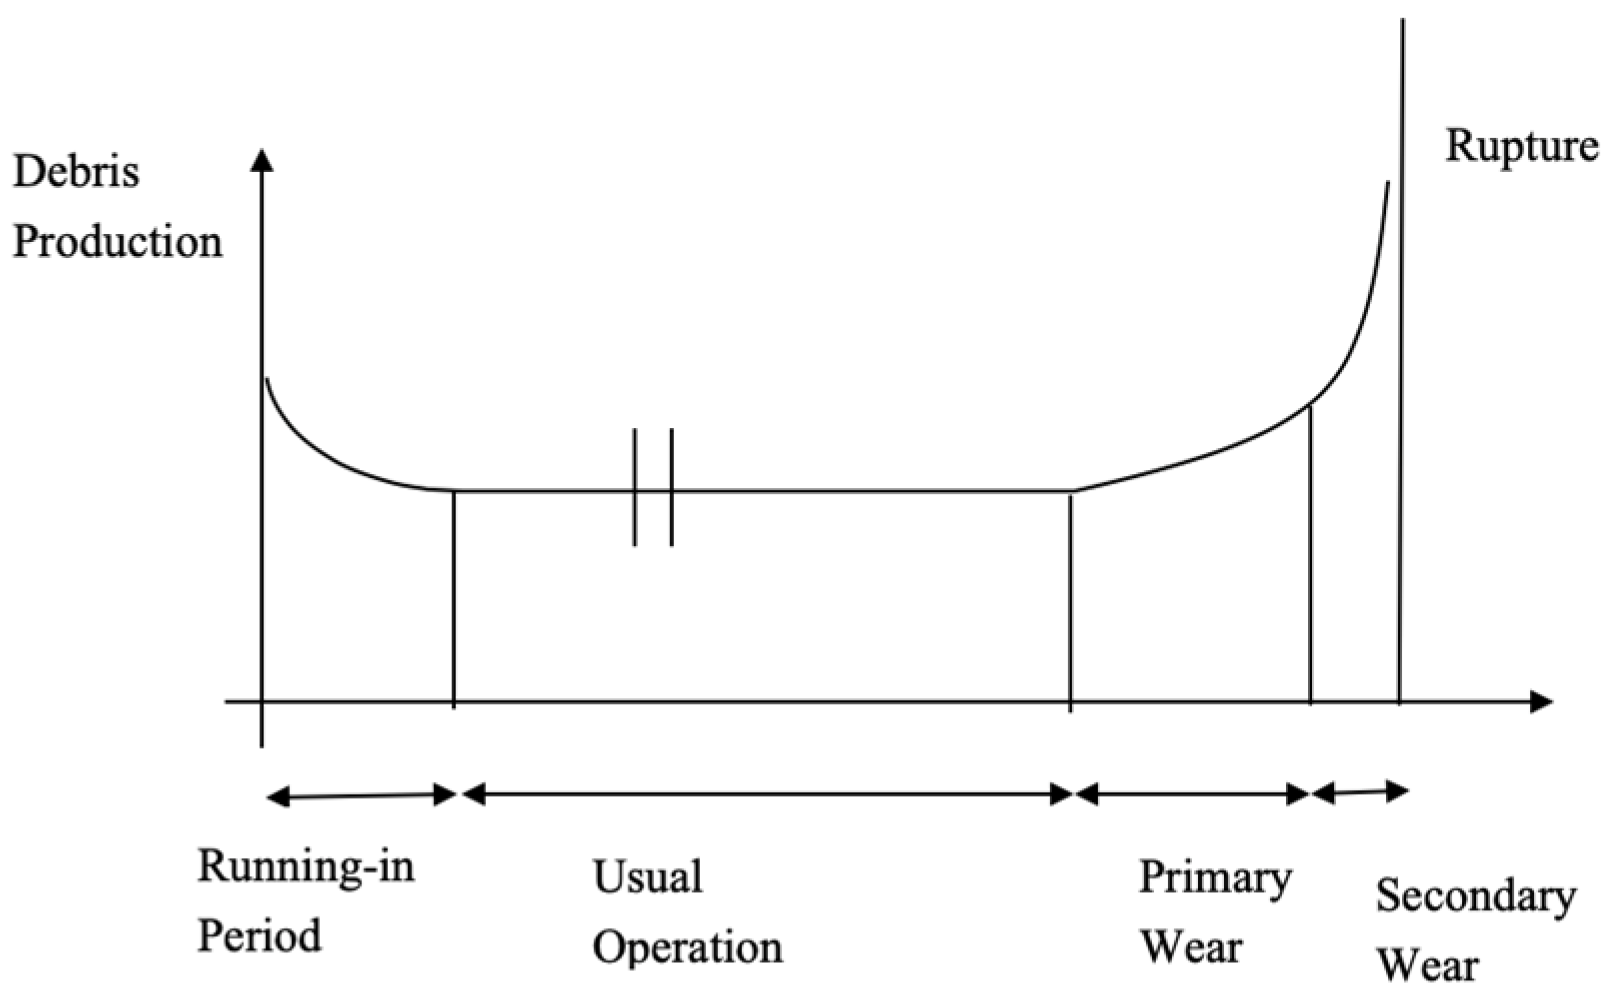
Oil debris monitoring is part of system health monitoring. This monitoring responds to different needs: firstly, to ensure a long life for all systems; and secondly, to reduce the maintenance costs by tracing the evolution of degradation and so performing maintenance at the right moment. Most of the bearings and gears in aeronautical industry are made of ferrous materials and nonferrous materials. In
Figure 1, the production of debris during the lifetime of a piece is shown according to the study of Vernochet M. [
1]. It is divided into three parts: the first one is the break-in period, during which a large amount of debris is produced, called fuzz. The second part corresponds to the regular working of the components. The number of particles produced is constant and stable. The last part corresponds to the last part of the life of a component; like the wear of a bearing, it is when the number of particles produced is high and the debris is becoming bigger. The type of debris is important and gives an indication of which pieces are going to fail. The detection of particles is used to determine the mechanical health of the lubrication system of the jet engine. The wear of the surface in contact between the pieces produces particles of different sizes. The aim of the debris detection system is to detect in real time the various breakdowns. It can report the evolution of wear and prevent the breakdown of the lubrication system [
2].
3.1. GasTOPS Metalscan
The first sensor is the GasTOPS Metalscan [
3,
4], an on-line sensor. It detects metallic debris in a lubrication oil system, but does not catch it. The sensor consists of a non-intrusive detector connected to the pipeline. According to GasTOPS [
5], the sensor is made of three coils as can be seen in
Figure 2; the two coils on the external side are oppositely wound and are supplied with an alternating current source. Their respective magnetic fields are opposed and cancel out at the centre of the sensor. A coil is placed between the two coils driven by a current. When metallic particles are passing through the sensor, the coil in the centre measures the disturbance in magnetic fields. The magnitude of disturbance of the signal gives the size of the particle.
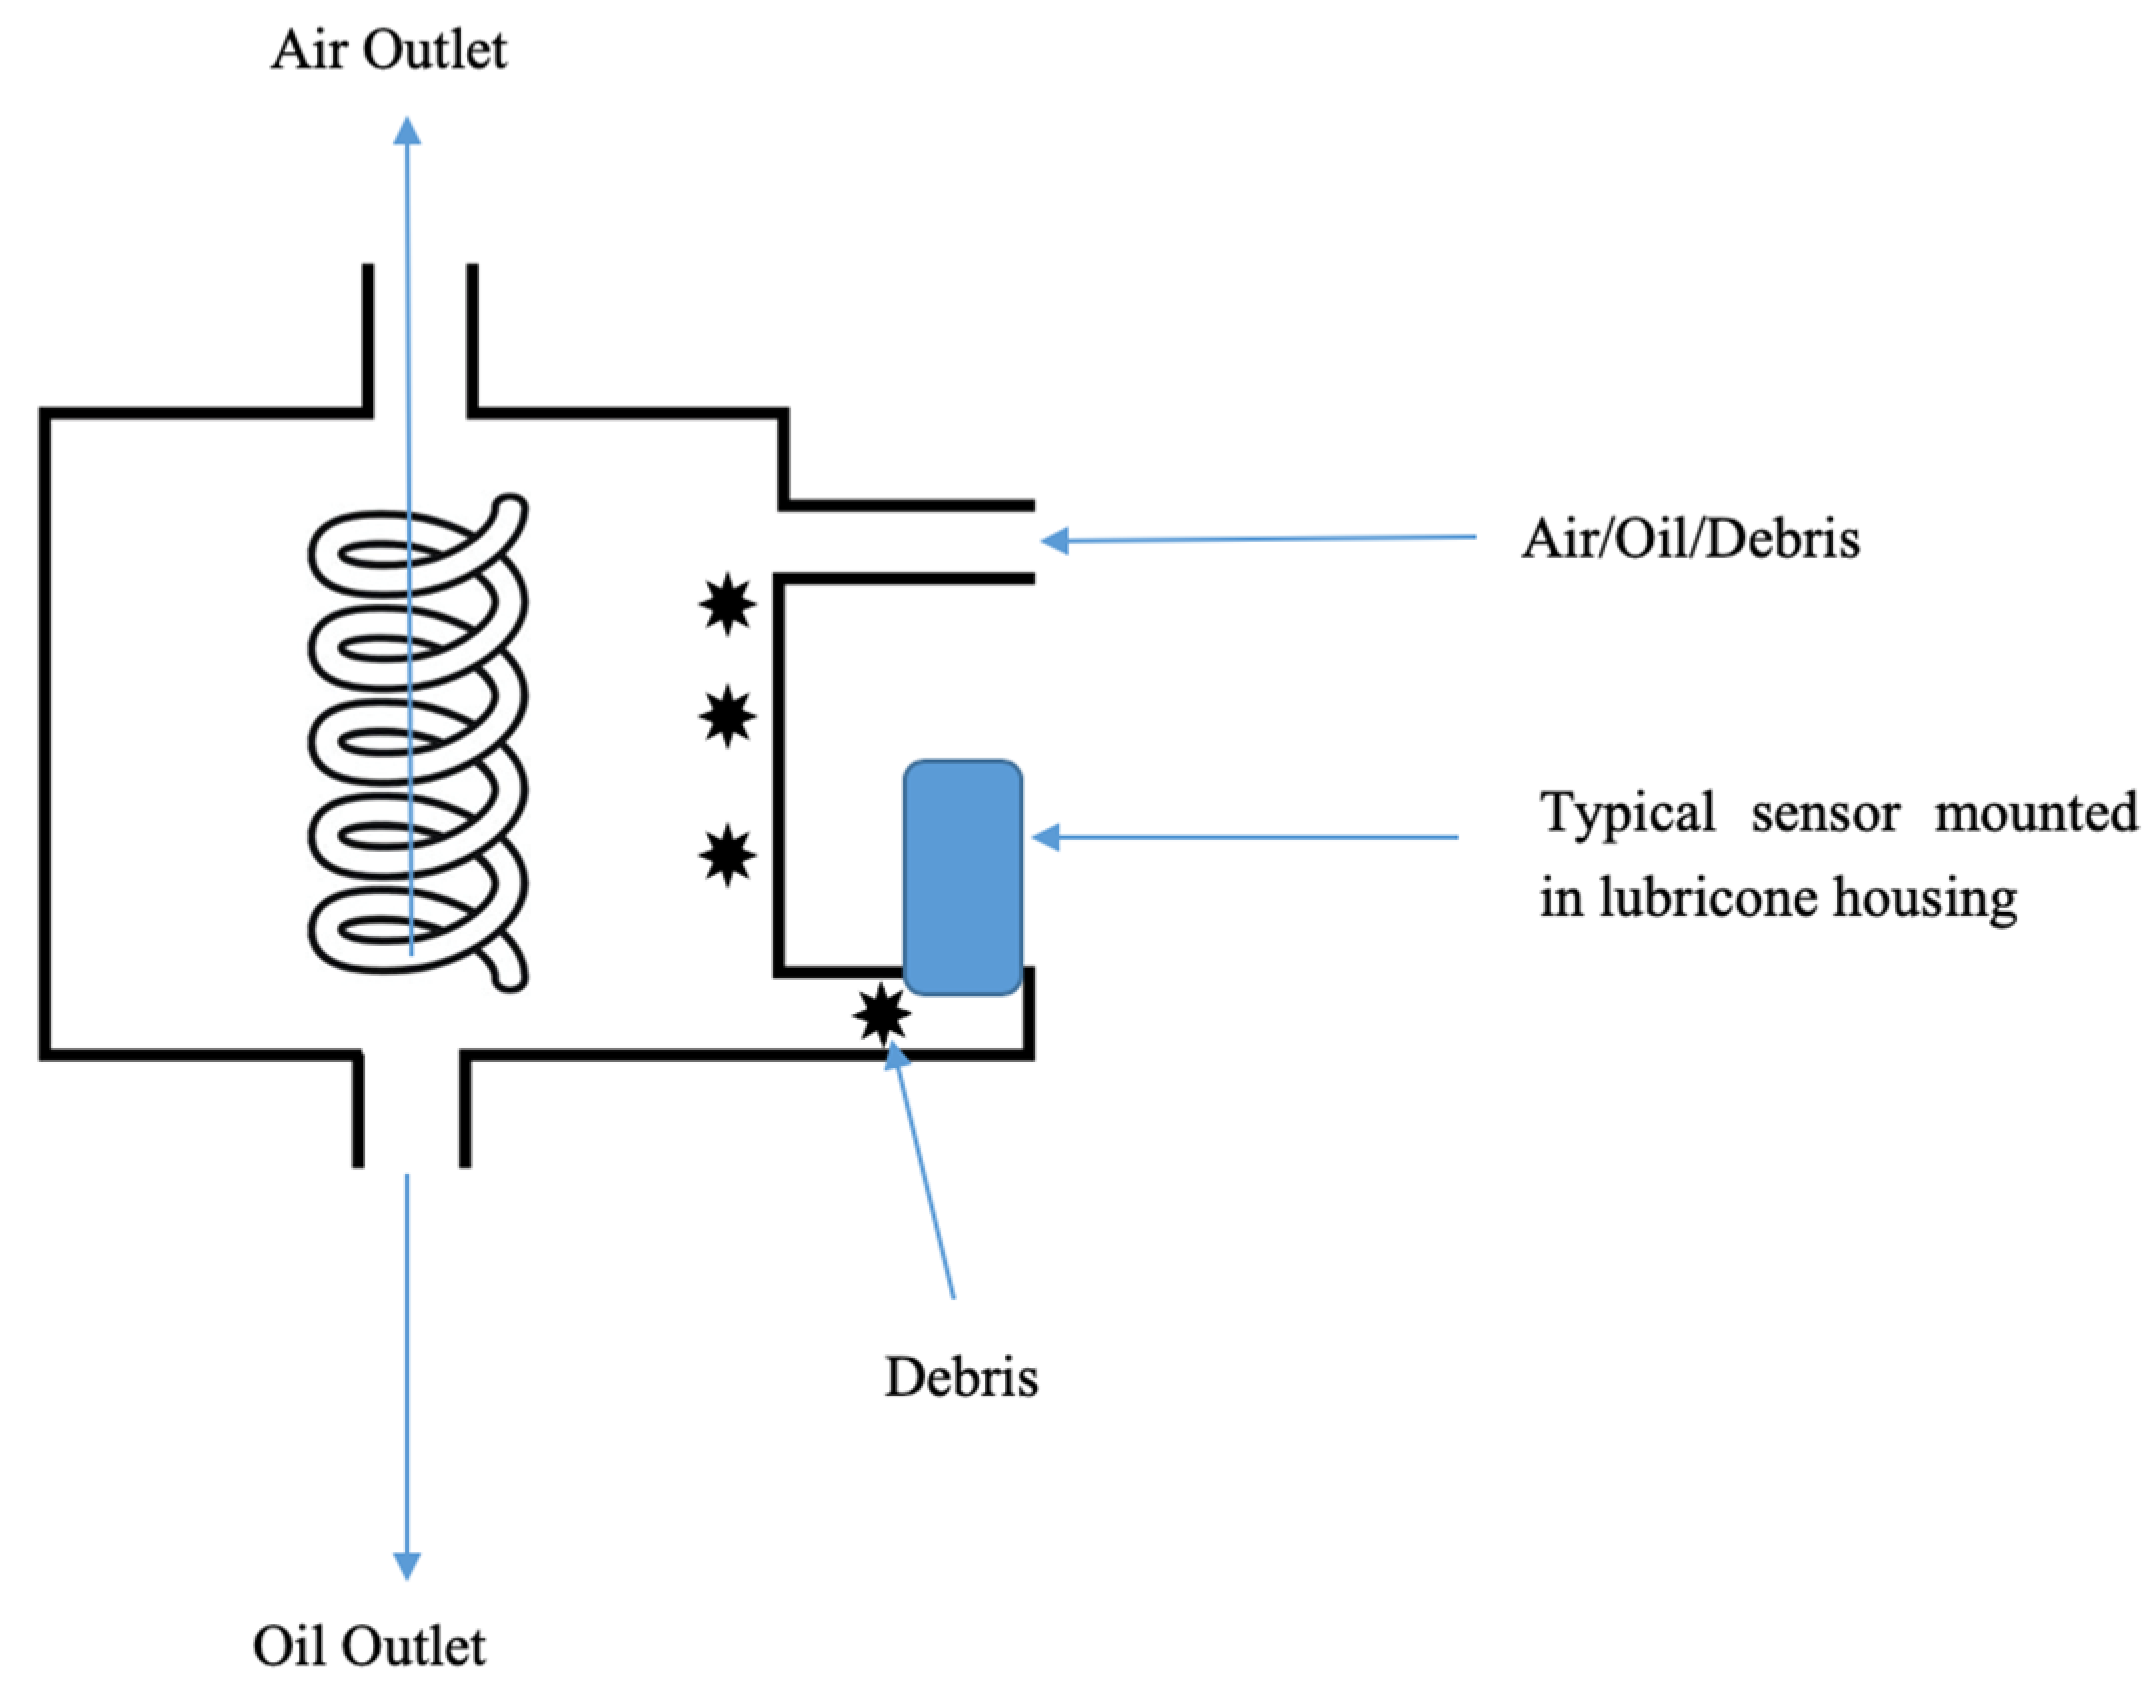
3.2. Quantitative Debris Monitoring (QDM) Sensor DMS
This sensor is set on the GE90 aircraft engine. The sensor [
6] is made of a magnet, an inductive coil and a test coil. The system is composed of a debris sensor, a vortex debris separator and an electronic module. The magnet captures the ferromagnetic particles; for each particle the inductive coil and electronic module provide an output signal. The magnet is permanent and catches the debris. To be effective the sensor is mounted on a vortex debris separator that is mounted on the oil reservoir. As seen in
Figure 3, the separator creates a vortex to separate the air, oil and debris. The particles reach the outer vortex and are collected by the debris channel, which guides them to the magnetic sensor.
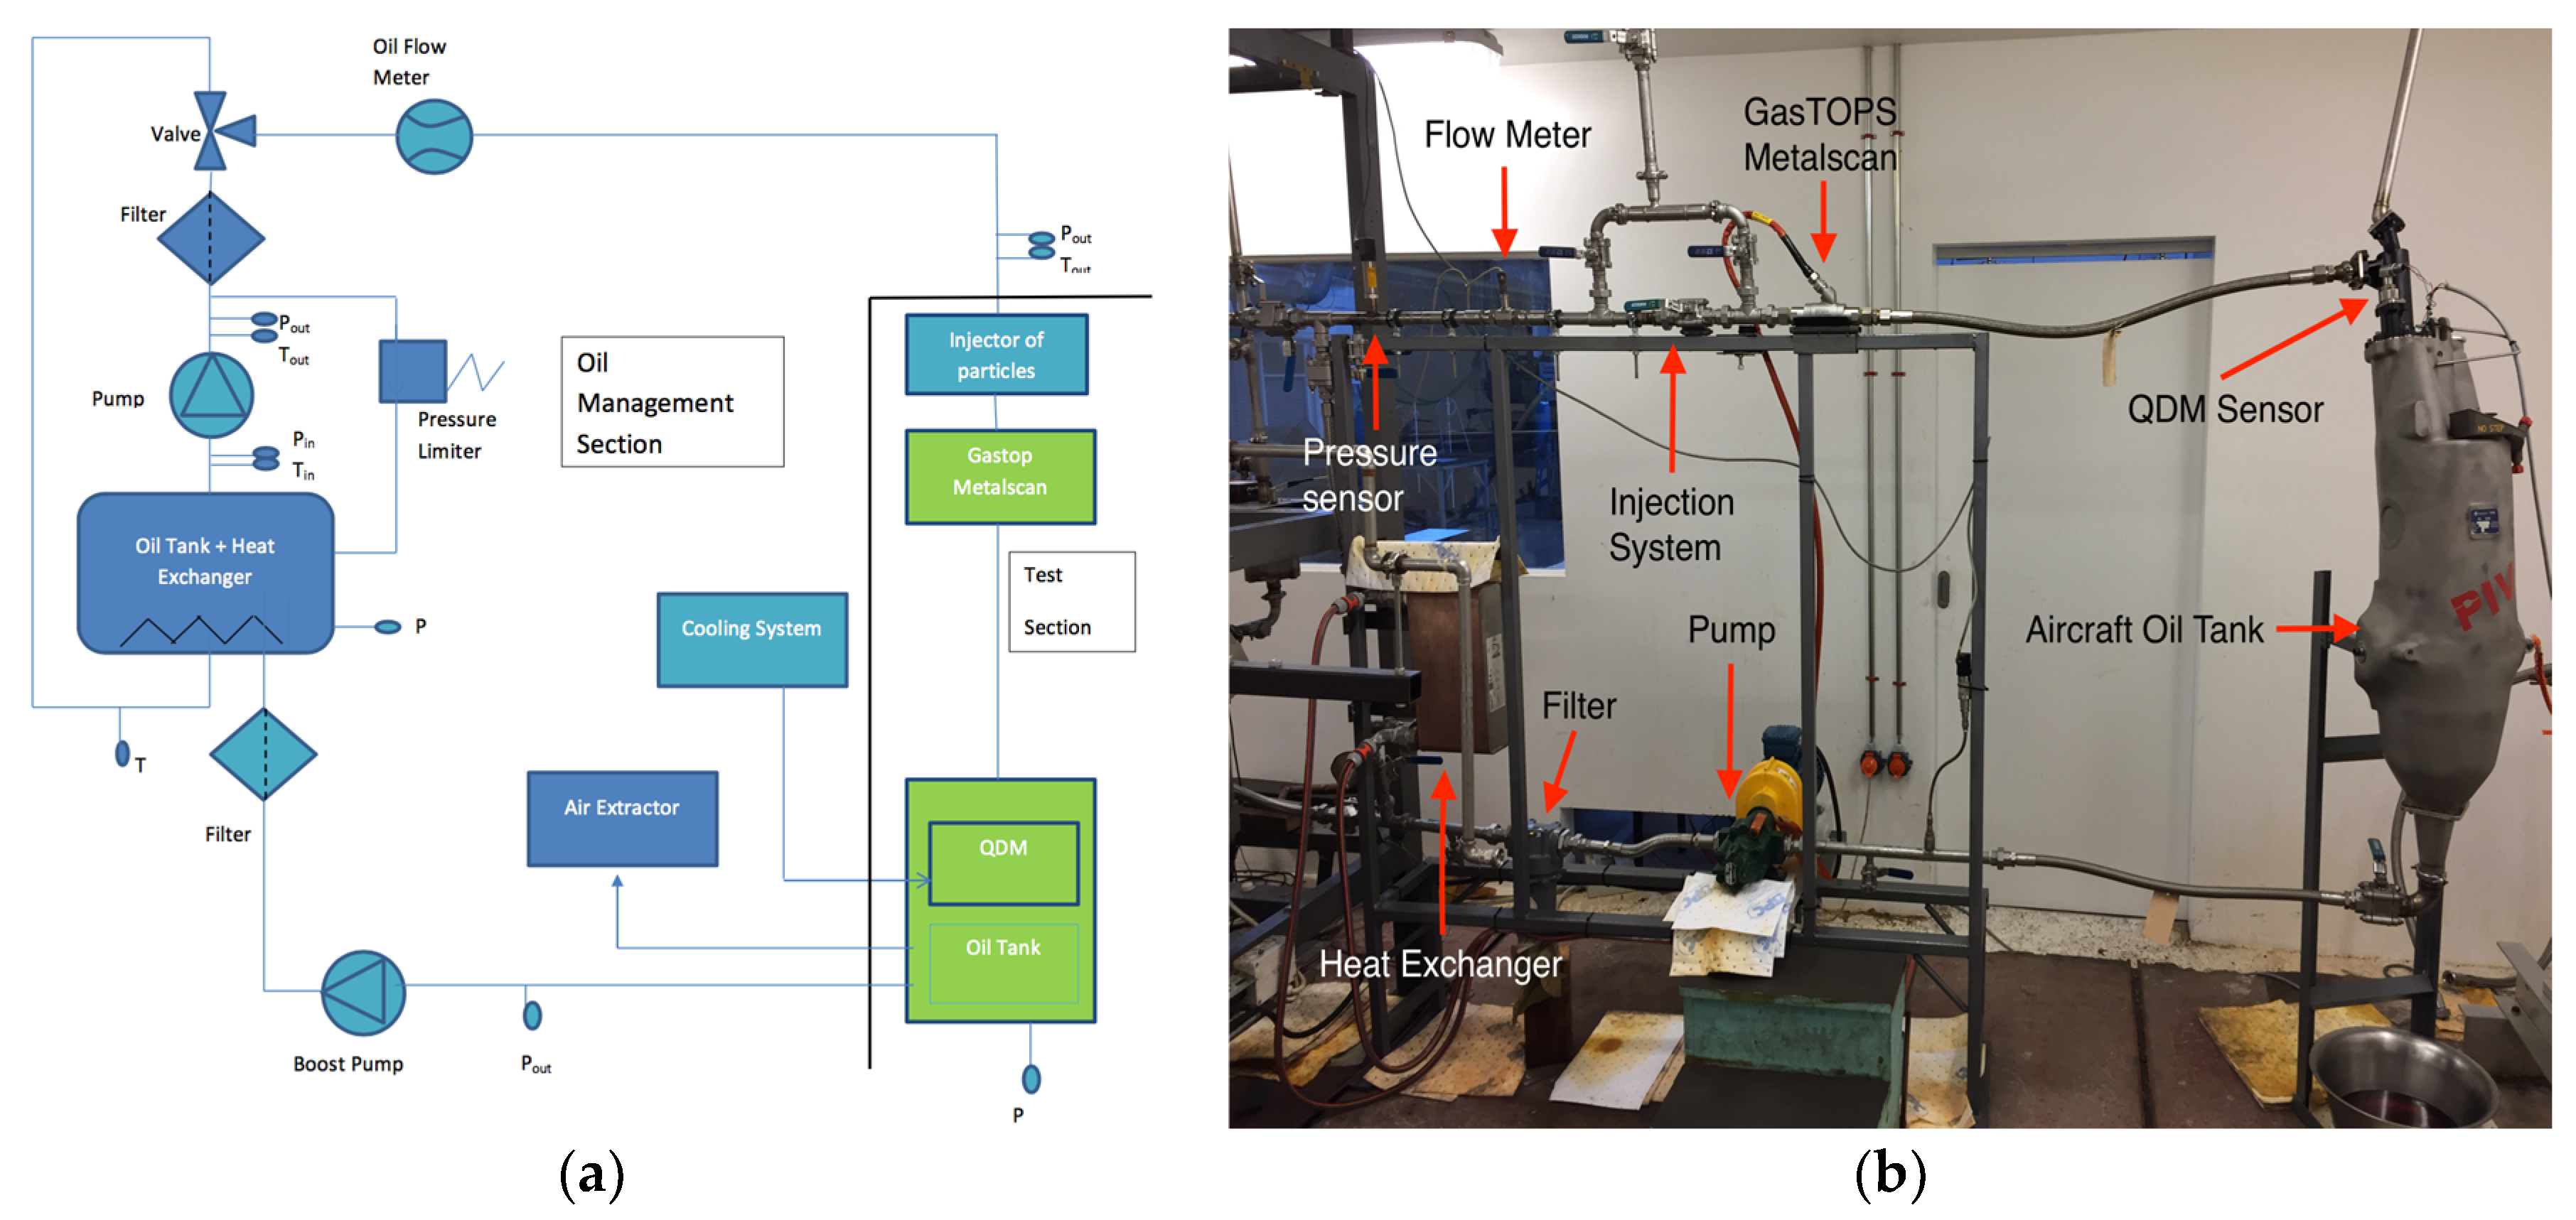
4. Test Setup
The test bench consists of two parts: an oil management section and a test section. The oil management section is dedicated to generating the oil pressure, temperature and flow. The oil flow varies between 0 to 4200 l/h and the oil temperature varies from 20 °C to 130 °C. The oil is Mobile Jet oil II. The test section is dedicated to injecting the debris and integrating the debris sensors. This section is able to host an aircraft oil tank and an air extractor that should be able to extract the air from the oil tank. The two sections allow for the measurement of parameters like temperature and pressure. The acquisition and control of the bench is done by software.
Figure 4a shows the hydraulic circuit designed with the different components, a main oil tank with a heat exchanger that heats the oil up to the desired temperature. One finds two oil pumps, two filters, one flow meter, and temperature and pressure sensors. In the test section one finds the injector of particles in the oil circuit, the GasTOPS Metalscan sensors and finally the QDM sensor mounted on the aircraft oil tank.
Figure 4b is a picture of a part of the hydraulic circuit; the test section can be seen on the right side of the picture.
5. Experiments and Results
The GasTOPS sensor, described before, categorizes the particles by size, type and mass. It also counts the total debris detected and estimates the total mass. The sensor can only detect particles whose size is between 250 and 1000 μm. The QDM sensor from Eaton only counts the amount of debris detected, and its magnet catches the debris. The sensor does not give any information about the size or mass of the debris detected. The sensor only detects debris whose size lies between 400 and 600 μm.
5.1. Experimental Method
The oil is heated to the desired temperature and the mass flow rate is regulated with the rotational speed of the two pumps. The oil used is Mobile Jet Oil II, an oil of type II [
7]. The mass and type of particle to inject are prepared. The particles are injected with a special injector in the oil circuit. The results are obtained on the computer. The QDM is removed from the separator to collect all the particles caught.
5.2. Tests and Values
Three sizes and two types of particles were tested, and three types of tests were done. They are described in
Table 1. For each test condition, each type of test was repeated 10 times. Different test conditions are described in
Table 2. The flow rate and temperature of the oil were kept constant, as was the mass injected; only the type and size of debris were changed between the tests.
Table 3 gives the test results for each test package. The first two results are the total mass detected and the total number of particles counted by the sensor GasTOPS. The last two are the total mass caught and the total number of particles counted by the sensor QDM. The GasTOPS sensor categorizes the debris detected into five different sizes (250, 400, 600, 800 and 1000 μm).
5.2.1. Test Package 1—Iron 850–1180 μm
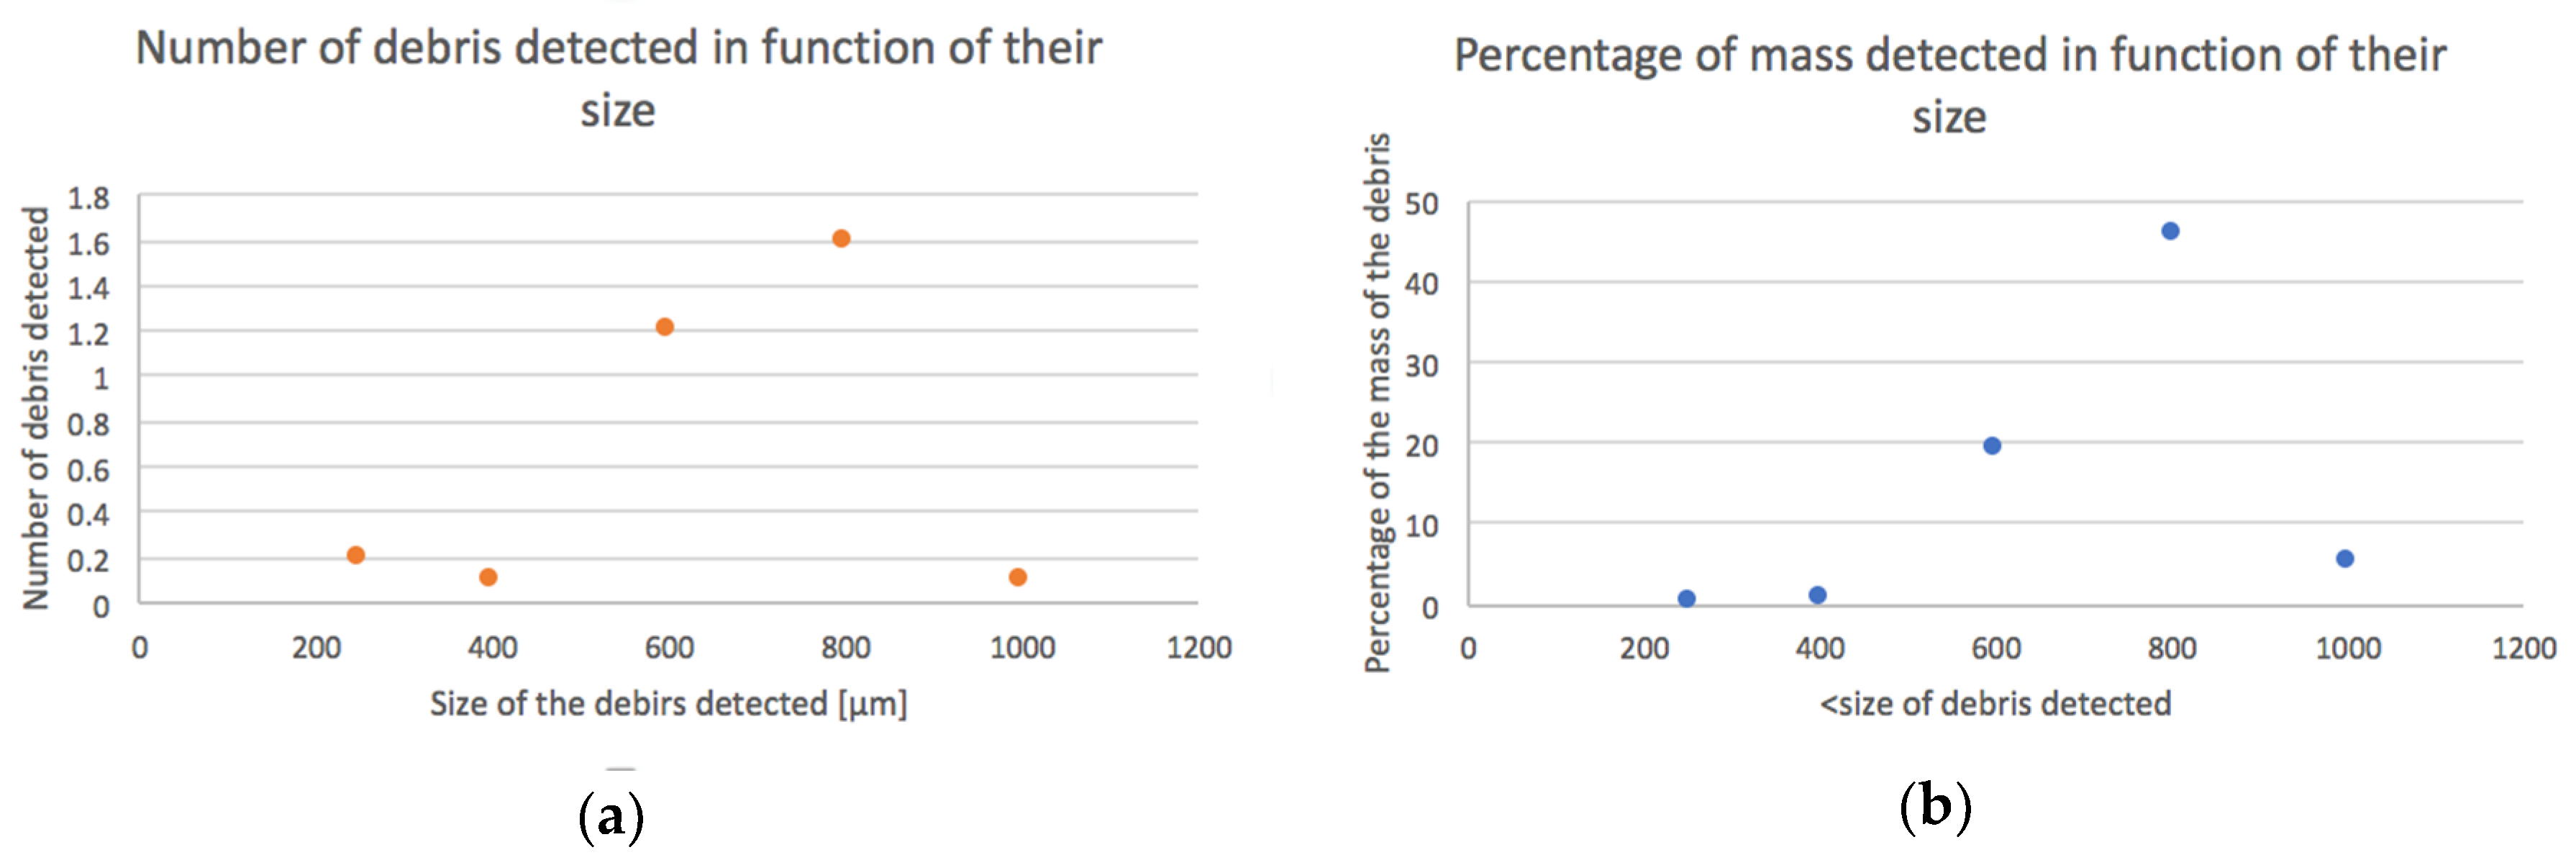
The results of the first test package are presented in this section. The size of the chips injected lies between 850 to 1180 μm. It can be seen in
Figure 5 that debris of 200, 400 and 1000 μm were detected each only once during the 10 tests. In six tests out of 10, particles of 600 μm have been detected. Most of the debris detected was categorized as 800 μm particles.
5.2.2. Test Package 2—Iron 425–600 μm
The results of the second test package are presented in this section. The size of the chips injected was between 425 to 600 μm.
Figure 6 shows that no debris of 800 and 1000 μm and only 0.7 mg of debris with a size of 250 μm was detected. Those results are logical because the size of the debris injected is smaller. One can say that the GasTOPS sensor detects the right range of particle size. In terms of amount, debris of 400 μm was detected more than debris of 600 μm. The results presented in this section and in
Table 3 demonstrate that the two sensors are in accordance with their respective range of detection of the debris specified by the manufacturer of the sensors.
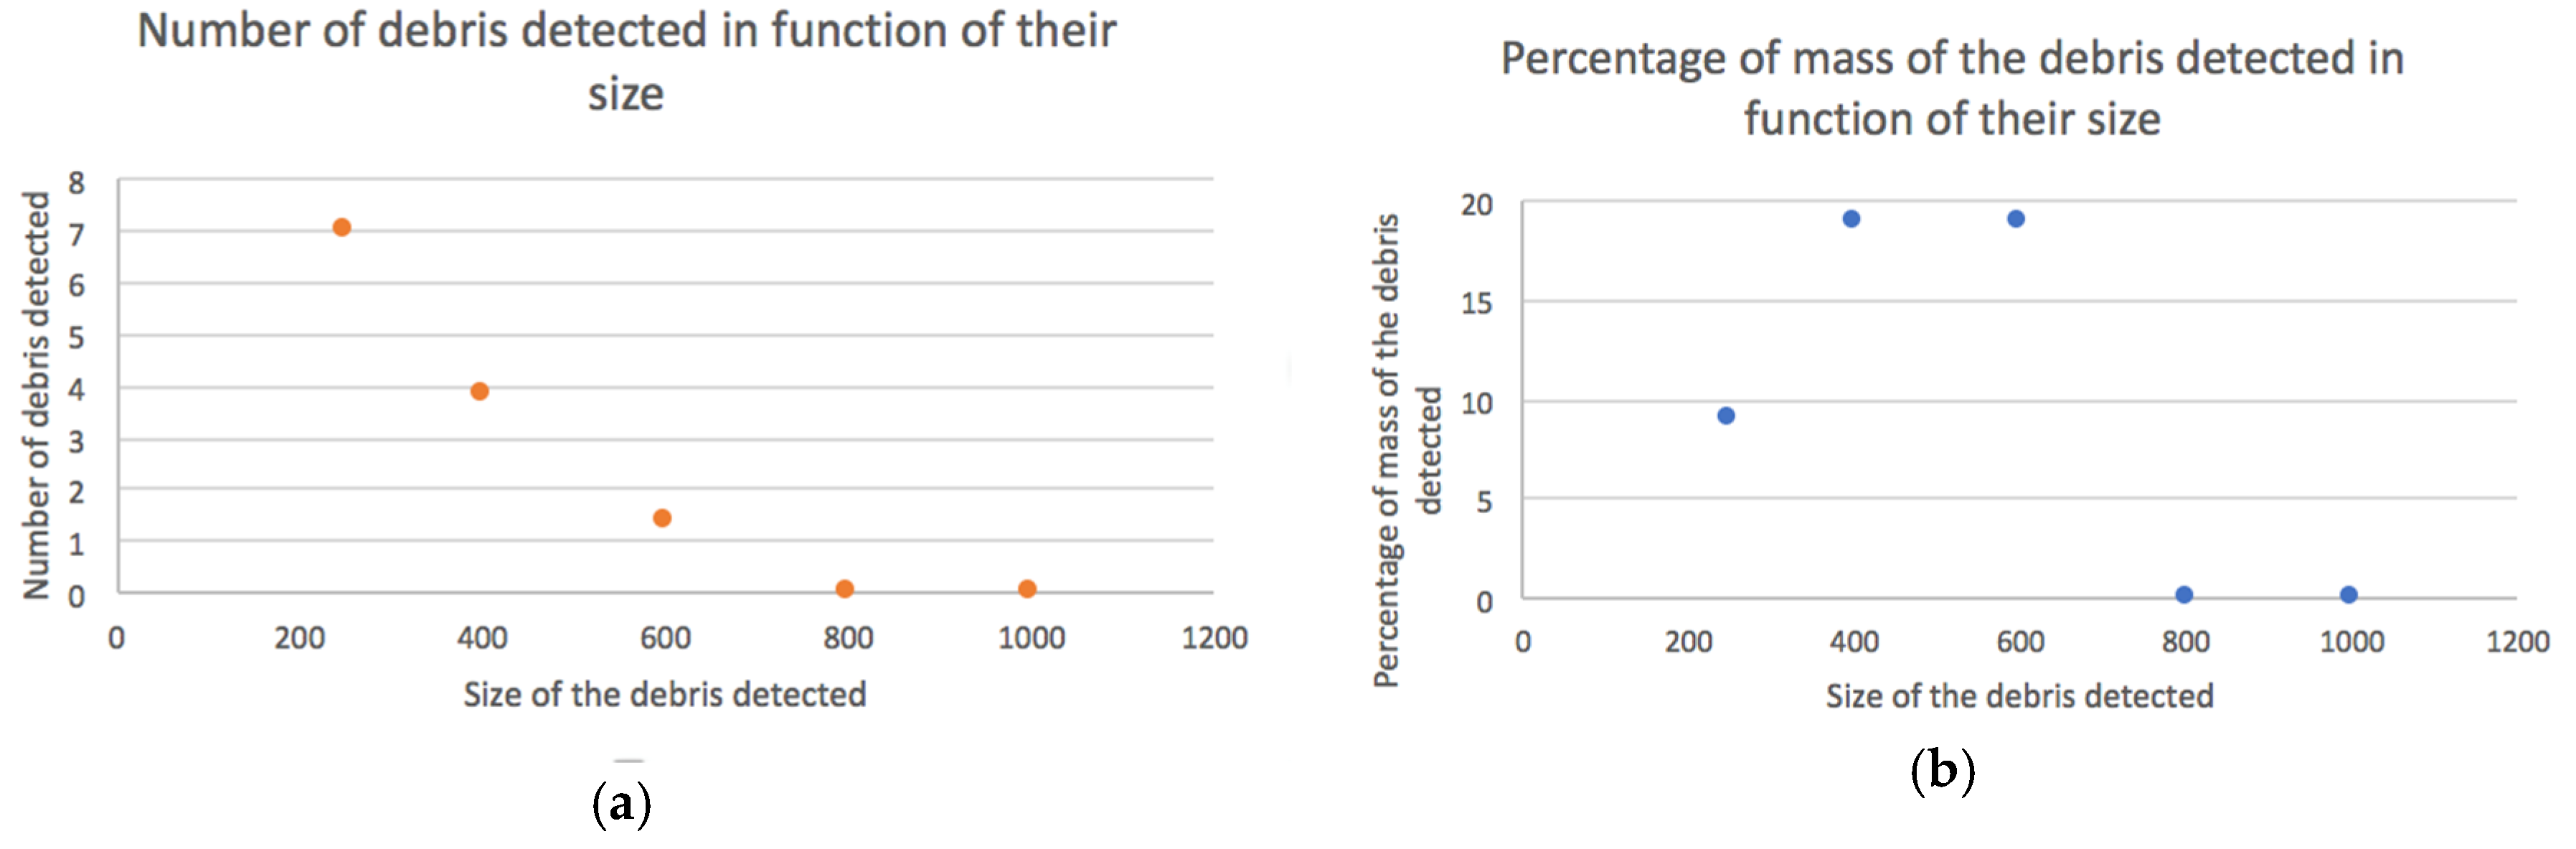
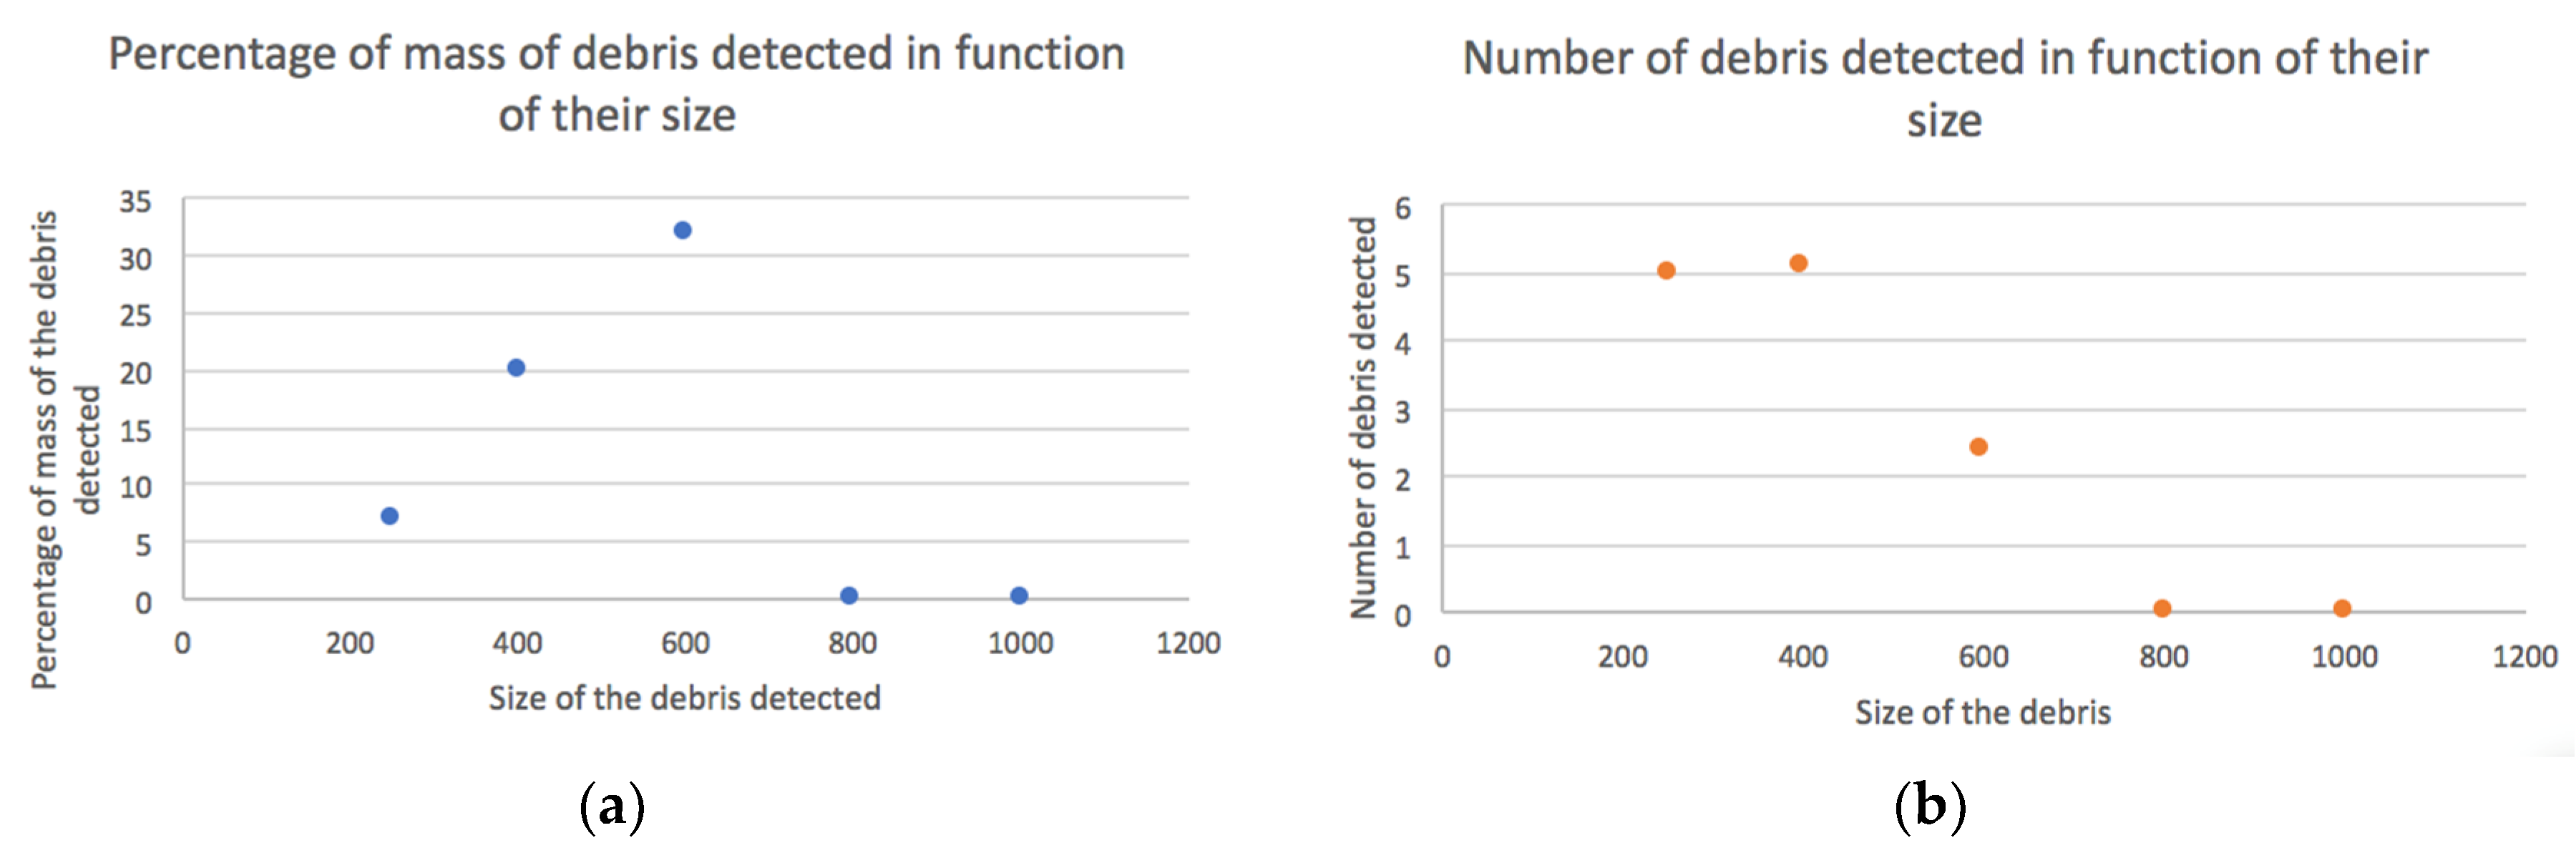
5.2.3. Test Package 3—Iron 150–500 μm
The results of the third test package are presented in this section. The size of the chips injected was between 150 to 500 μm. As can be seen in
Figure 7, no particles of 800 and 1000 μm were detected, but some particles of 600 μm, about 20% of the mass, were detected despite the particles injected being smaller. In terms of amount, debris of 250 μm was detected the most, but in terms of mass, particles of 400 μm were detected the most. According to
Table 3, QDM only counts half of the debris.
6. Conclusions
This paper presented tests on two debris monitoring sensors, GasTOPS and QDM. An oil test bench was built in order to test them in the same conditions as in an aircraft engine. Debris is injected in the oil, and GasTOPS determines the size and mass and counts the debris. The QDM counts but also catches the debris. The two sensors exhibit similar behaviour for debris with a size of 425–600 μm or 800–1180 μm. For those ranges, on average 63–70% of the mass of debris injected is detected by the GasTOPS sensor, and the QDM catches 60–66% of the mass injected. Small debris whose size lies outside the range of the two sensors was not detected by the two sensors. This confirms that the sensors only detect the particles for which they were designed. The oil test bench is assembled, and the injection, detection, and capture of debris by the sensor are operational. Some improvements can still be made to the test bench to improve the injection of debris and test the sensors with better repeatability. To develop a sensor with a wide range of detection complicates its implementation and specifically its integration in the oil and electrical circuit of the aircraft engine.


