Single-Component Hybrid Simulation Techniques for Validation of Fatigue Models †

Abstract
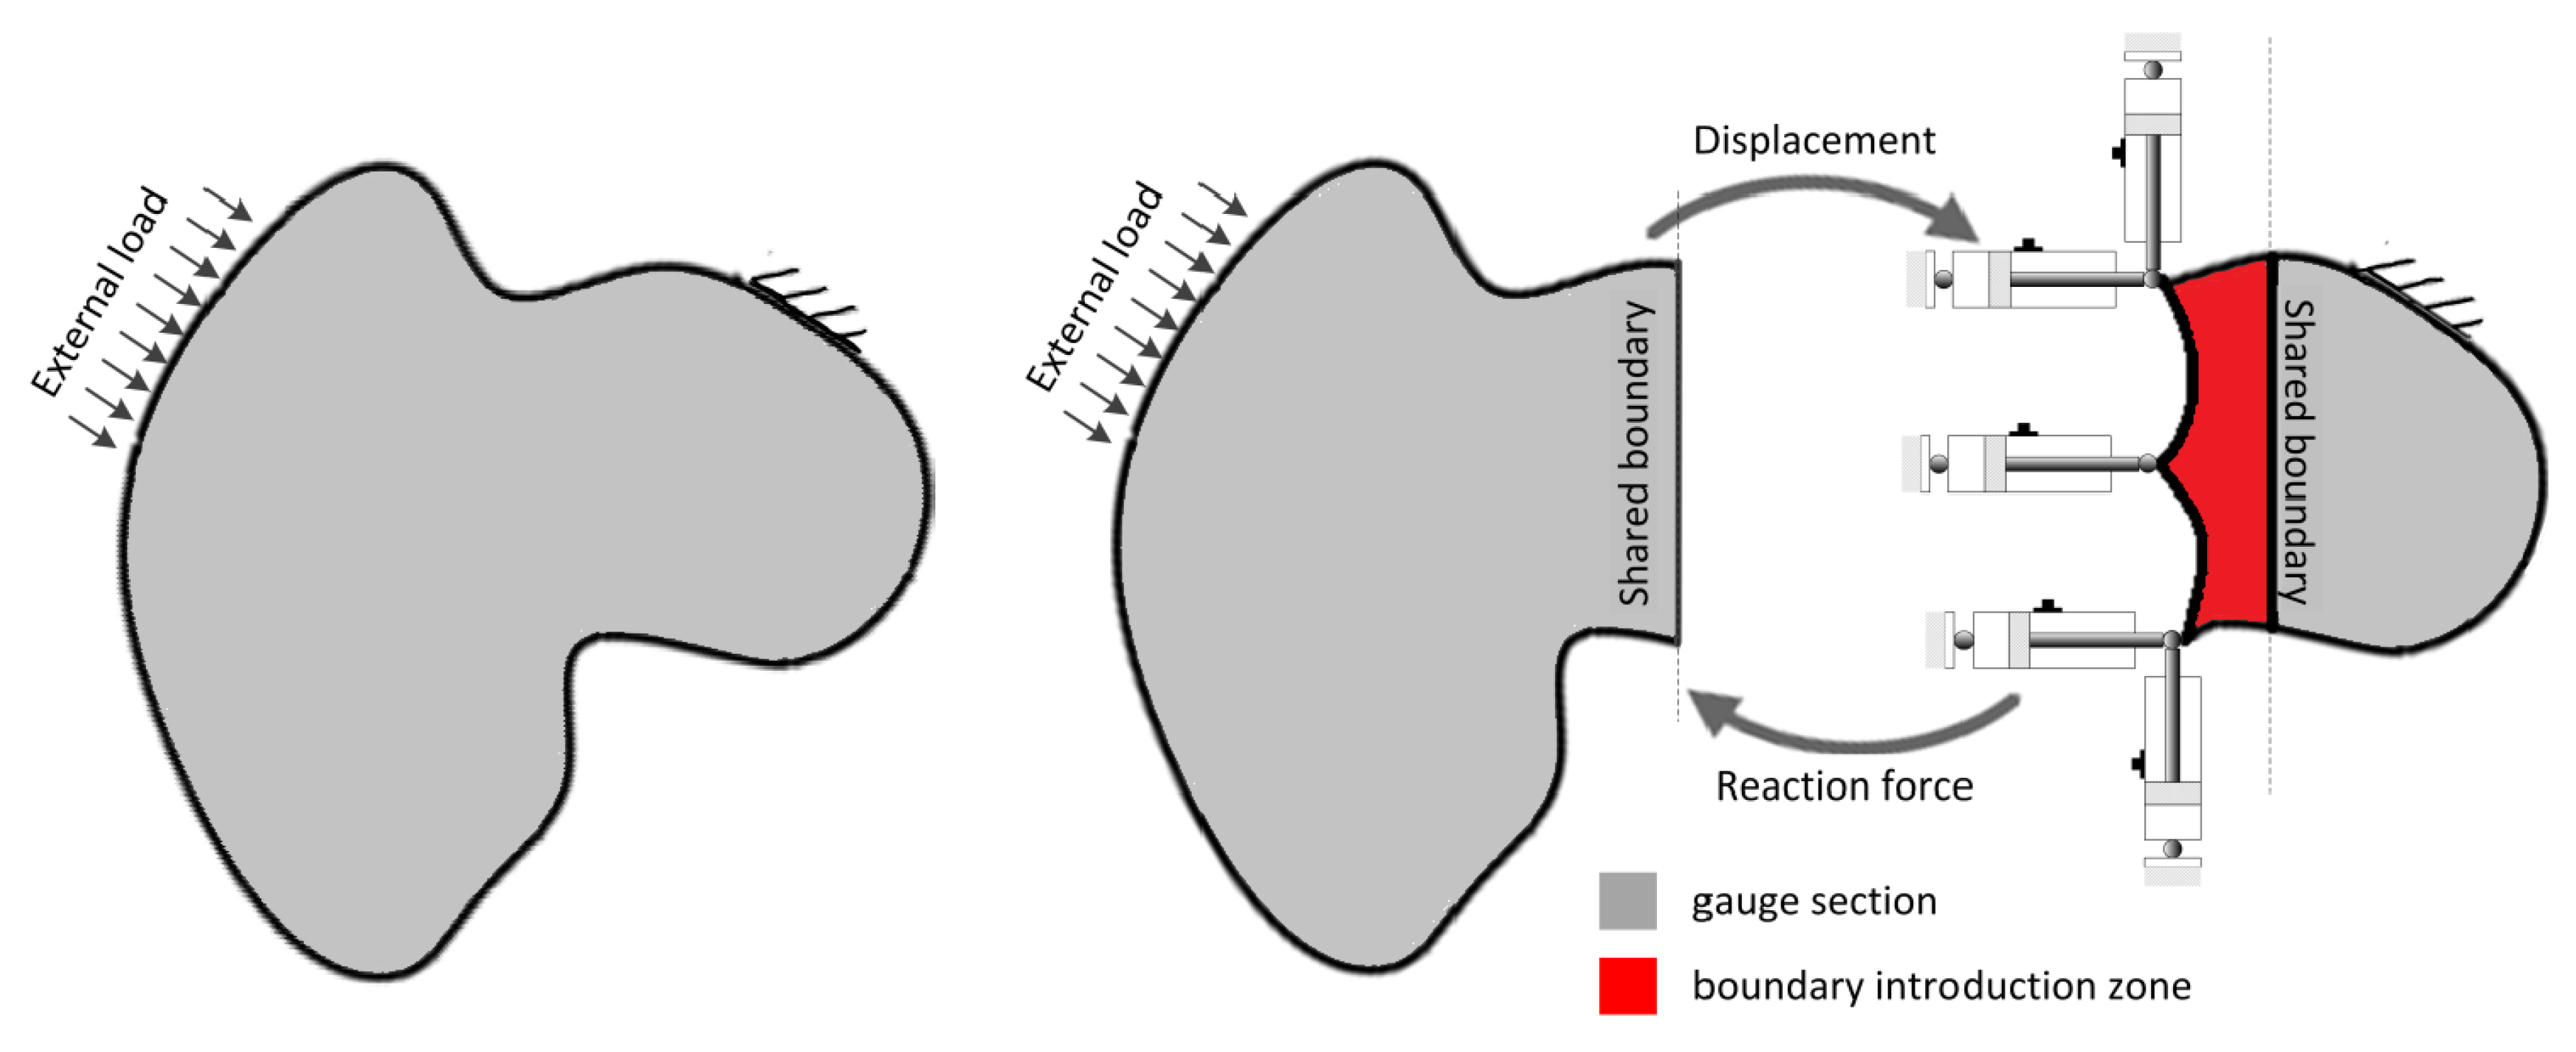
:1. Introduction
2. Methods
2.1. DTU Hybrid Simulation Test Rig
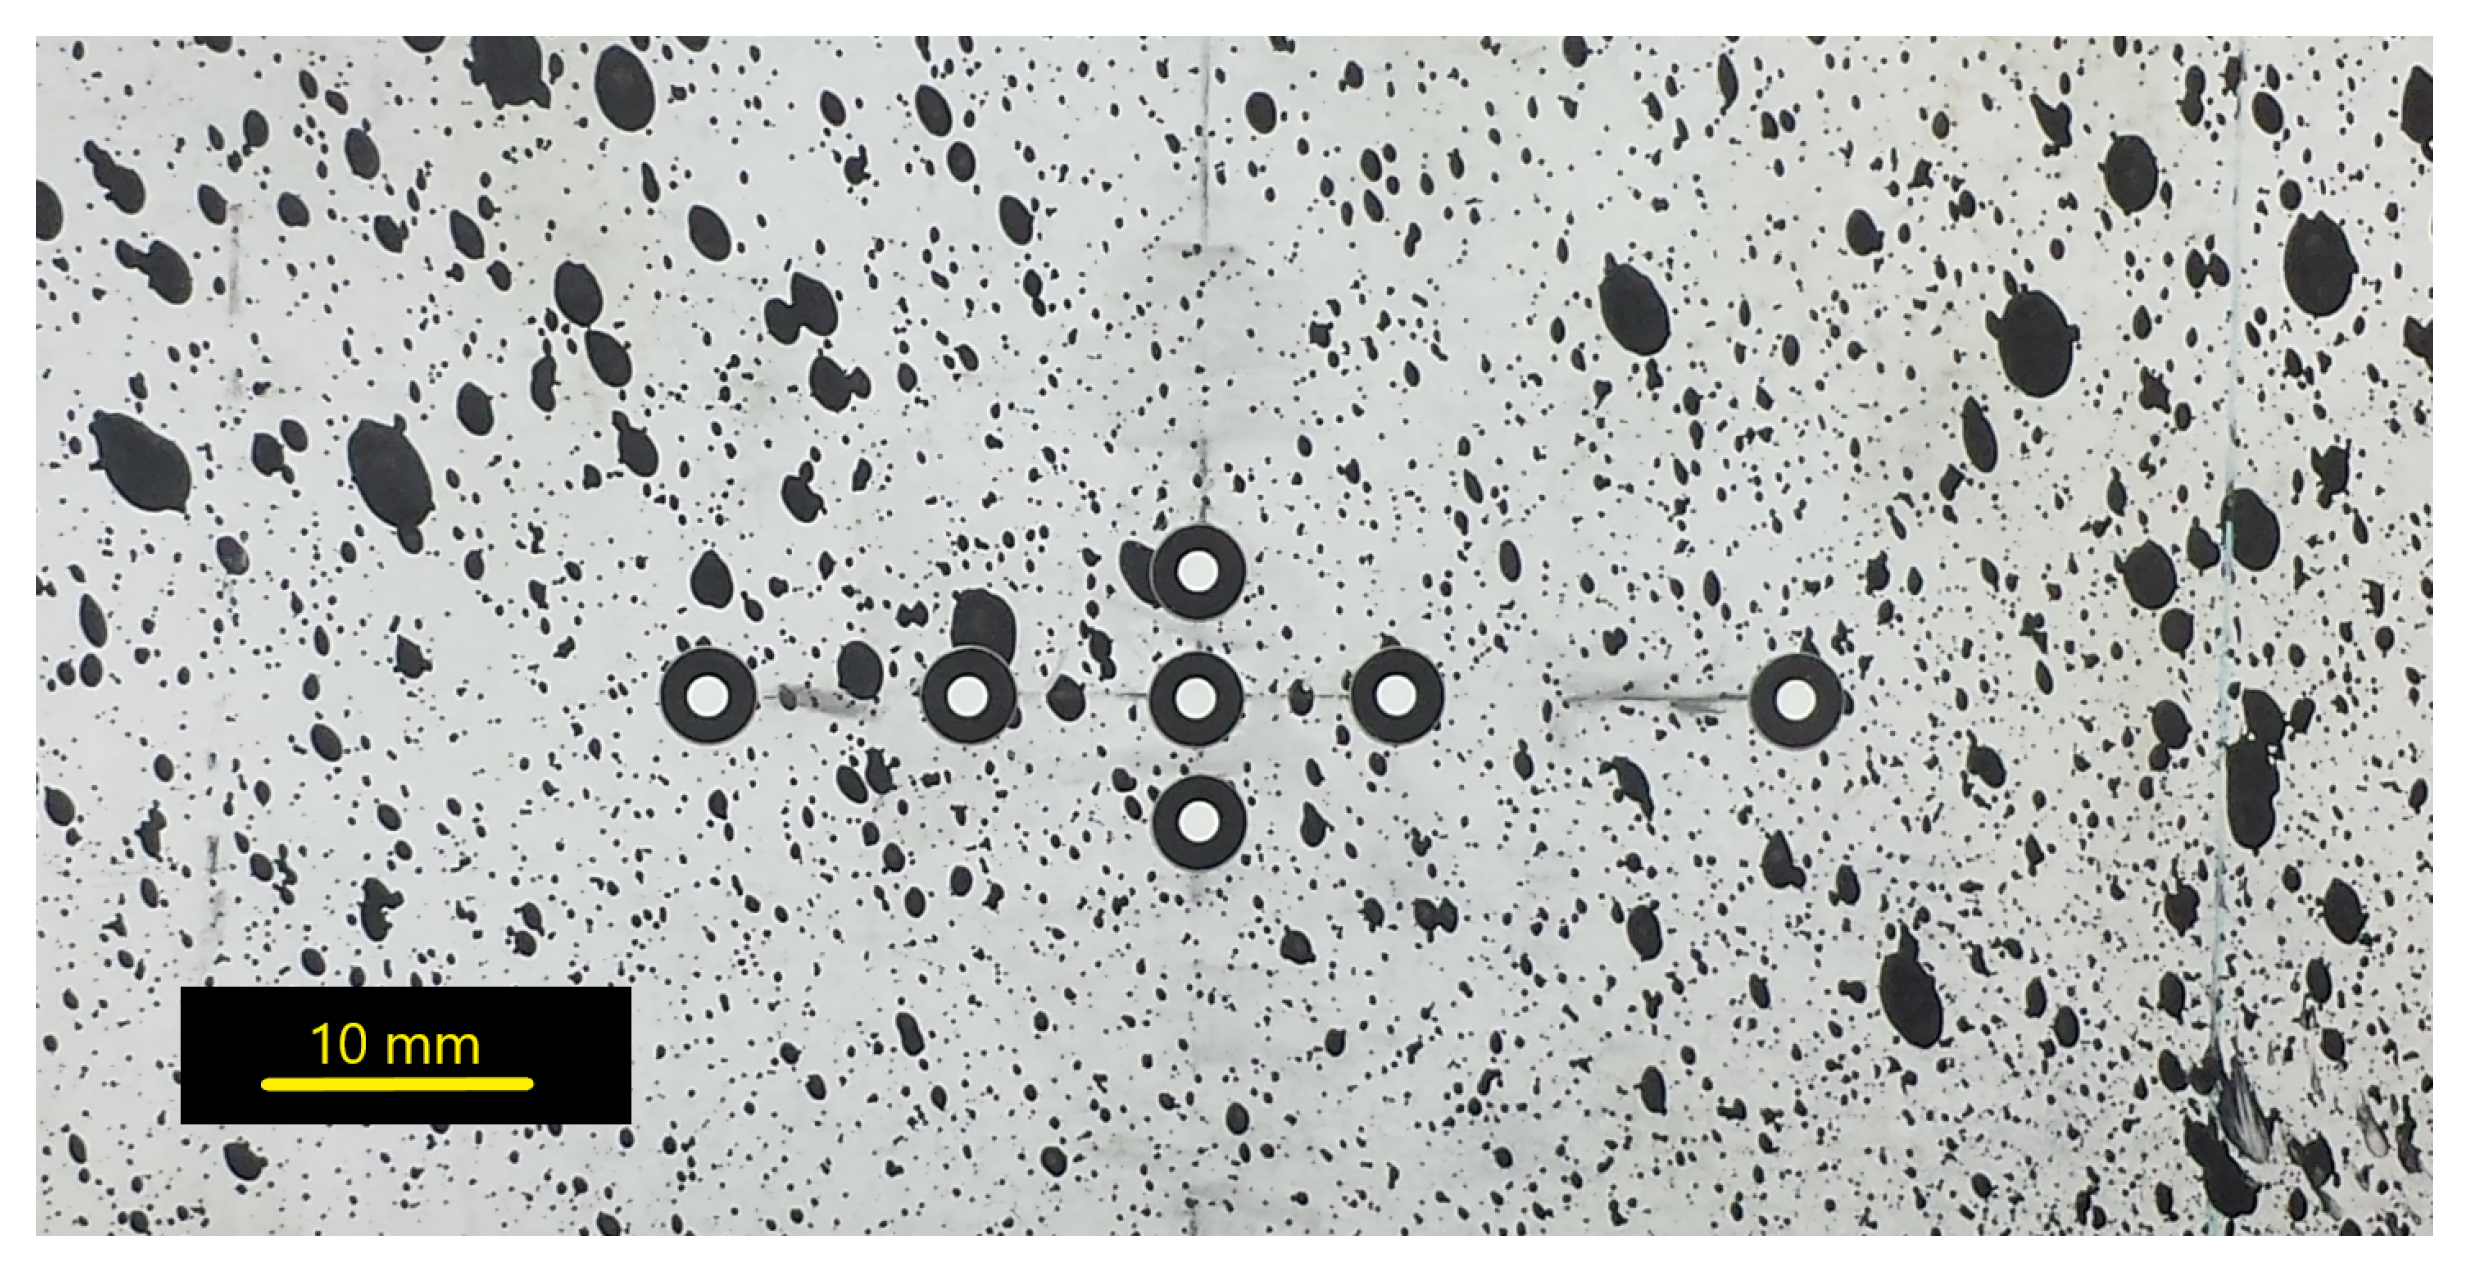
2.2. DIC System Set-Up
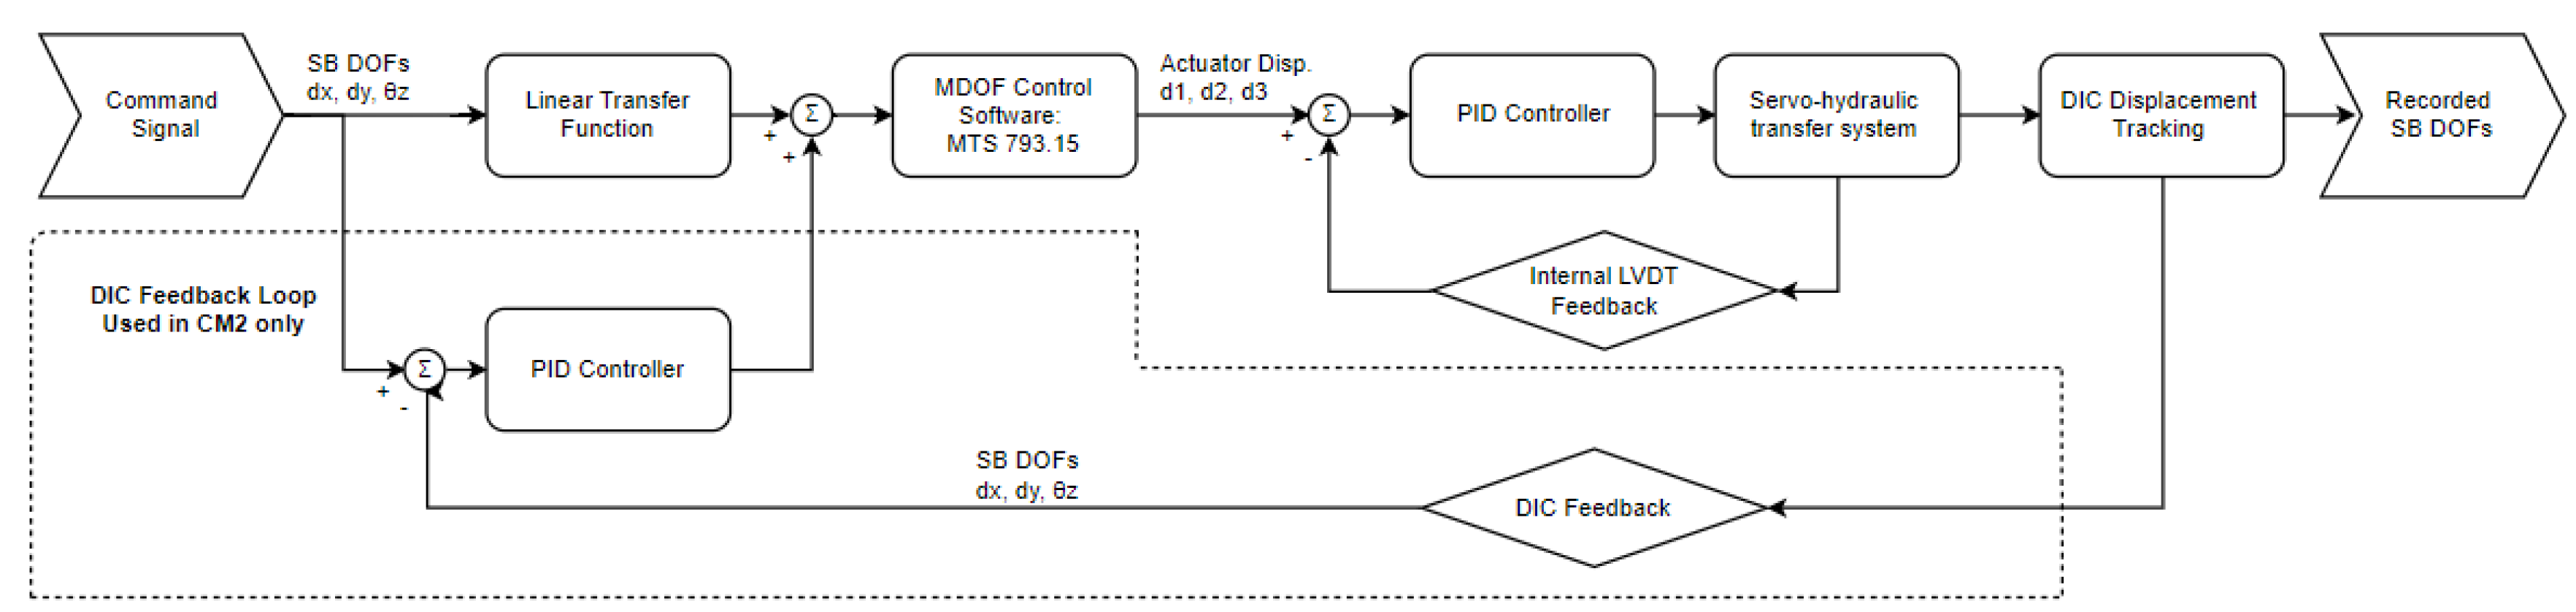
2.3. Measuring Experimental System Response
2.4. Cyclic Loading Tests
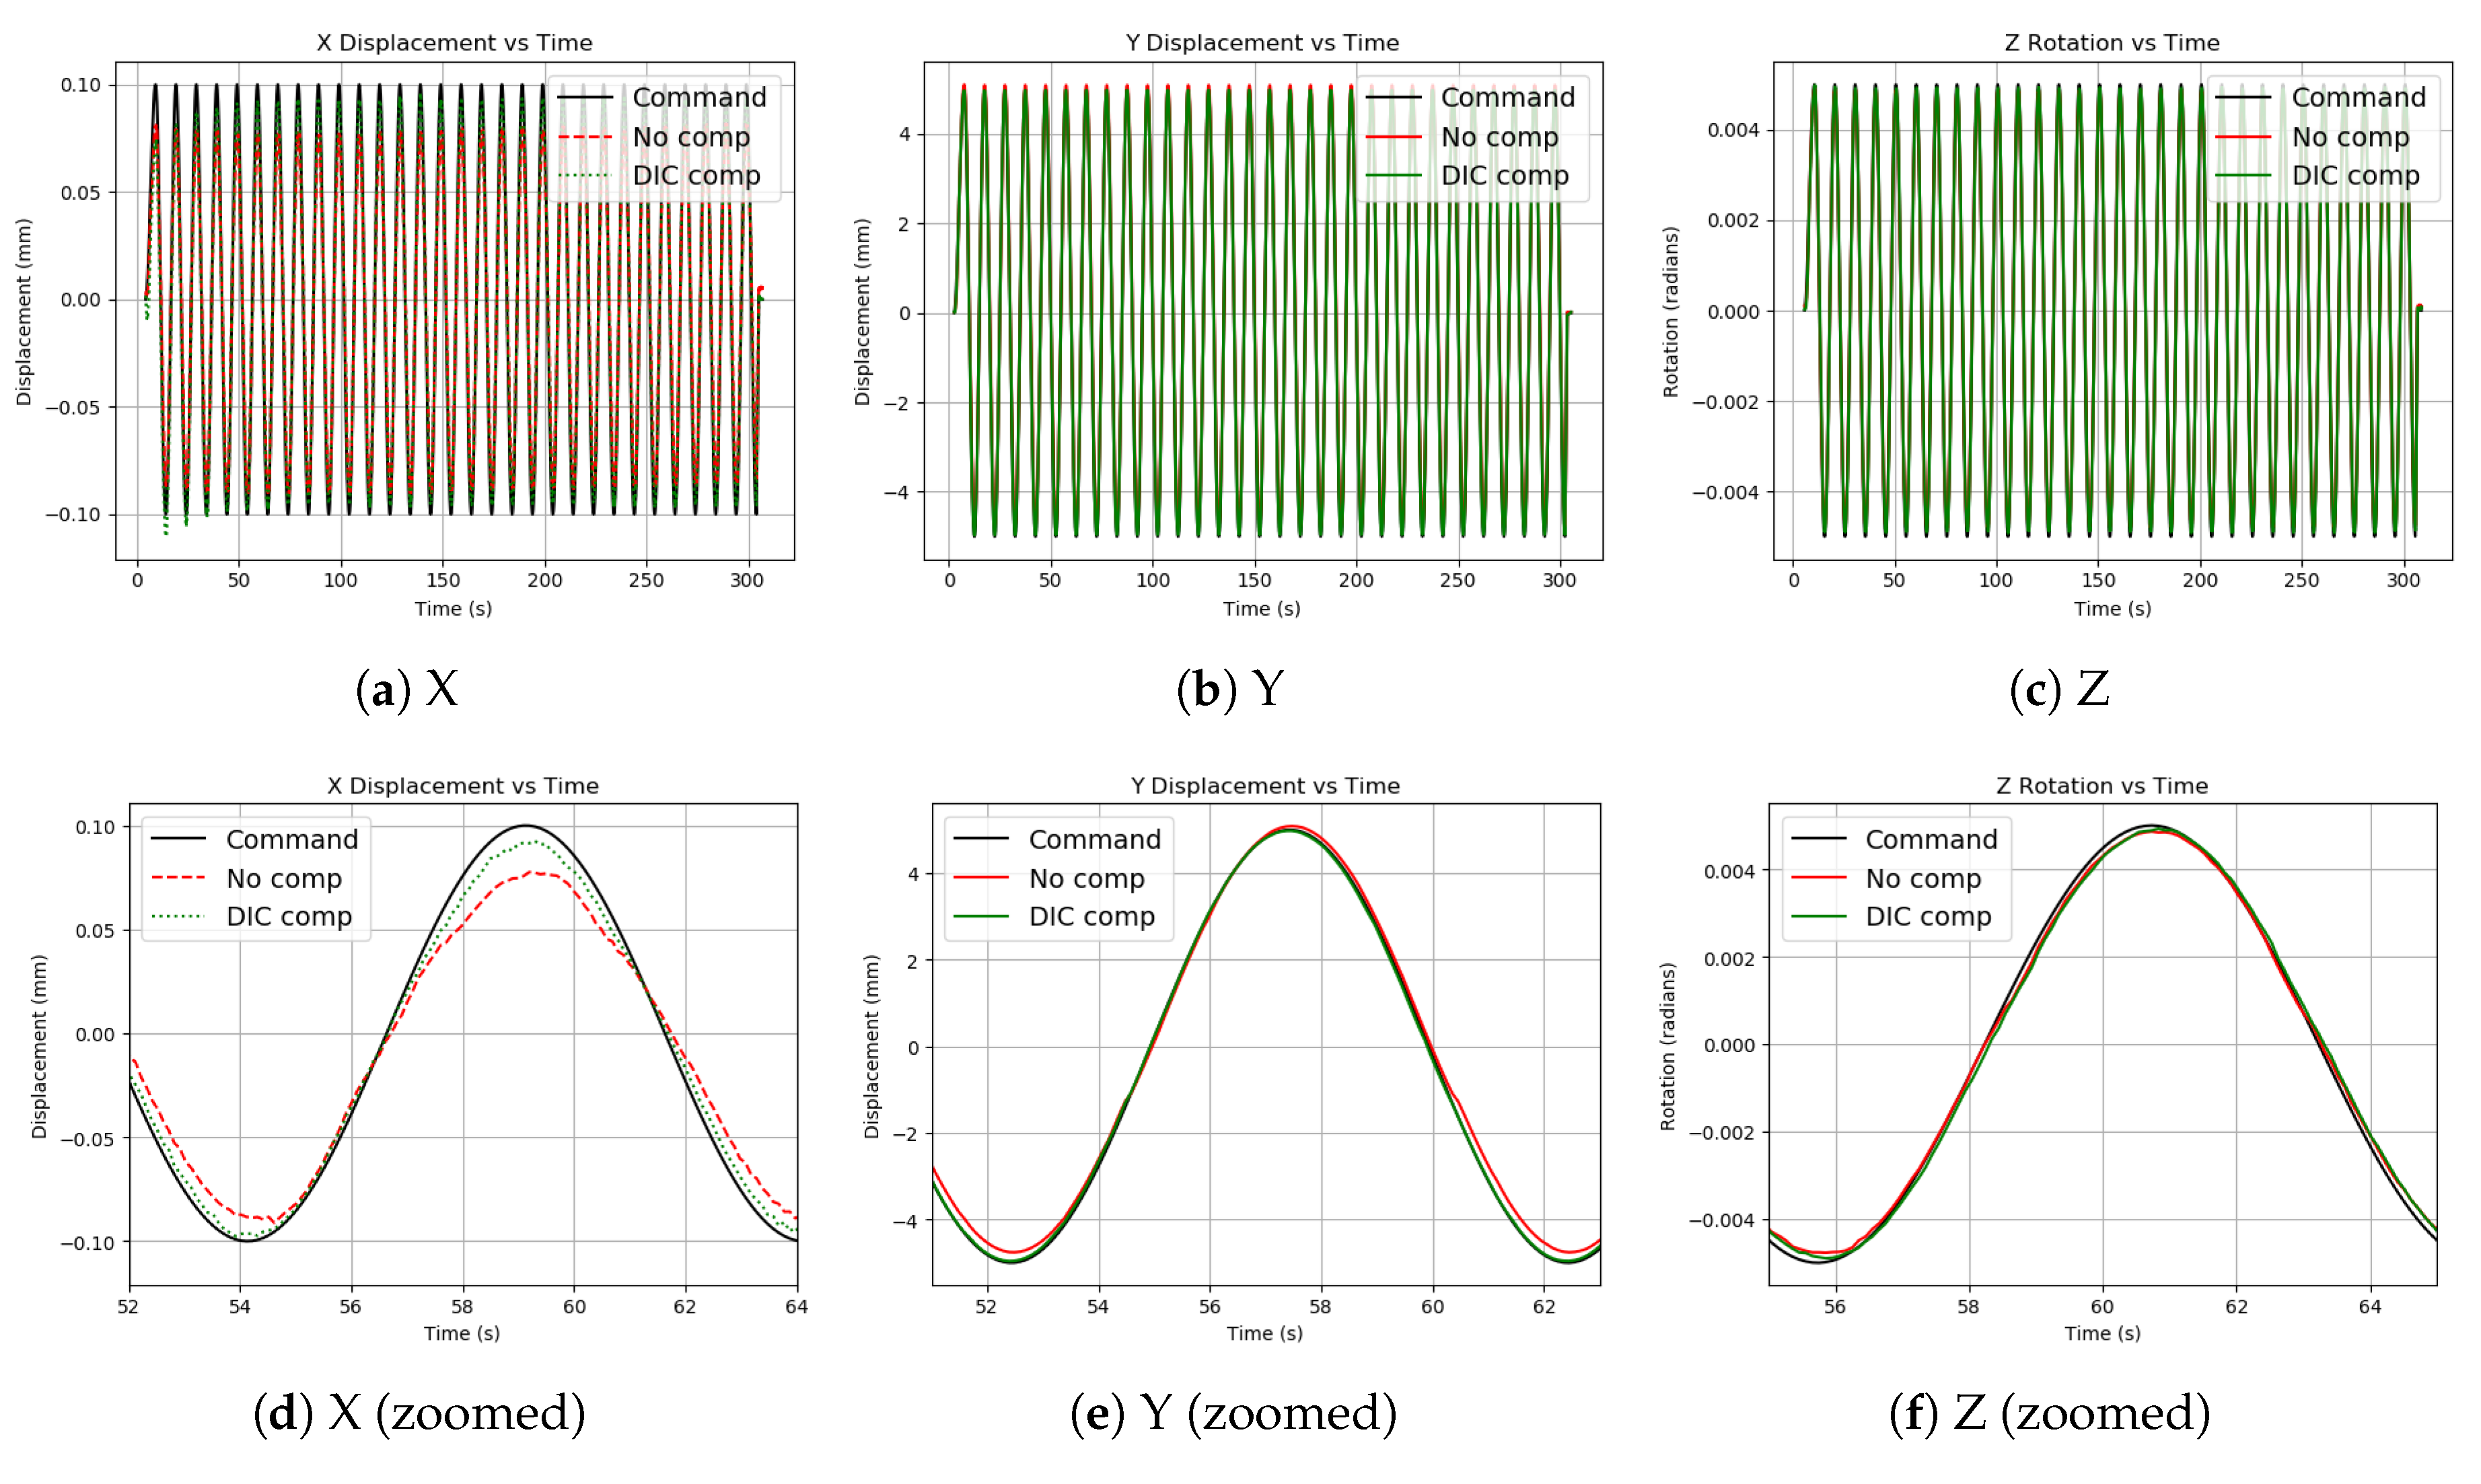
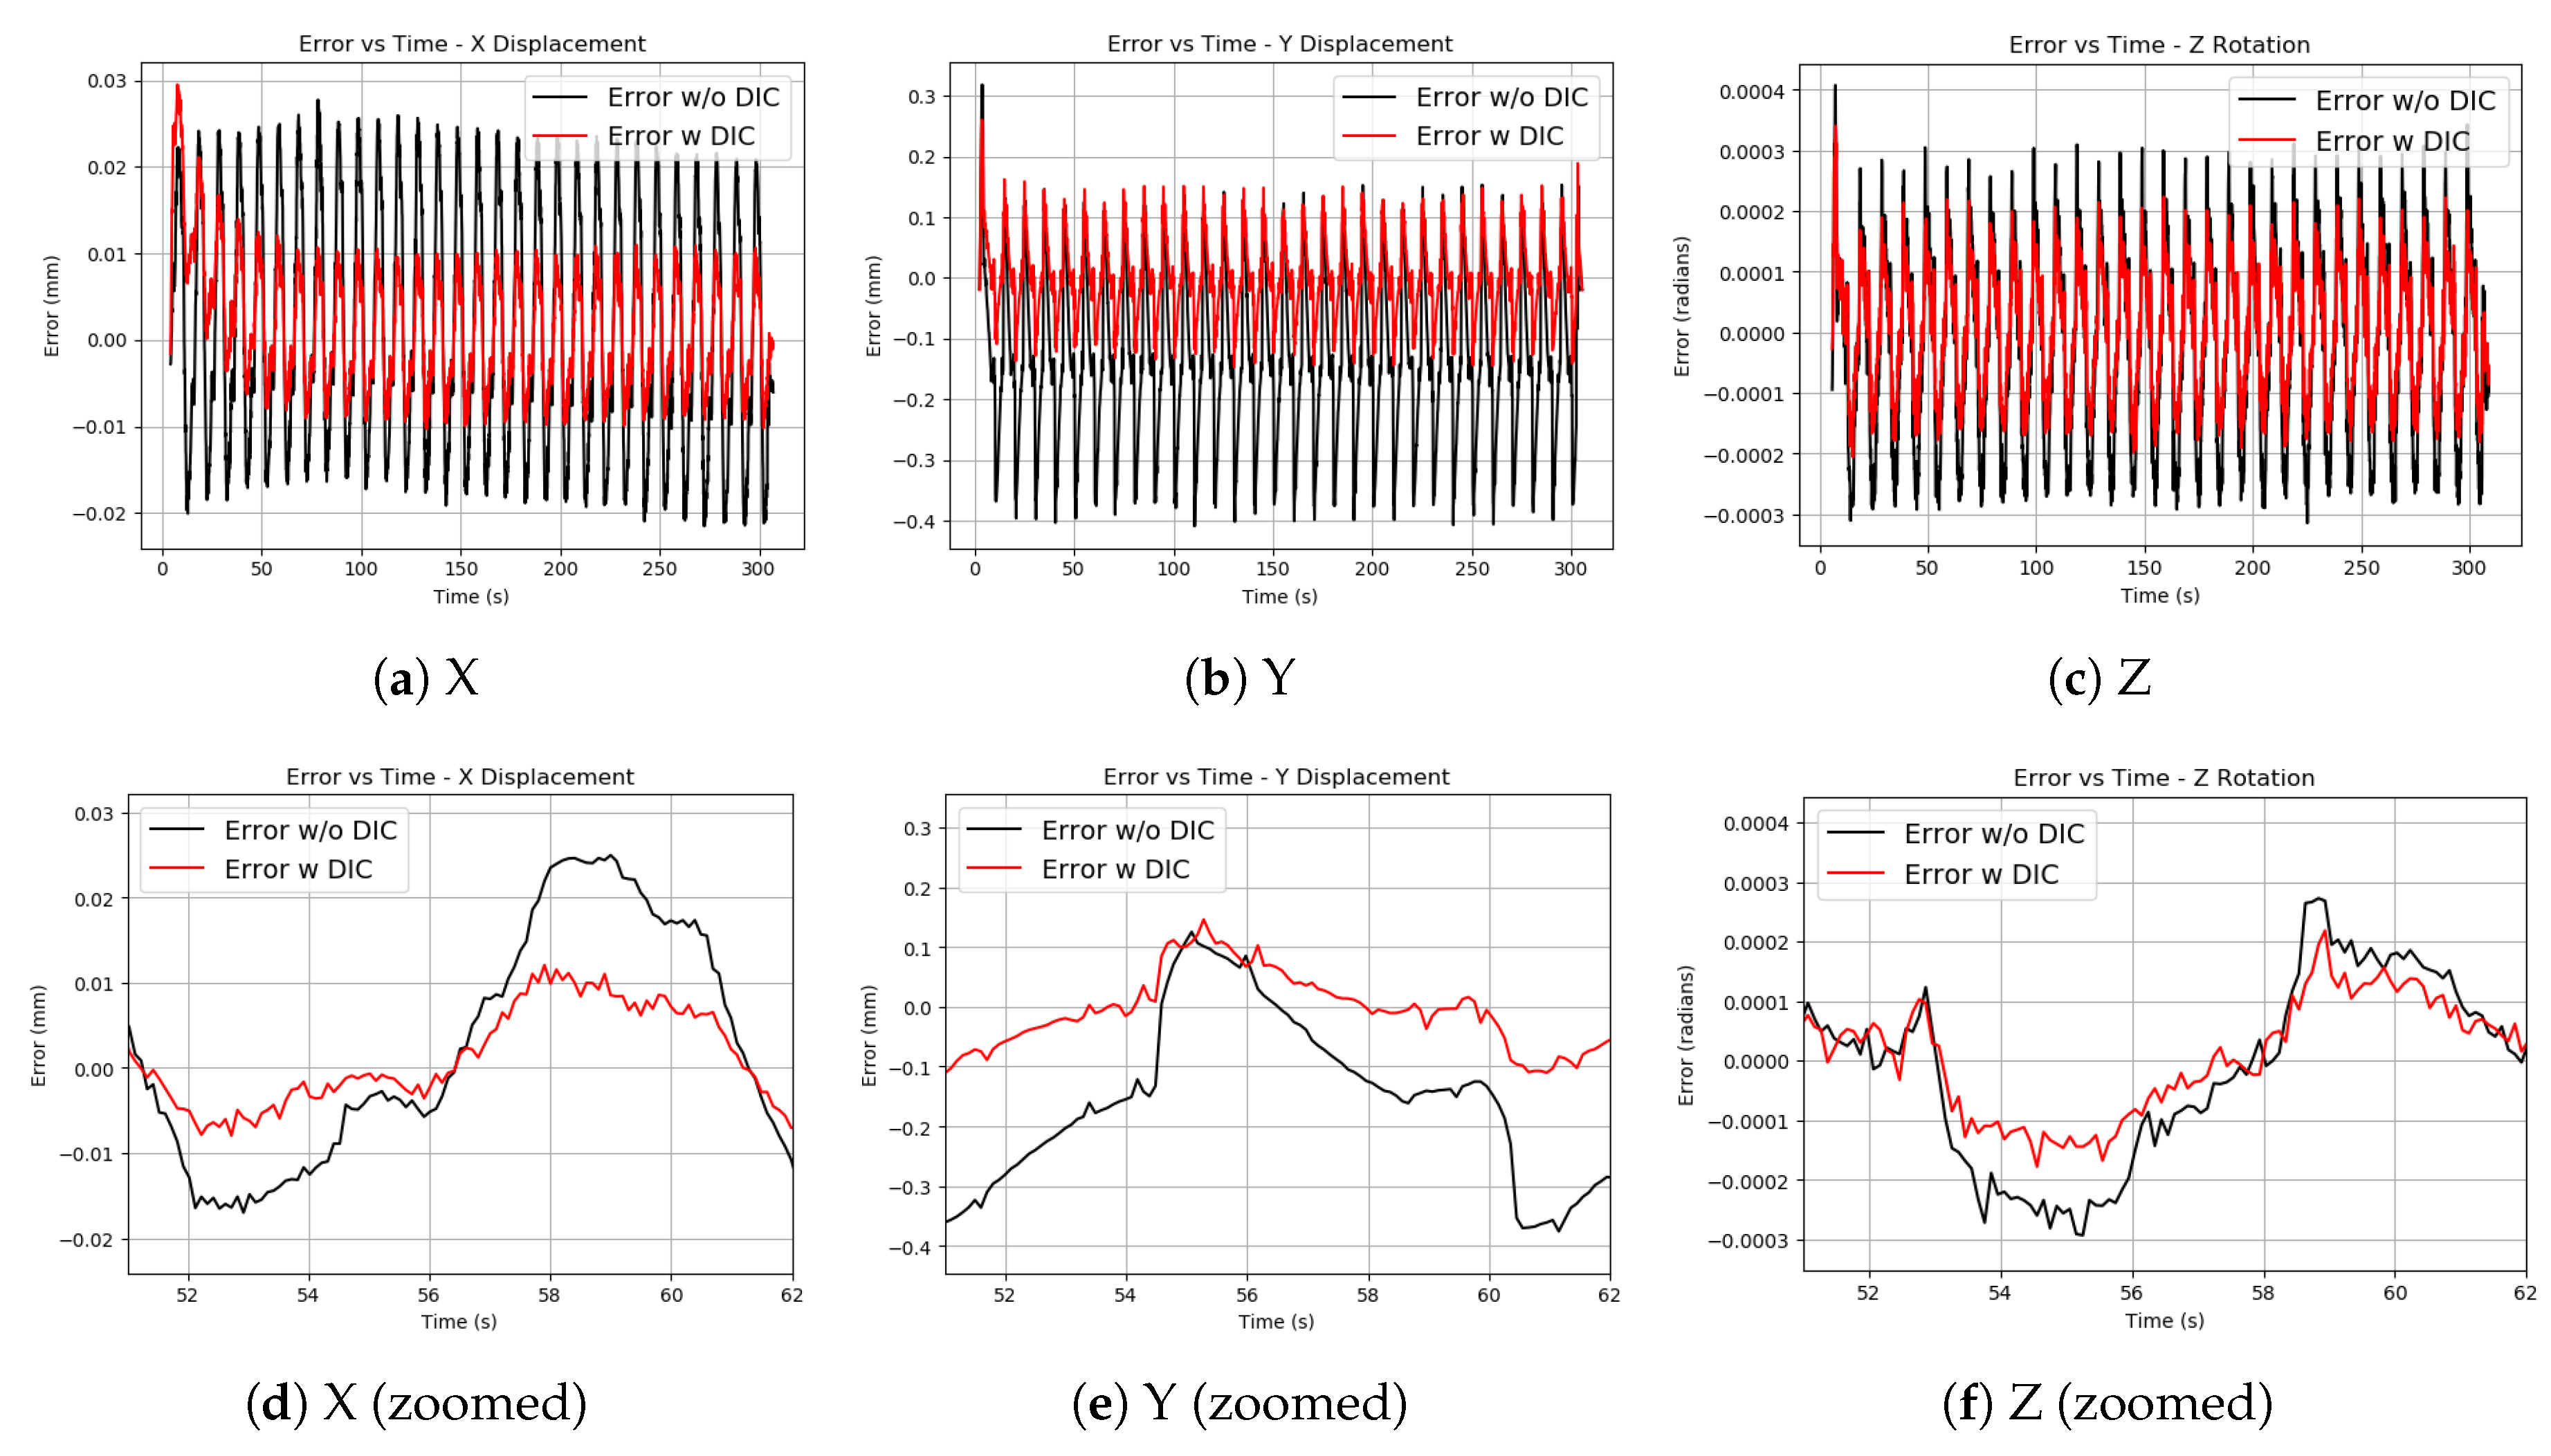
3. Results
4. Discussion
4.1. Observations on Experiments
4.2. Effects of Displacement Errors
4.3. Future Work
5. Conclusions
Acknowledgments
Abbreviations
| DIC | Digital Image Correlation |
| PID | Proportional-Integral-Derivative Controller |
| HS | Hybrid Simulation |
| MDOF | Multiple Degree of Freedom |
| SDOF | Single Degree of Freedom |
| SB | Shared Boundary |
| LTF | Linear Transfer Function |
| CM | Control Method (1&2) |
References
- Al-Mahaidi, R.; Hashemi, J.; Kalfat, R.; Burnett, G.; Wilson, J. Multi-Axis Substructure Testing System for Hybrid Simulation; Springer: Berlin, Germany, 2018; pp. 1–7. [Google Scholar] [CrossRef]
- Waldbjørn, J.P. Hybrid Smulation of Wind Turbine Blades: A Dissertation; DTU Civil Engineering, Technical University of Denmark: Lyngby, Denmark, 2016. [Google Scholar]


| Test | DOF | Cycles | Load-Point Amplitude | LTF |
|---|---|---|---|---|
| 1 | Y Displacement | 30 | ±7.5 mm | 3.2962 |
| 2 | X Displacement | 30 | ±0.5 mm | 1.1336 |
| 3 | Z Rotation. | 30 | ±0.0075 rad | 1.8373 |
| DOF | CM1 | CM2 |
|---|---|---|
| X-Displacement | 14.1% | 6.09% |
| Y-Displacement | 3.78% | 1.25% |
| Z-Rotation | 3.23% | 1.96% |
Publisher’s Note: MDPI stays neutral with regard to jurisdictional claims in published maps and institutional affiliations. |
© 2018 by the authors. Licensee MDPI, Basel, Switzerland. This article is an open access article distributed under the terms and conditions of the Creative Commons Attribution (CC BY) license (https://creativecommons.org/licenses/by/4.0/).
Share and Cite
Quinlan, A.; Waldbjørn, J. Single-Component Hybrid Simulation Techniques for Validation of Fatigue Models. Proceedings 2018, 2, 453. https://doi.org/10.3390/ICEM18-05328
Quinlan A, Waldbjørn J. Single-Component Hybrid Simulation Techniques for Validation of Fatigue Models. Proceedings. 2018; 2(8):453. https://doi.org/10.3390/ICEM18-05328
Chicago/Turabian StyleQuinlan, Alex, and Jacob Waldbjørn. 2018. "Single-Component Hybrid Simulation Techniques for Validation of Fatigue Models" Proceedings 2, no. 8: 453. https://doi.org/10.3390/ICEM18-05328
APA StyleQuinlan, A., & Waldbjørn, J. (2018). Single-Component Hybrid Simulation Techniques for Validation of Fatigue Models. Proceedings, 2(8), 453. https://doi.org/10.3390/ICEM18-05328