Abstract
Digital Image Correlation (DIC) is used to track the deformation of a cantilever beam at a measurement-point located away from the loading-point. A baseline test is run using the assumption of a linear relationship between the measurement point and the loading point. A second test is run that introduces a proportional-integral-derivative (PID) control based on the DIC measurements. This second method showed an improved ability to follow a cyclic command signal, with the X displacement improving from 14.1% to 6.1% error, the Y displacement from 3.8% to 1.25%, and the Z rotation from 3.2% to 2.0%.
1. Introduction
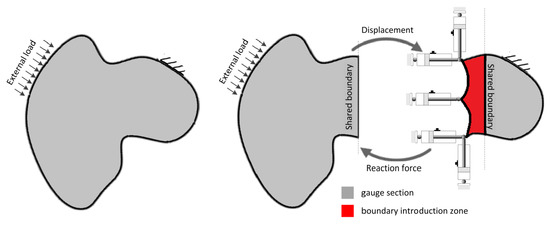
Hybrid Simulation (HS) is a sub-structuring technique that connects physical experiments with numerical analyses. Using HS for testing sub-structures reduces the size of the experimental set-up compared to full-scale testing by numerically modeling less critical sections. Parts of the structure that are critical to performance or behave in an unpredictable manner are tested in a physical substructure and then linked to the numerical model [1].
To utilize the advantages of HS, the connection between the numerical and experimental parts must have minimal error. The reaction forces of the experimental substructure are returned to the numerical model for use in the next iteration. Errors in displacement result in errors in these reaction forces, which will cause the experimental substructure to be modeled as under- or over-stiff in the numerical model. Consequentially, accuracy of the applied displacements is paramount for successful HS.
2. Methods
2.1. DTU Hybrid Simulation Test Rig
The DTU Structural Laboratory contains a dedicated test rig for Hybrid Simulation. This HS Rig currently has one vertical actuator and two horizontal actuators attached to the free end of a cantilever beam made of pultruded fiberglass. The vertical actuator is an MTS 244.12, with a 25 kN force rating and an MTS 661.19F-08 25 kN load cell attached. The horizontal actuators are MTS 242.01, with a 4.5 force rating capacity and 661.19F-01 5 kN load cells attached to each.
A coupling matrix in the MTS 793.15 software relates the individual movements of the three actuators to an MDOF control at the loading point. This allows the loading point to be commanded in terms of three degrees of freedom: X displacement, Y displacement, and Z rotation. The dimensions of the rig and the capacity of the actuators are shown by the schematic in Figure 2.

Figure 2.
Hybrid Simulation Rig with a pultruded fiberglass cantilever beam.
2.2. DIC System Set-Up
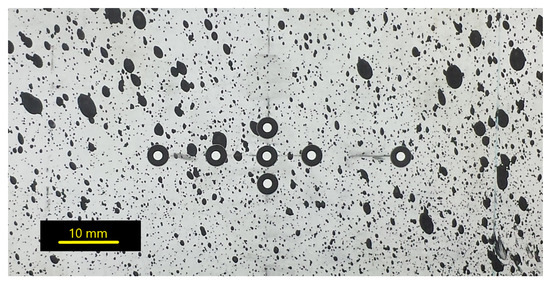
A stereo-camera Digital Image Correlation system is set-up as part of the Hybrid Simulation Rig. The DIC system is a 12 megapixel system from GOM that uses Aramis software. A pattern of 7 tracking dots is applied to the side of the cantilever beam, shown in Figure 3. With a maximum sampling frequency of 232 Hz and a 13 ms time delay, the DIC system tracks the movement of these dots and calculates the average displacement in the X and Y direction and the rotation about the Z axis. The displacements can be measured to an accuracy of 0.001 mm in the current configuration. The out of plane displacement can also be monitored, but is neglected in these tests because of the loading configuration.

Figure 3.
Pattern of DIC points for tracking displacement and rotation. The speckle pattern is unused.
The real-time measurements of these three degrees of freedom are sent via analog output to the MTS controller. The MTS software controlling the actuators is then able to access the DIC measurements, writing them to the output file or using them as part of the control loop.
2.3. Measuring Experimental System Response
Because the experimental and numerical parts of HS connect through the shared boundary, the displacements of the SB need to be monitored and controlled. The displacements and rotations at the shared boundary are calculated by the MDOF coupling assuming a rigid connection between the actuators and shared boundary point. However, in reality this is not a perfectly rigid connection, so the relations between the nominal MDOF displacements and the actual SB displacement must be defined.
To determine these relations, loading patterns were applied for X displacement, Y displacement, and Z rotation according to Table 1. The results are plotted in Figure 4 with a linear best fit line. The inverse of these slopes is defined as a linear transfer function (LTF) that can be used to relate the desired displacement or rotation to the required command signal. These tests isolate the three single DOFs in the MDOF system, so no active interaction is observed.

Table 1.
The linear transfer function (LTF) between the command signal and shared boundary displacement for 3 degrees of freedom.

Figure 4.
Best fit linear relationships between loading point and shared boundary point.
2.4. Cyclic Loading Tests
A series of six tests was run to compare two different control methods. The tests used a cyclic command signal for SB displacement.
Control Method 1 (CM1) multiplies the command signal by the linear transfer function (shown in Table 1) to use as input to the MDOF coupling matrix. The coupling matrix converts the Shared Boundary DOFs ( d, d, ) into displacements commands for the three actuators. For each actuator, an inner PID loop is used to control the shaft displacement based on reading from an internal LVDT. No feedback from the DIC system was used by CM1.
Control Method 2 (CM2) uses the same control loop as CM1, but includes an outer PID loop that uses a feedback signal from the DIC system. The output of this outer PID loop is summed with the output of the linear transfer function. These two control loops are visualized in Figure 5.

Figure 5.
Control Loops for control methods CM1 and CM2.
While the experimental rig is set up to run three degrees of freedom simultaneously, this experiment looks to set the baseline by quantifying single degree of freedom (SDOF) performance. The experiments are run at a frequency of 0.1 Hz, so their reaction is considered quasi-static.
3. Results
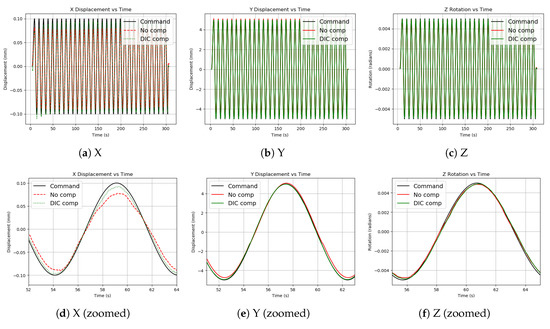
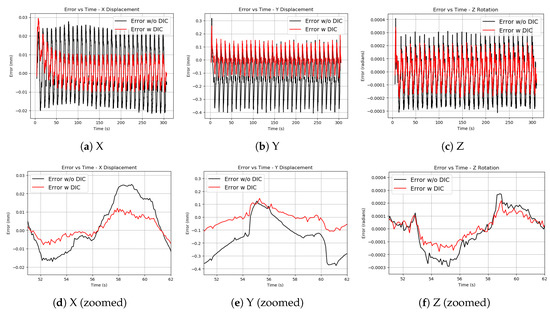
The results of the tests are plotted in Figure 6 and the error functions are plotted in Figure 7. A summary of the error values is presented in Table 2. It is shown in Figure 7 that the CM2 method starts with a high error that reduces and stabilizes after 1 or 2 cycles. This is caused by error accumulating in the integral portion of the PID loop before the test begins. This issue should be resolved for future testing, but will be dealt with here by neglecting the first 10% of the test time and evaluating the error only in the steady state region.

Figure 6.
Shared Boundary Displacement/Rotation using two control methods.

Figure 7.
Error between the Shared Boundary Displacement/Rotation and the command signal.

Table 2.
RMS Values of Normalized Error (Steady State Region).
4. Discussion
4.1. Observations on Experiments
The results in Table 2 show that the greatest error occurs in the X displacement. This is expected since this DOF exhibits the least linear behavior of the three DOFs in Figure 4. It is suspected that worn components in the horizontal actuators contribute to this non-linearity. Consequentially, the greatest improvement from the introduction of DIC feedback with CM2 is on the X displacement. The more linear responses of the Y displacement and Z rotation are also improved when using CM2, though to a lesser extent.
4.2. Effects of Displacement Errors
An accurate application of loads is especially important in HS, where the reaction forces of the experimental substructure are used to calculate a stiffness value applied to the numerical model. Errors in displacement will cause the experimental substructure to be modeled as under- or over-stiff in the numerical model. Consequentially, the next iteration of numerically calculated loads will be distorted by the artificial stiffness change.
Errors in loading have additional consequences for fatigue tests. An error in displacement corresponds to an error in the developed stresses and strains in the beam. Because of the logarithmic nature of the S-N curve, a loading error can cause the fatigue life to be mispredicted by an order of magnitude.
4.3. Future Work
While there is clear improvement from the use of CM2, an RMS error value over 6% in a quasi-static test is higher than what is desired. The planned fatigue tests will be run at a much higher frequency than 0.1 Hz, so any control errors will likely be exacerbated the higher frequencies. Non-linearities exist in running the SDOF tests, so it is expected that MDOF tests will exhibit even more non-linear behavior. This makes accurate displacement control even more important.
Improvements will be made on the control system test equipment to reduce the error. The addition of lag compensation, peak-to-peak compensation, improved PID loop tuning, and filtering of the DIC feedback signal may also improve performance. Physical work will also be done to increase the linearity of the load train. Modifying the test rig and replacing worn actuators should decrease the non-linearity observed in the X displacement.
5. Conclusions
Digital Image Correlation was used to track the deformation of a cantilever beam at the shared boundary point. During quasi-static cyclic loading, the introduction of DIC feedback through Control Method 2 reduced the error in comparison to Control Method 1, with the X displacement improving from 14.1% to 6.1% error, the Y displacement from 3.8% to 1.25%, and the Z rotation from 3.2% to 2.0%. The ability of DIC feedback to correct for the non-linear behavior of the experimental set-up provides justification for its inclusion in Hybrid Simulation. It is expected that system tuning, additional compensation, and hardware improvement can reduce the error even further.
Acknowledgments
The experimental work described herein has been carried out at the Villum Center for Advanced Structural and Material Testing (CASMaT). The support from Villum Fonden (Award ref. 00007293) is gratefully acknowledged.
Abbreviations
The following abbreviations are used in this manuscript:
| DIC | Digital Image Correlation |
| PID | Proportional-Integral-Derivative Controller |
| HS | Hybrid Simulation |
| MDOF | Multiple Degree of Freedom |
| SDOF | Single Degree of Freedom |
| SB | Shared Boundary |
| LTF | Linear Transfer Function |
| CM | Control Method (1&2) |
References
- Al-Mahaidi, R.; Hashemi, J.; Kalfat, R.; Burnett, G.; Wilson, J. Multi-Axis Substructure Testing System for Hybrid Simulation; Springer: Berlin, Germany, 2018; pp. 1–7. [Google Scholar] [CrossRef]
- Waldbjørn, J.P. Hybrid Smulation of Wind Turbine Blades: A Dissertation; DTU Civil Engineering, Technical University of Denmark: Lyngby, Denmark, 2016. [Google Scholar]
Publisher’s Note: MDPI stays neutral with regard to jurisdictional claims in published maps and institutional affiliations. |
© 2018 by the authors. Licensee MDPI, Basel, Switzerland. This article is an open access article distributed under the terms and conditions of the Creative Commons Attribution (CC BY) license (https://creativecommons.org/licenses/by/4.0/).
