Abstract
This paper discusses a method for eliminating geometric optics errors that can occur when combining three-dimensional thermal images using hybrid digital holography. We obtained reconstructed digital holography using phase detection autofocus technique and arbitrary tilt plane correction.
1. Introduction
IR (infrared) digital holography is one of the techniques to achieve the thermal information of the object surface in reconstructed wave field [1]. Typically, IR digital holography has lower resolution than the general digital holography that is used with a visible laser [2,3]. Alternatively, hybrid digital holography for three-dimensional surface temperature distribution could preserve the spatial resolution of visible digital holography and temperature accuracy of the IR camera [4,5]. This method is based on the three-dimensional surface texturing function. A numerically reconstructed digital holography has 2048 × 2048 pixels and 1 cm2 field of view with 4.8 µm spatial resolution. An IR image has 320 × 256 pixels, 0.79 cm × 0.63 cm field of view with 24 µm spatial resolution and ±1% temperature accuracy. The hybrid digital holography needs the high accuracy of surface matching method. Because, it obtained from measurement systems with different optical axes and field of view. In this paper, for high accuracy 3D surface thermal distribution, we discuss the alignment and calibration technique of hybrid digital holography using autofocusing technique and tilted plane wave-field reconstruction.
2. Methods
2.1. Hybrid Digital Holography
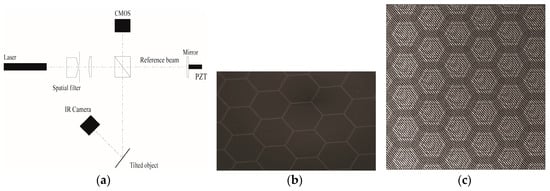
The object wave-field comes from diffusively reflecting surface, located at a distance d from the CCD as shown in Figure 1. The diffraction pattern is calculated at a distance behind the CCD plane, which means it reconstructs the complex amplitude in the plane of the real image. This diffraction of a light wave is described by the Fresnel-Kirchhoff integral as Equation (3)
where is a reconstructed wave field, is complex amplitude on the CCD, which called hologram function, and is the distance between a point in the hologram plane and a point in the reconstruction plane. As we mentioned, our goal is to combine thermal image and digital holography. These two kinds of image could be represented in a three dimensional temperature distribution, using the surface texturing function.

Figure 1.
(a) Schematic of hybrid digital holography system; (b) IR image of honeycomb structure; (c) Interference pattern of honeycomb structure.
2.2. Reconstruction of Digital Holograms on Arbitrarily-tilted Planes
In typical digital holography, the complex wave-field on the parallel image plane is numerically reconstructed from the complex hologram wave-field with Fresnel transform, convolution method, or angular spectrum method (ASM). The merit of the ASM is that there is no restriction on the propagation distance . Jeong and Hong presented the three-axis rotation scheme based on ASM that can accurately reconstruct the complex wave-field on any arbitrarily-tilted image plane [6]. The complex wave reconstructed by digital holography on the tilted image plane means simulating light propagation from the hologram plane to the image plane through calculation of the diffraction of the object wave distribution to the tilted plane. Standard transformation matrix is used to rotate the wave vector coordinates, on the axis with the angle of to determine the spatial frequencies and associated to the components of the rotated wave vector components. According to the spatial frequencies transformation using Fourier transform , the rotated angular spectrum can be written as
In shortly, the object field on any reconstruction plane can be obtained from the following transformation of the object field on the hologram plane:
2.3. Phase Detection Autofocusing (PD AF)
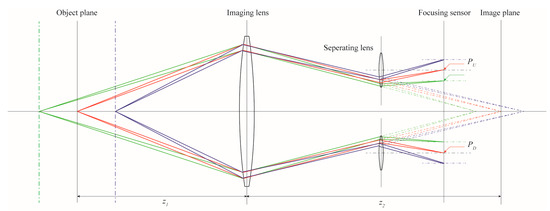
Digital holography could be adjusted by the image focusing in the reconstruction process because of this unique property that reconstructed digital holography can be calculated the intensity as well as the phase. PD AF algorithms were originally developed by Minolta and introduced in the Maxxum camera system in 1985 [7]. The basic concept of the PD AF method involves determining the location of the correct focal plane using the dual thin lens formula as Figure 2. It should be noted that the separating lens have the same lens properties and locations are symmetric with respect to the optical axis. PD AF differs by dividing the incoming light into pairs of images of dual separating lens and comparing the location. If the object is moved backward (rear focus as green line) or forward (near focus as blue line), then separating lens image location is vertically changed. The relationship between the digital holography reconstruction and PD AF method is the position and the reconstruction distance of the image on the detection plane within a certain range. The position of the image on the detect plane differs corrected the reconstruction distance which based on the vertical location of images on detector plane and obtained the correct holography with the focus [8,9].

Figure 2.
Schematic diagram of phase-detection autofocusing (PD AF). , distance between object plane and imaging lens; , distance between imaging lens and the image plane; , , location of each separating lens images. If the object is farther away (or closer) from the focus position, the spacing between the two separating lens images becomes narrower (or widened).
3. Results and Discussion
Before combining these two images, we should geometrically match the digital holography and thermal image from IR camera. For this calibration, we acquired the phase shifted interference pattern of the USAF resolution target (Newport) using digital holography. The phase of the reference wave was shifted by applying DC voltage as sine pattern with 100 Hz and 0.2 V to PZT. The video capture mode has the advantage of intuitively analyzing the phase shift phenomenon likes as a scattering by the dust particles on the sample surface and vibration from the PZT. The selected 8 phase shifted interference patterns were used to calculate the complex amplitude of digital holography plane by inter-frame intensity correlation method. The focus wave-plane is 16.5 cm away from CCD.
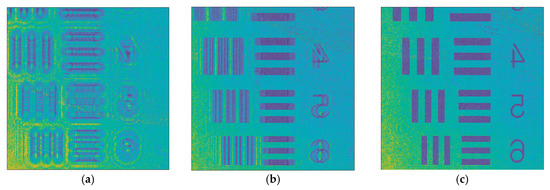
As shown in Figure 3, after the 45.8 degree tilted wave plane, the most sharpness edge (and highest image contrast value) of USAF target shape define the corrected reconstruction wave field and horizontally symmetry rectangular shape. The focus wave-plane is 16.5 cm away from CCD. The lateral resolution is 5 µm using the group 1, element 4 in the resolution target. The phase fluctuation of the blank phase image obtained without any sample inserted in the object beam path was measured to check the lower bound of the phase measurement precision. The phase variation along a 1000–pixel-standard deviation is 2.37°.

Figure 3.
Reconstructed USAF resolution target digital holography image. (a) The digital holography plane; (b) Typical angular spectrum reconstruction. The horizontal pattern is not symmetry and vertical pattern is sharp; (c) Arbitrary tilted angular spectrum method.
This focused reconstruction distance estimate of the required amount of focus movement in PD AF. The vertical image location of separation lens is depended on the location of object. In this experiment, the arbitrary PD AF simulation is designed when object is located in the 16.5 cm. The vertical separation lens image location is 219 pixels when focused image and it moves by 1 pixel every 0.1 cm movement of the object. We called this pixel location as focusing pixel location.
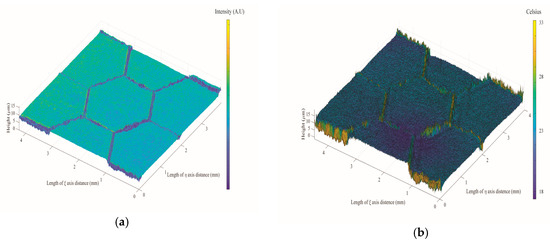
After digital holography calibration, aluminum honeycomb structure was measured. PD AF simulation result was 4 pixels different with focusing pixel location. It means the surface of honeycomb structure located 0.4 mm backward from the initial USAF target place. Therefore, the honeycomb digital holography reconstruction distance is 16.9 cm. IR image has scaled 5 times because it has 24 µm lateral resolution. After 3 processes, i.e. tilting plane, focusing plane and scaling correction, an image was shown as Figure 4. This image shows the 3 dimensional honeycomb structure image 4.5 mm × 4.5 mm which represent the intensity, height, and temperature image at the same time.

Figure 4.
3 dimensional texture digital holography results. (a) 3D amplitude; (b) 3D temperature image.
4. Conclusions
The 3D thermal image with hybrid digital holography image could express the surface deformation with simulated thermal information. In this paper, we discussed how to effectively eliminate the geometric optics errors like tilted plane and unfocused using digital holography. These methods can be maximized hybrid digital holography efficiency which required dynamical 3D surface deformation researching. Improvements in resolution 3D surface temperature image may enable advances in diagnose of electrical device, where electric potential or heat induced phase changes are expected to play a significant role in the characterization of complex structures.
Acknowledgments
This research was financially supported by the National Research Foundation of Korea (NRF) as a grant funded by the Korean government (NRF-2013M2A2A9046502) and was also supported by the Ministry of Trade, Industry & Energy (MOTIE), Korea Institute for Advancement of Technology (KIAT) through the Local Public Agency Support Program (P0000204, 2017).
References
- Konishi, T.; Ito, A.; Kudo, Y.; Narumi, A.; Saito, K.; Baker, J.; Struk, P.M. Simultaneous measurement of temperature and chemicalspecies concentrations with a holographic interferometer and infrared absorption. Appl. Opt. 2006, 45, 5725–5732. [Google Scholar] [CrossRef] [PubMed]
- Locatelli, M.; Pugliese, E.; Paturzo, M.; Bianco, V.; Finizio, A.; Pelagotti, A.; Poggi, P.; Miccio, L.; Meucci, R.; Ferraro, P. Imaging live humans through smoke and flames using far-infrared digital holography. Opt. Express 2013, 21, 5379–5390. [Google Scholar] [CrossRef] [PubMed]
- Miyamoto, N.; Nisiyama, S.; Tomioka, S.; Enoto, T. Application of the nitroanisole as an infrared detector used in middle infrared interferometer. Opt. Commun. 2006, 260, 25–29. [Google Scholar] [CrossRef][Green Version]
- Yi, S.H.; Kwon, I.H.; Jung, H.C.; Kim, K.S.; Hong, C.K. Dynamics hybrid digital holography for simultaneous measurement of phase and thermal image. In Proceedings of the APCNDT 2017, Singapore, 13–17 November 2017. [Google Scholar]
- Yi, S.H.; Kwon, I.H.; Jung, H.C.; Kim, K.S.; Hong, C.K. Measurement of three dimensional surface temperature distribution by hybrid digital holographic imaging system. In Proceedings of the AITA 2017, Québec City, QC, Canada, 27–29 September 2017. [Google Scholar]
- Jeong, S.J.; Hong, C.K. Pixel-size-maintained image reconstruction of digital holograms on arbitrarily tilted planes by the angular spectrum method. Appl. Opt. 2008, 47, 3064–3071. [Google Scholar] [CrossRef] [PubMed]
- Carellas, P. Taking the Blur Out of Autofocus Camera Mechanisms. Opt. Photonics News 1993, 4, 6–7, 28. [Google Scholar] [CrossRef]
- Kwon, I.H.; Hong, C.K.; Jung, H.C.; Kim, K.S. Digital holography reconstruction using phase detection auto focusing method. In Proceedings of the 26th OSK Meeting 2014, JeJu, Korea, 25–27 August 2014. [Google Scholar]
- Kwon, I.H.; Hong, C.K. GPU Simulation of phase detection auto focusing method with MATLAB. In Proceedings of the 25th OSK Meeting 2014, DaeJun, Korea, 19–21 February 2014. [Google Scholar]
Publisher’s Note: MDPI stays neutral with regard to jurisdictional claims in published maps and institutional affiliations. |
© 2018 by the authors. Licensee MDPI, Basel, Switzerland. This article is an open access article distributed under the terms and conditions of the Creative Commons Attribution (CC BY) license (https://creativecommons.org/licenses/by/4.0/).