1. Introduction
Indentation test has long been used as a simple and effective tool to measure the material properties, e.g., hardness [
1,
2,
3,
4]. The main advantage of this method is that, it is suitable for the specimens with finite sample volumes, where the conventional uniaxial tests are not applicable [
2,
3]. In order to determine the plastic properties of materials using the information collected from indentation experiment, many theories and methods have been well-established, e.g., representative stress strain method [
5,
6], dimensionless functions method [
4,
7], and the inverse finite element (FE) method [
2,
8]. In these previous methods [
4,
5,
6,
7,
8], the indentation P-h curve is always considered in the indentation analysis. However, it was reported in many literatures [
9,
10,
11,
12,
13] that, the accurate determination of indentation P-h curve is not an easy task. The following uncertainty factors can influence the accuracy of the experiment P-h curve greatly: (1) the determination of the initial zero-load and initial-displacement point [
9,
10]; (2) the indenter deformation and machine/frame compliance [
11,
12]. In order to alleviate the problems mentioned above, many researchers [
2,
3,
13] used solely the residual imprint in the indentation analysis. It demands neither the accurate determination of indentation P-h curve, nor the specific pile-up values [
2,
3].
In the indentation experiment, generally three different indenter types can be considered, e.g., conical, flat punch and spherical indenters. The nature of the inverse problem, e.g., uniqueness of the inverse derived material parameters and their sensitivity to the experiment error, is very important to the practical usefulness of the established indentation methods [
2,
14]. So, it is very necessary to investigate the nature of the inverse problem formulated by different experiment conditions, e.g., different indenter shape and its corresponding simulation control types, when solely the residual imprint in instrumented indentation experiment is considered. In the present work, the nature of the inverse problem formulated by three different indenter shapes and two different simulation set-ups will be revealed. The reported results will be helpful for the design of indentation experiment in determining the mechanical properties of materials using solely the residual imprint in indentation experiment.
2. Experiment Investigation
The material studied here was the aluminum alloy Al 2024-t3. Uniaxial properties of this material is obtained by using tensile test that obeys the ASTM standards [
15]. The plastic parameters are obtained by fitting the uniaxial stress strain curves using the Hollomon hardening model, and they are listed in
Table 1.
Indentation experiment was implemented on a Hardness tester at room temperature. Indenter used in the experiment was a tungsten carbide ball, with radius 1.25 mm. The specimen was cubic, with dimensions 10 mm 12 mm 10 mm (length, width and height). Before indentation experiment, the surface of specimen was carefully polished into mirror finish, to avoid the influence of surface roughness. The movement of indenter was force controlled, up to a prior defined maximum load value. Holding time was 15 s, and then the indenter was withdrawn gradually. The residual imprint left on the surface of specimen was measured by using the 3D Measuring Laser Microscope (OSL4000).
For the each prescribed load in experiments, three repeated tests were implemented at the different indentation sites of the same specimen (denoted as Test-1, Test-2 and Test-3).
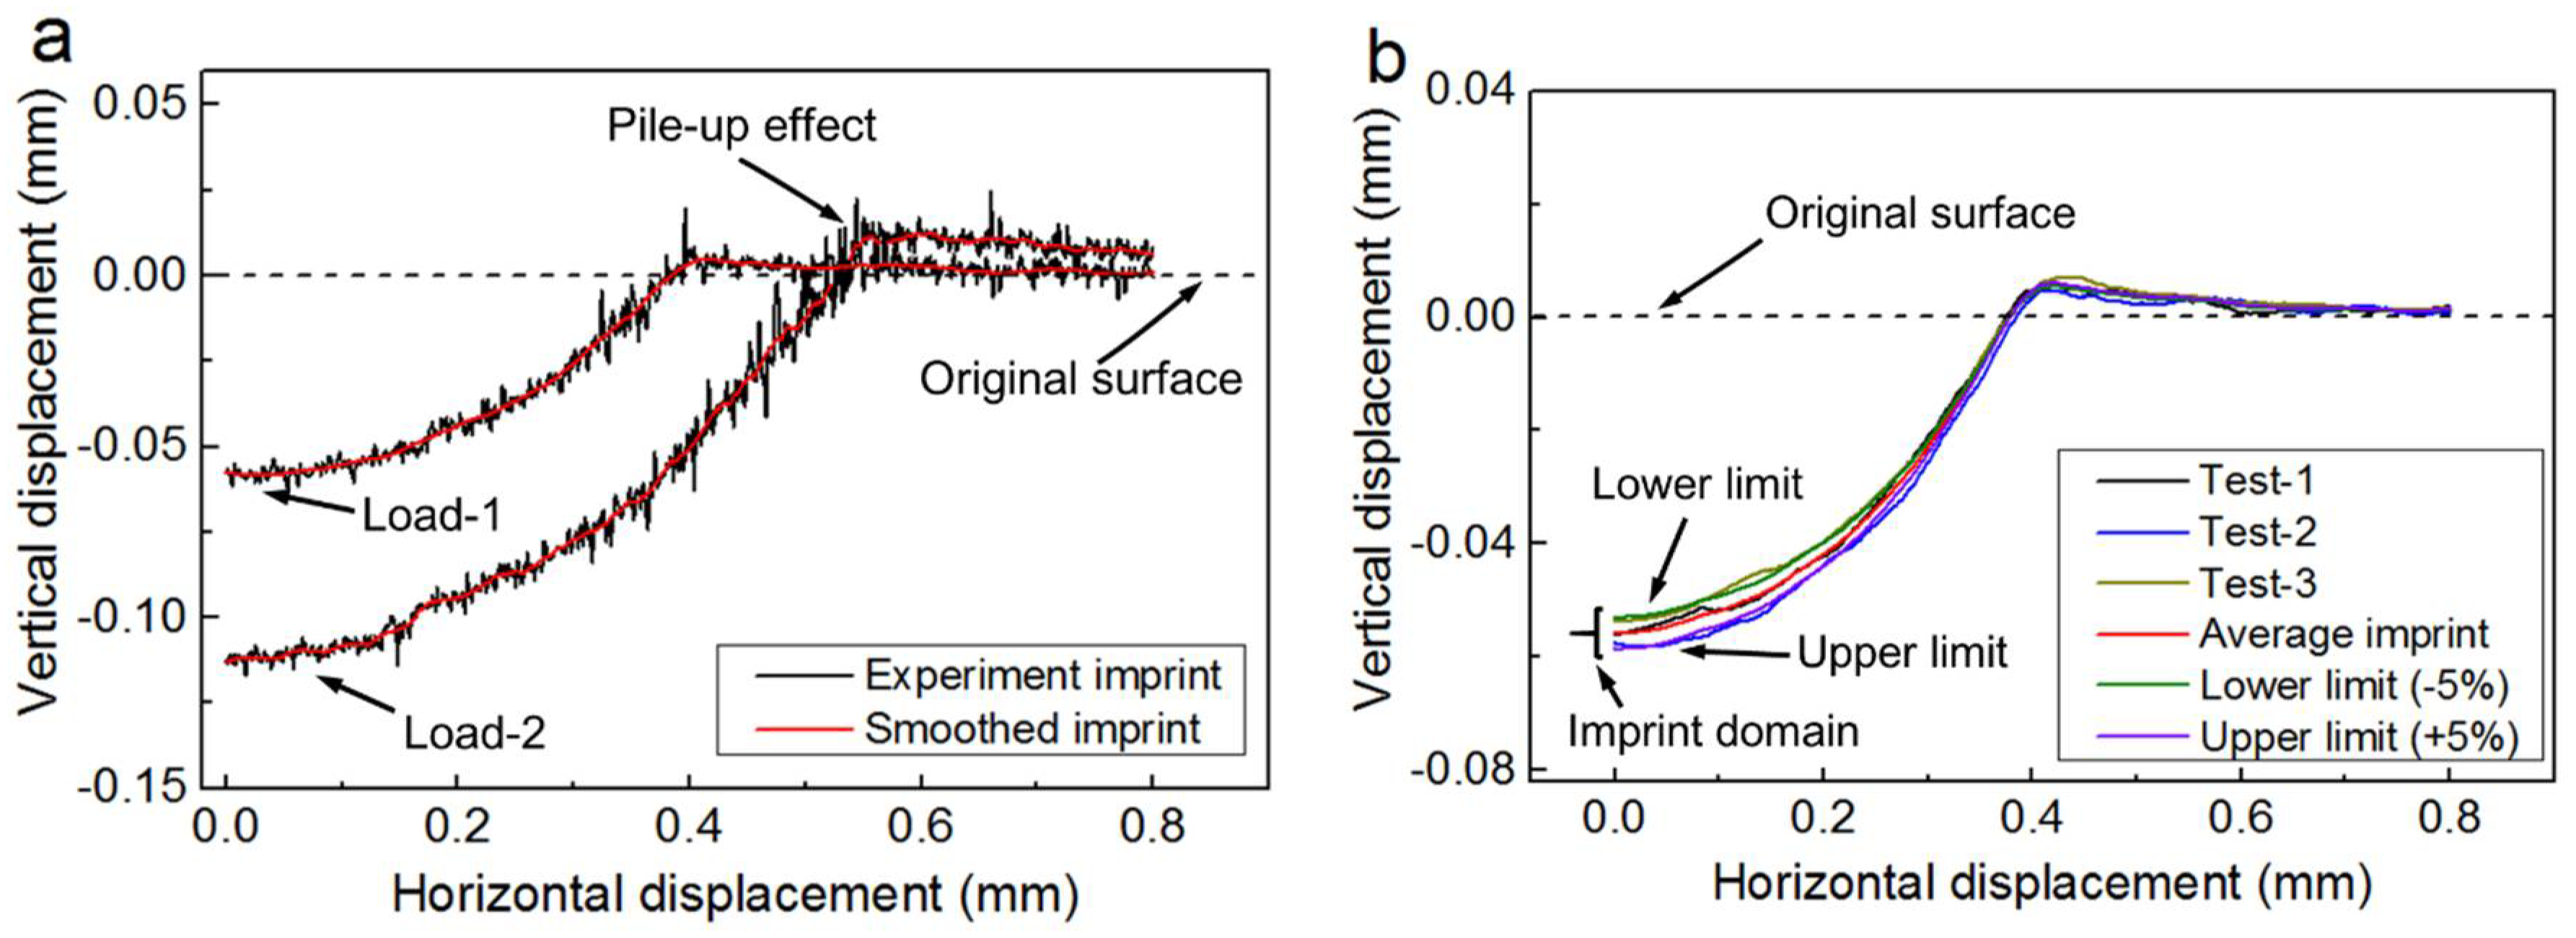
Figure 1a shows the smoothed imprints obtained from Load-1: 612.745 N and Load-2: 1225.49 N. In
Figure 1b, it shows that the experiment result in the three tests (Load-1: 612.745 N) of the same specimen are not unique. The experimental imprint exhibits small disturbance, as shown in
Figure 1. It’s noted that, the experiment error exists unavoidably, because of many uncertainty factors, e.g., material heterogeneity and experiment imprecision [
2]. Besides, the disturbance error is within
5%, and the experimental result obtained from several independent indentation tests forms an imprint domain, as shown in
Figure 1b.
3. Identification Method
In this section, the numerical protocol developed in our previous work [
2] will be used to determine the unknown plastic properties of Al 2024-t3, and further reveal the sensitivity of the inverse derived material parameters to the experiment error. Here, for the simplicity purpose, this numerical method will be briefly introduced. The vertical displacement of residual surface nodes is saved in the vector
, and
i is the residual imprint obtained from the
ith prescribed load. So,
, and
n is the number of surface nodes (it is also the dimension of vector
.). Liner weighting of the imprint snapshots of a material under several different indentation loads can be expressed as
In Equation (1),
M represents the total number of prescribed indentation loads. Vector
is the weighted imprint snapshot of the
M residual imprints.
is the corresponding weighting coefficient of the
ith imprint snapshot. The averaged weighting imprint
can be expressed as
where, imprint snapshots
,
, …,
are obtained from the numerical simulation of
N given materials
,
, …,
at the
jth prescribed indentation load. Vector
is the averaged weighting imprint. The corresponding centered weighting imprint is saved in the matrix
S, and it is expressed as
So, each snapshot
can be reconstructed by Equation (4).
In Equation (4), each
in
U serves as the orthogonal basis of imprint snapshot
S, and it is used to reconstruct the each column of matrix
S. Vector
is the corresponding coordinate of the weighting snapshot
in this orthogonal basis system. Therefore, the cost function can be expressed as
where,
is the error norm between experiment and simulation.
is the coordinate of simulated imprint snapshot in the orthogonal basis system, while
represents the corresponding coordinate of experiment imprint
. Vector
includes the unknown material parameters that need to be determined. The inverse problem described in Equation (5) is solved by using the “Interior-point” optimization algorithm. More information about this optimization algorithm can be found in Refs [
2,
16]. In the present study, the iteration is convergent only when the variation of
is less than
, and
is defined at 1 ×
.
4. Computational Modelling of Indentation Tests
The ABAQUS commercial codes [
17] were used in the indentation simulations. Three different indenter shapes, conical, flat punch and spherical, are considered.
Figure 2 shows the FE models and the indenters used in the indentation simulation. Because of the symmetrical properties of the indentation problem, the 2D axisymmetric boundary conditions are used. The indenter used in the simulation is deformable body, with elastic modulus 600 GPa, and Poisson’s ratio 0.23 [
2]. Refined meshes were created around the local contact regions between specimen and indenter.
In conical indentation simulation, the inner half angle of indenter is 70.3°. The height and radius of the selected flat indenter are 0.8 mm and 0.5 mm, respectively. A small rounding radius, 0.05 mm is used for the flat indenter, in order to avoid the stress singularity in the local contact edge. The radius of spherical indenter is 1.25 mm. Contact friction between the surfaces of indenter and specimen was fixed at 0.1 [
18]. Poisson’s ratio of specimen was fixed at 0.3 [
19]. Radius and height of specimen were defined at 4 mm, so that the influence of outer boundary effects is negligible. CAX4R element type was used for both the indenters and specimen. Two different control types, force control (F-C) and displacement control (D-C), are used in the present study.
5. Results and Discussion
As we have discussed in
Section 2, that the experiment result shows obvious disturbance. Here, in order to avoid the influence of the other uncertainty factors, we use the “simulated” imprint using the plastic properties,
= 292.3 MPa and
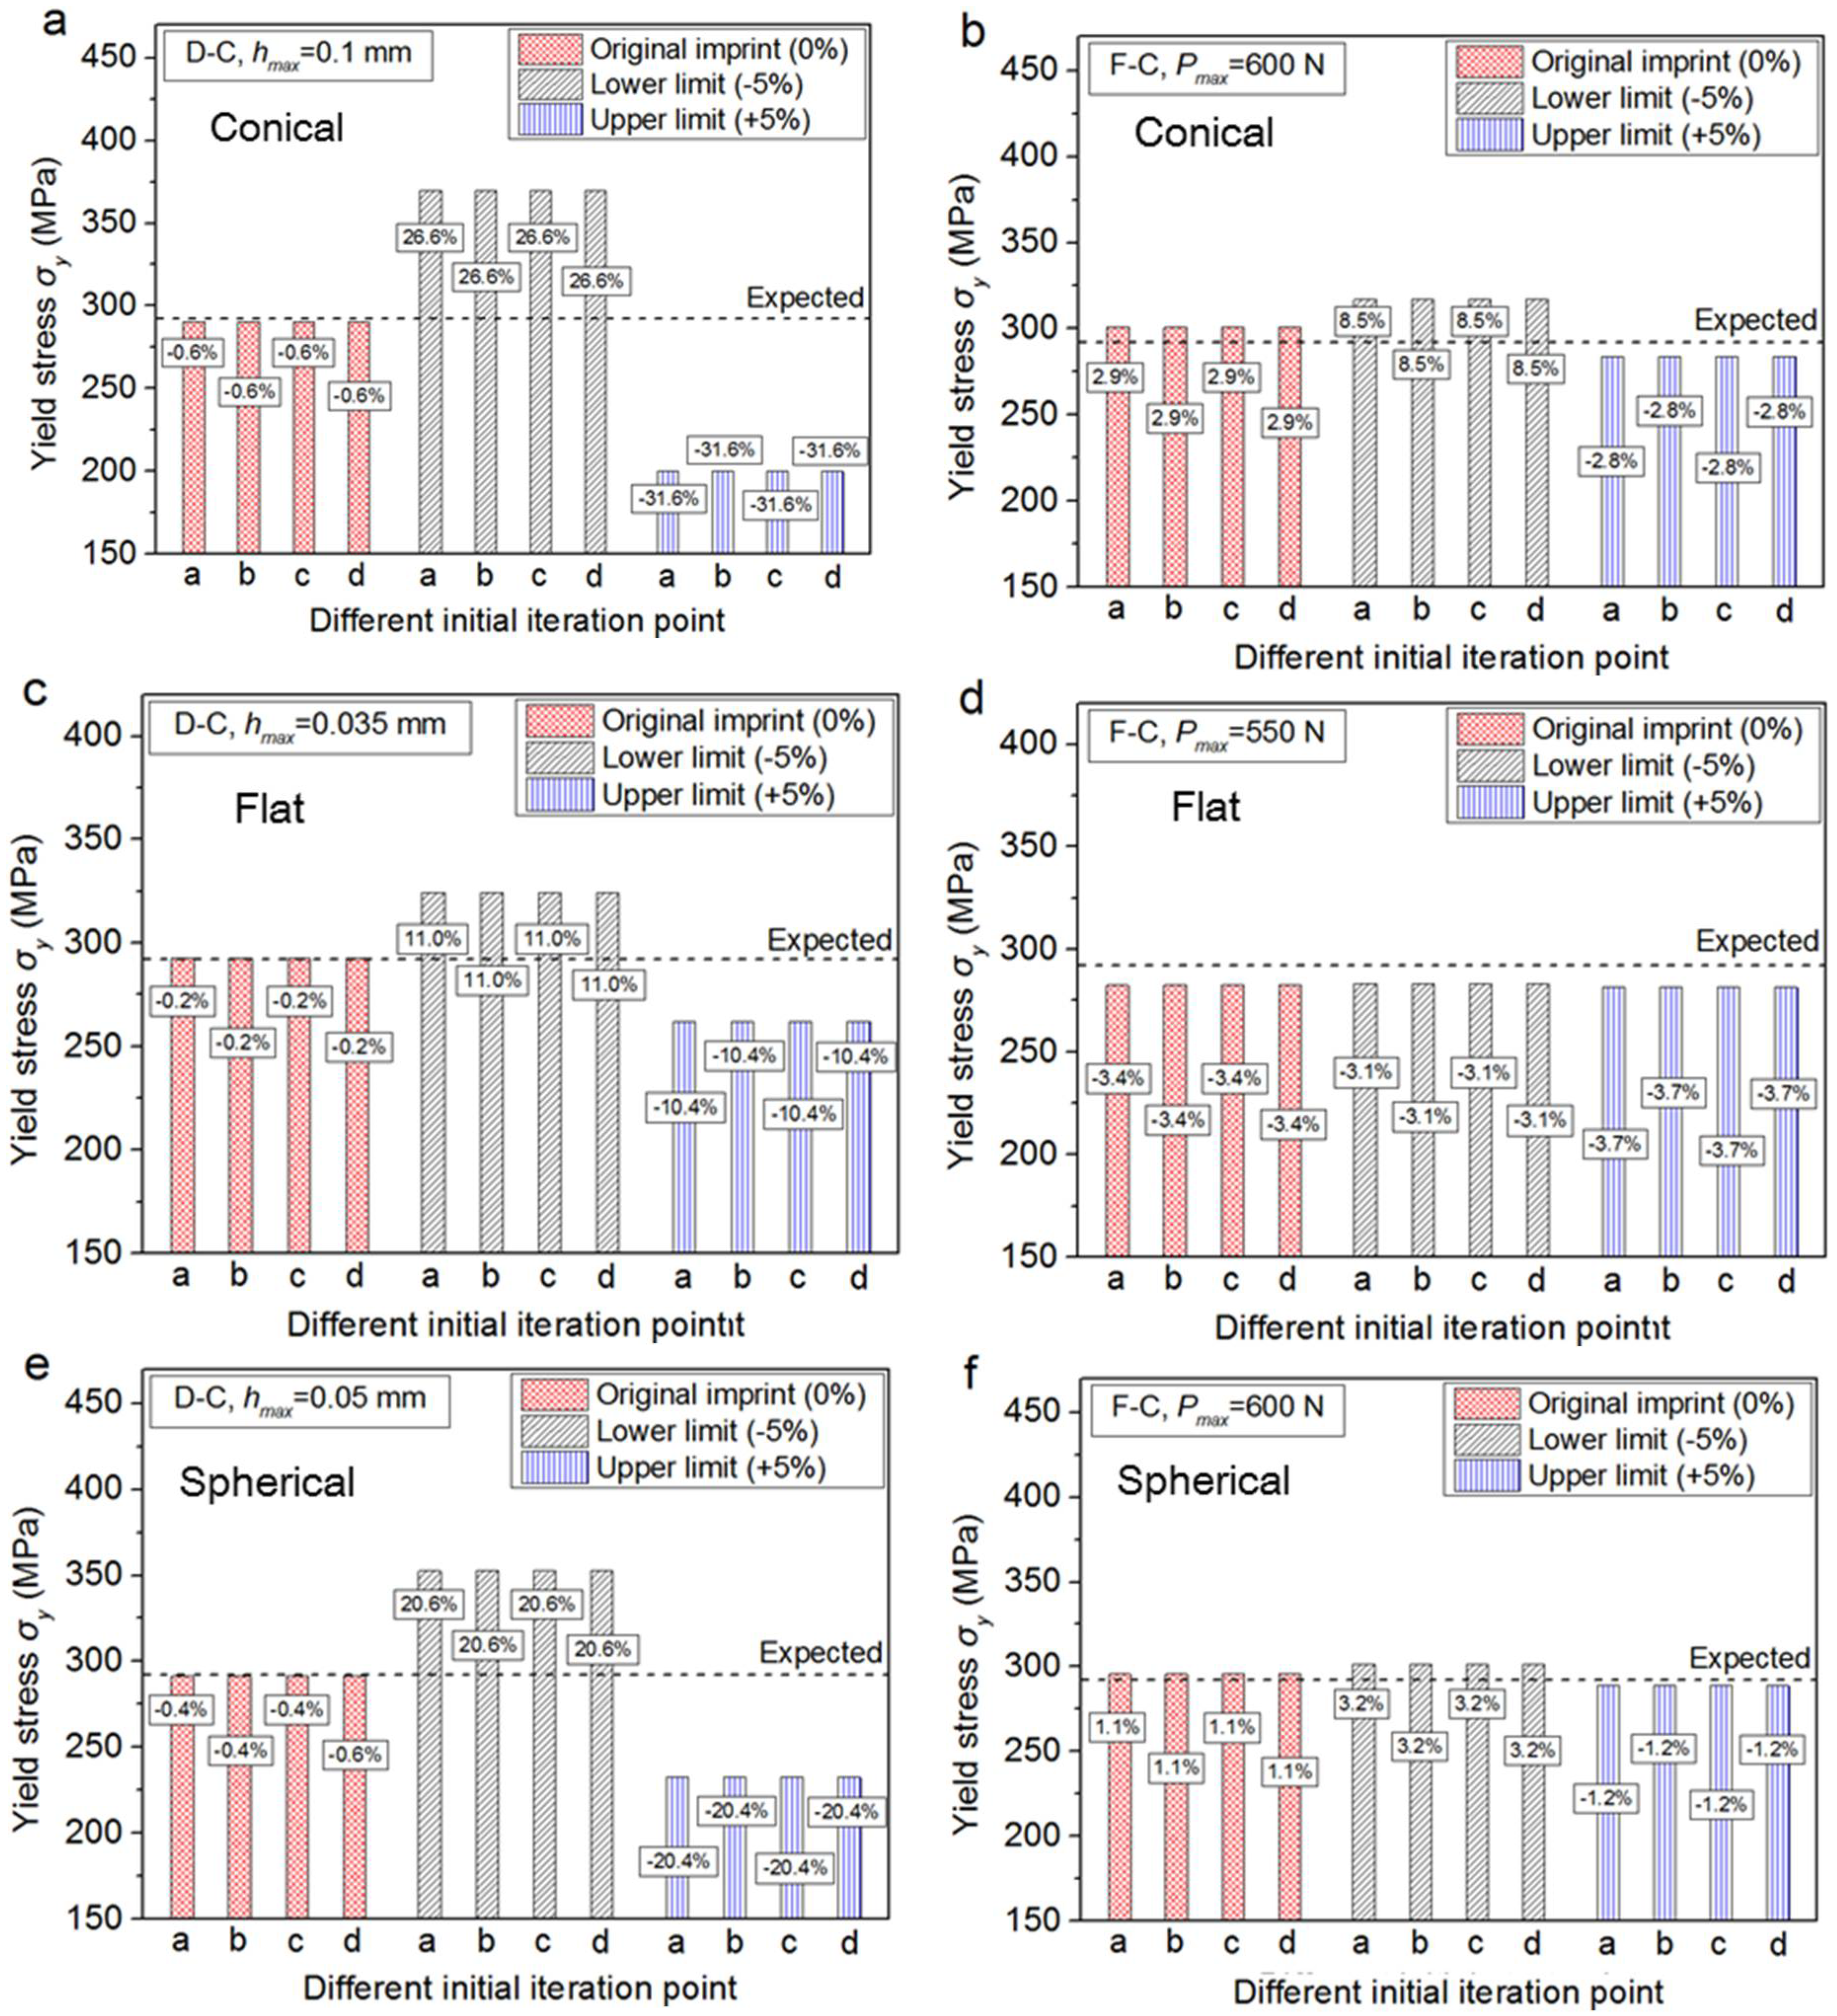
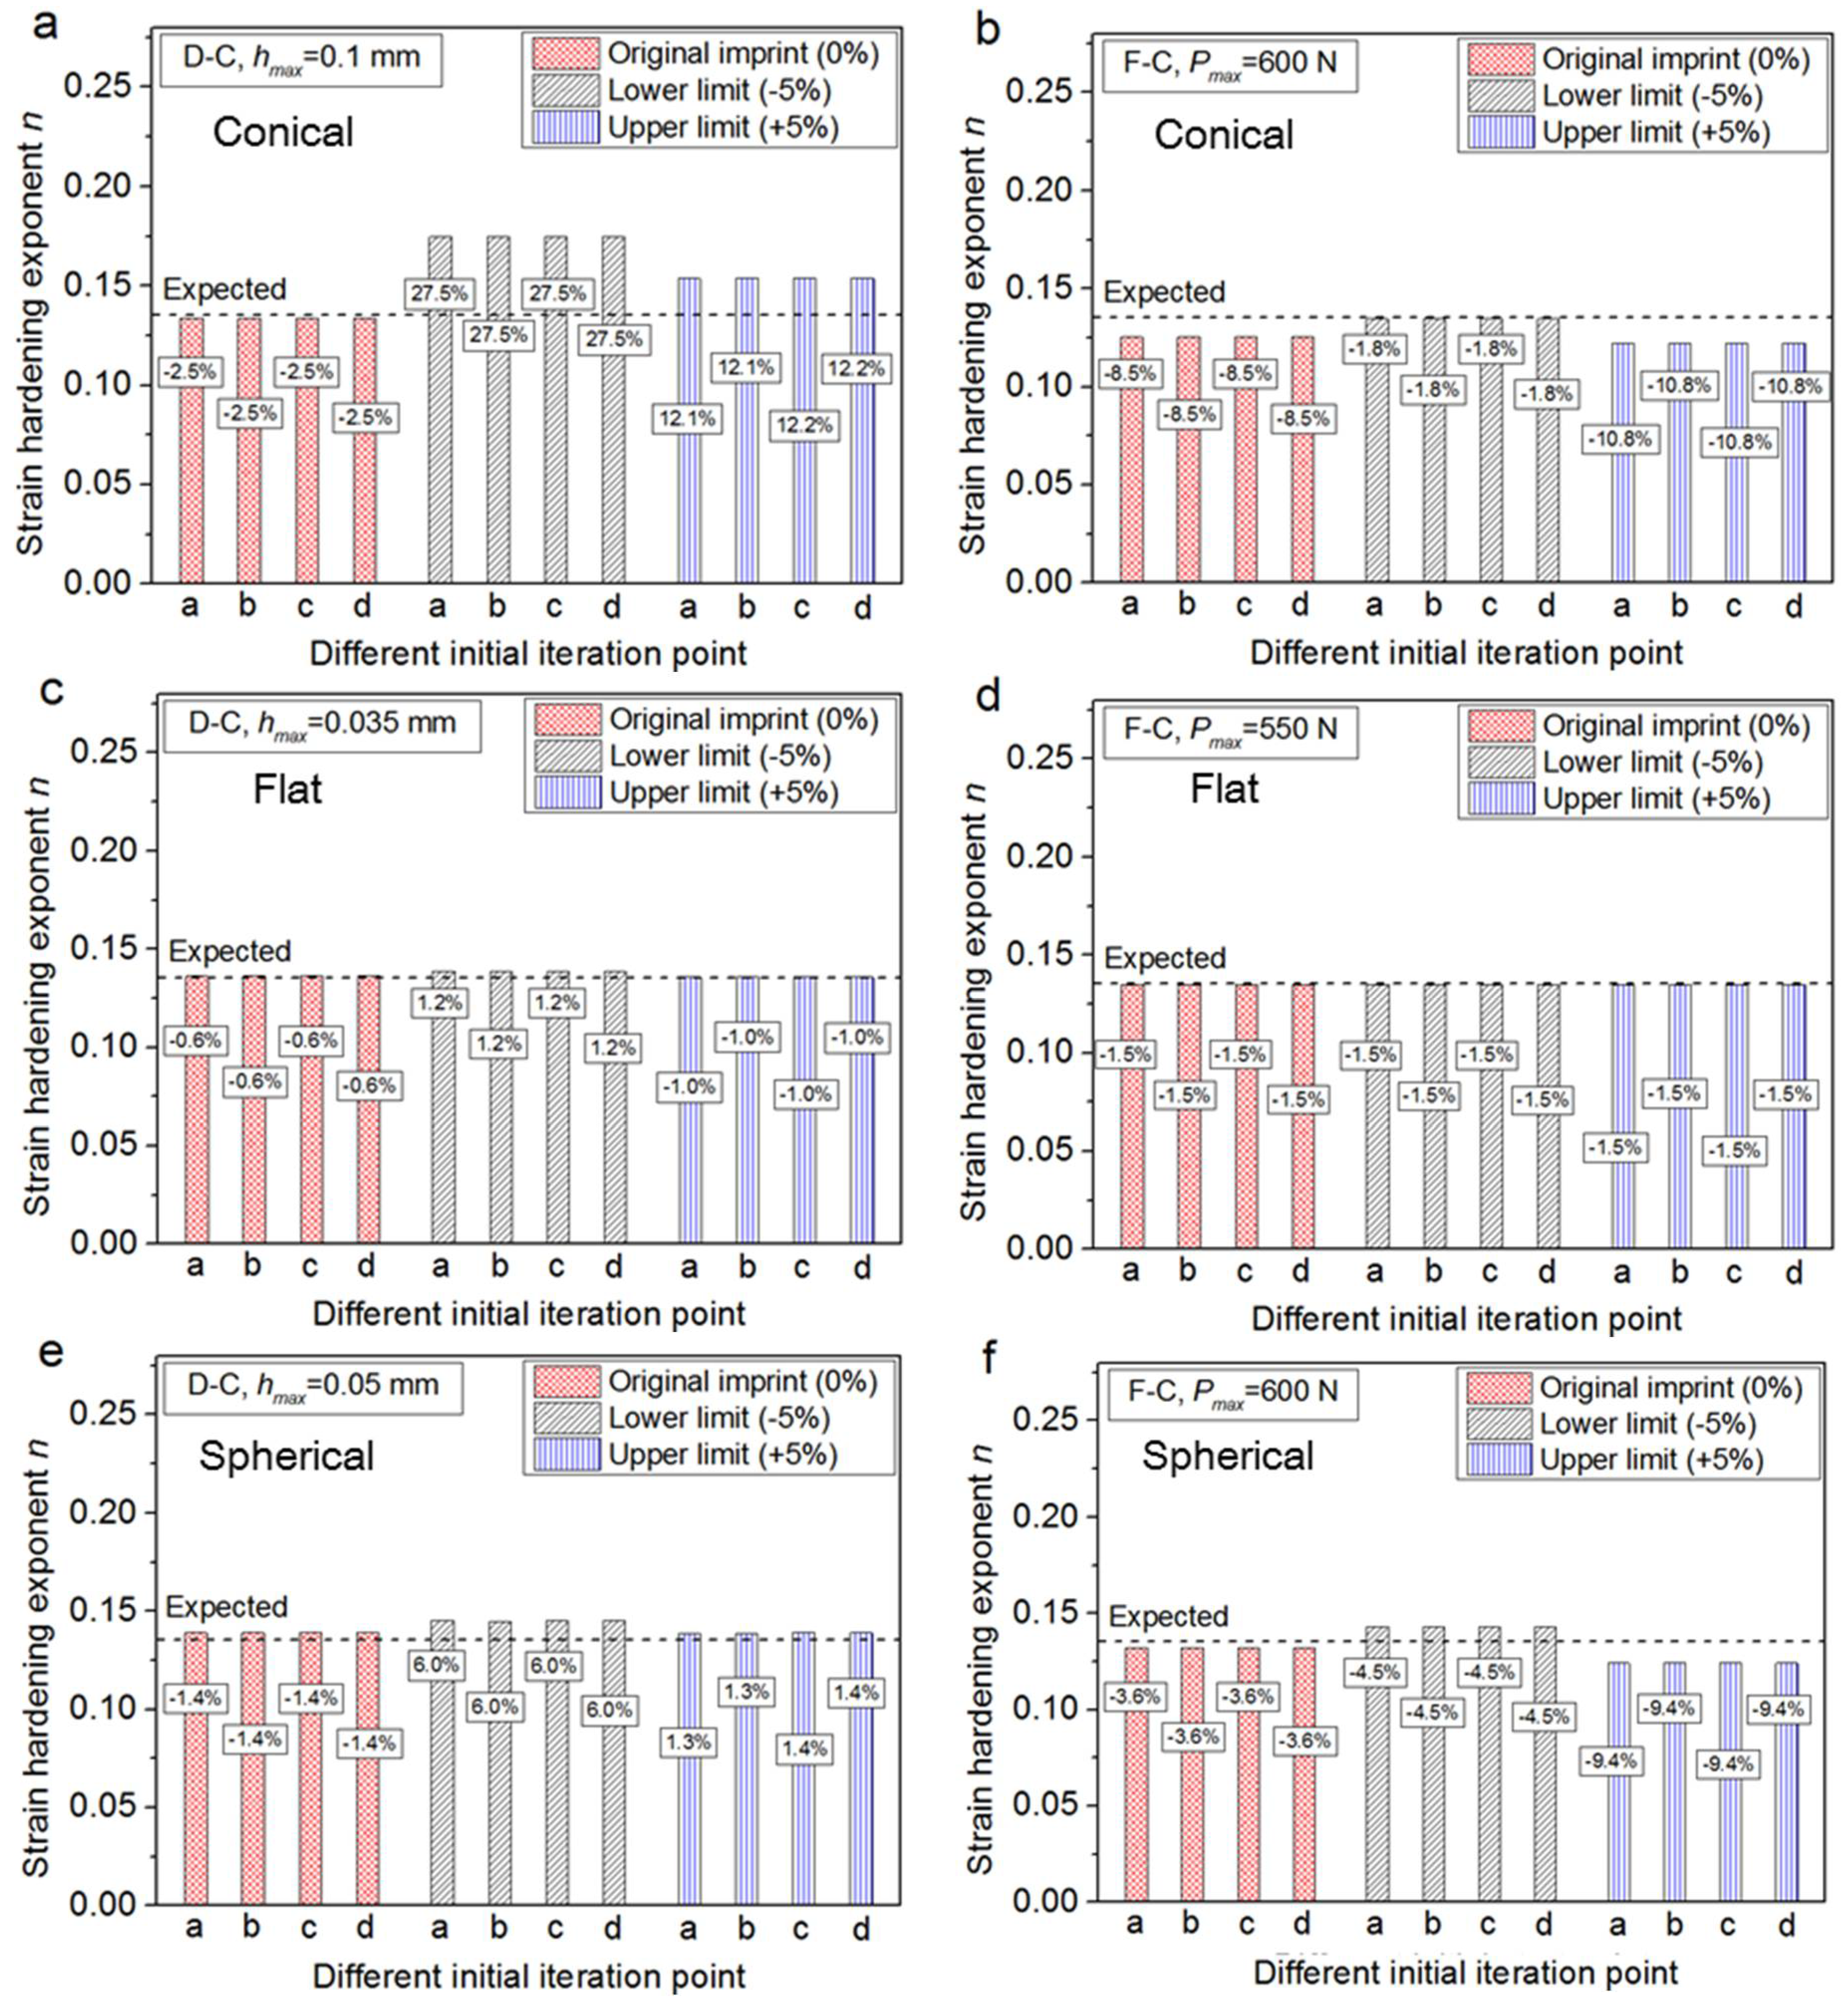
n = 0.137 of the target material, as the replacement of real experiment imprint. This imprint is denoted as the “original” imprint snapshot. Then, two error disturbances, −5% and +5% are added on the original imprint data. They are denoted as the upper and lower limit snapshots. These three imprint snapshots are separately used in the inverse identification process with different combinations of indenter shapes and simulation set-ups. Results are shown in
Figure 3 and
Figure 4.
Because the single imprint under one certain prescribed indentation load is used here, M in Equation (1) is defined as 1, and = 1 and = 0. The selected material ranges in the present optimization problem are 200 MPa 380 MPa, and 0.075 0.195. The optimization algorithm described in Equation (5) is essentially nonlinear and non-convex. So, four different initial feasible points are selected in the inverse identification processes, in order to avoid the local minimum values. These four different initial feasible points are denoted as a: (200, 0.075), b: (200, 0.195), c: (380, 0.075) and d: (380, 0.195).
As can be seen from
Figure 3 and
Figure 4, that the unique solution of the inverse derived material parameters is obtained, whatever the selected indenter shapes or simulation set-ups. The inverse identified yield stress and strain hardening exponent of the four different initial points, a–d are nearly identical. However, the stability of the inverse problem revealed by using different indenter shapes or simulation set-ups exhibits distinct difference.
First, in light of the selection of simulation set-up, it shows both the yield stress and strain hardening exponent identified by using the force-controlled simulation type are more stable, whatever the selected indenter shapes are conical, flat or spherical. When the force-control type is used, with
5% error disturbance added on the original imprint, it only causes maximum +8.5% error of the inverse yield stress (e.g.,
Figure 3b using a conical indenter), and maximum −10.8% error of the inverse identified strain hardening exponent (e.g.,
Figure 4b using a flat indenter). In most cases, the error values of the inverse identified parameters of both the yield stress and strain hardening exponent are within
5% (e.g.,
Figure 3d,f and
Figure 4d,f).
Second, in light of the selection indenter types, it indicates that a non-self-similar indenter is preferred. In the displacement-control situation, it shows the parameter identified using a flat or spherical indenter is more stable than those identified using a conical indentation, as shown clearly in
Figure 4c and e. This phenomenon is especially obvious when the force-controlled simulation type is used. Besides, the both the yield stress and strain hardening exponent identified using a flat indenter is better than those obtained from a spherical indenter.
However, when the displacement control type is used, the solution of inverse identified parameters shows strong sensitivity to the experiment error. In this situation, when
5% error disturbance are added on the original imprint, it can cause maximum −31.6% error of the inverse identified yield stress (e.g.,
Figure 3a using a conical indenter), and maximum +27.5% error of the inverse identified strain hardening exponent (e.g.,
Figure 4a using a conical indenter). In most cases, the inverse identified yield stresses shows larger than
10% error disturbances (e.g.,
Figure 3a,c,e). Therefore, the displacement-controlled type is not suggested in the determination of yield stress using instrumented indentation. While, this is not the case for the identification of strain hardening exponent when the flat or spherical indenter is used. In
Figure 4c,e, it shows the inverse identified strain hardening exponent is still very stable. The sensitivity results will be helpful for the design of indentation experiment in determining the plastic properties of materials using solely the residual imprint in indentation experiment.
Table 2 listed the comparison of the plastic properties of Al 2024-t3 obtained from indentation and uniaxial tests data. Here, the imprint is obtained from the spherical indenter and load-controlled experiment set-up. The maximum error of the plastic parameters are about 7.99% for the yield stress (Load-1, Test-3) and −4.16% for the strain hardening exponent (Load-2, Test-2). Result indicates the numerical approach established in our previous work [
2] is very effective. Besides, using the spherical indenter and load-controlled experiment set-up is able to give stable numerical results.


