Crack Tip Monitoring of Mode I and Mode II Delamination in CF/Epoxies under Static and Dynamic Loading Conditions Using Digital Image Correlation †

Abstract
:1. Introduction
2. Materials and Methods
2.1. Materials
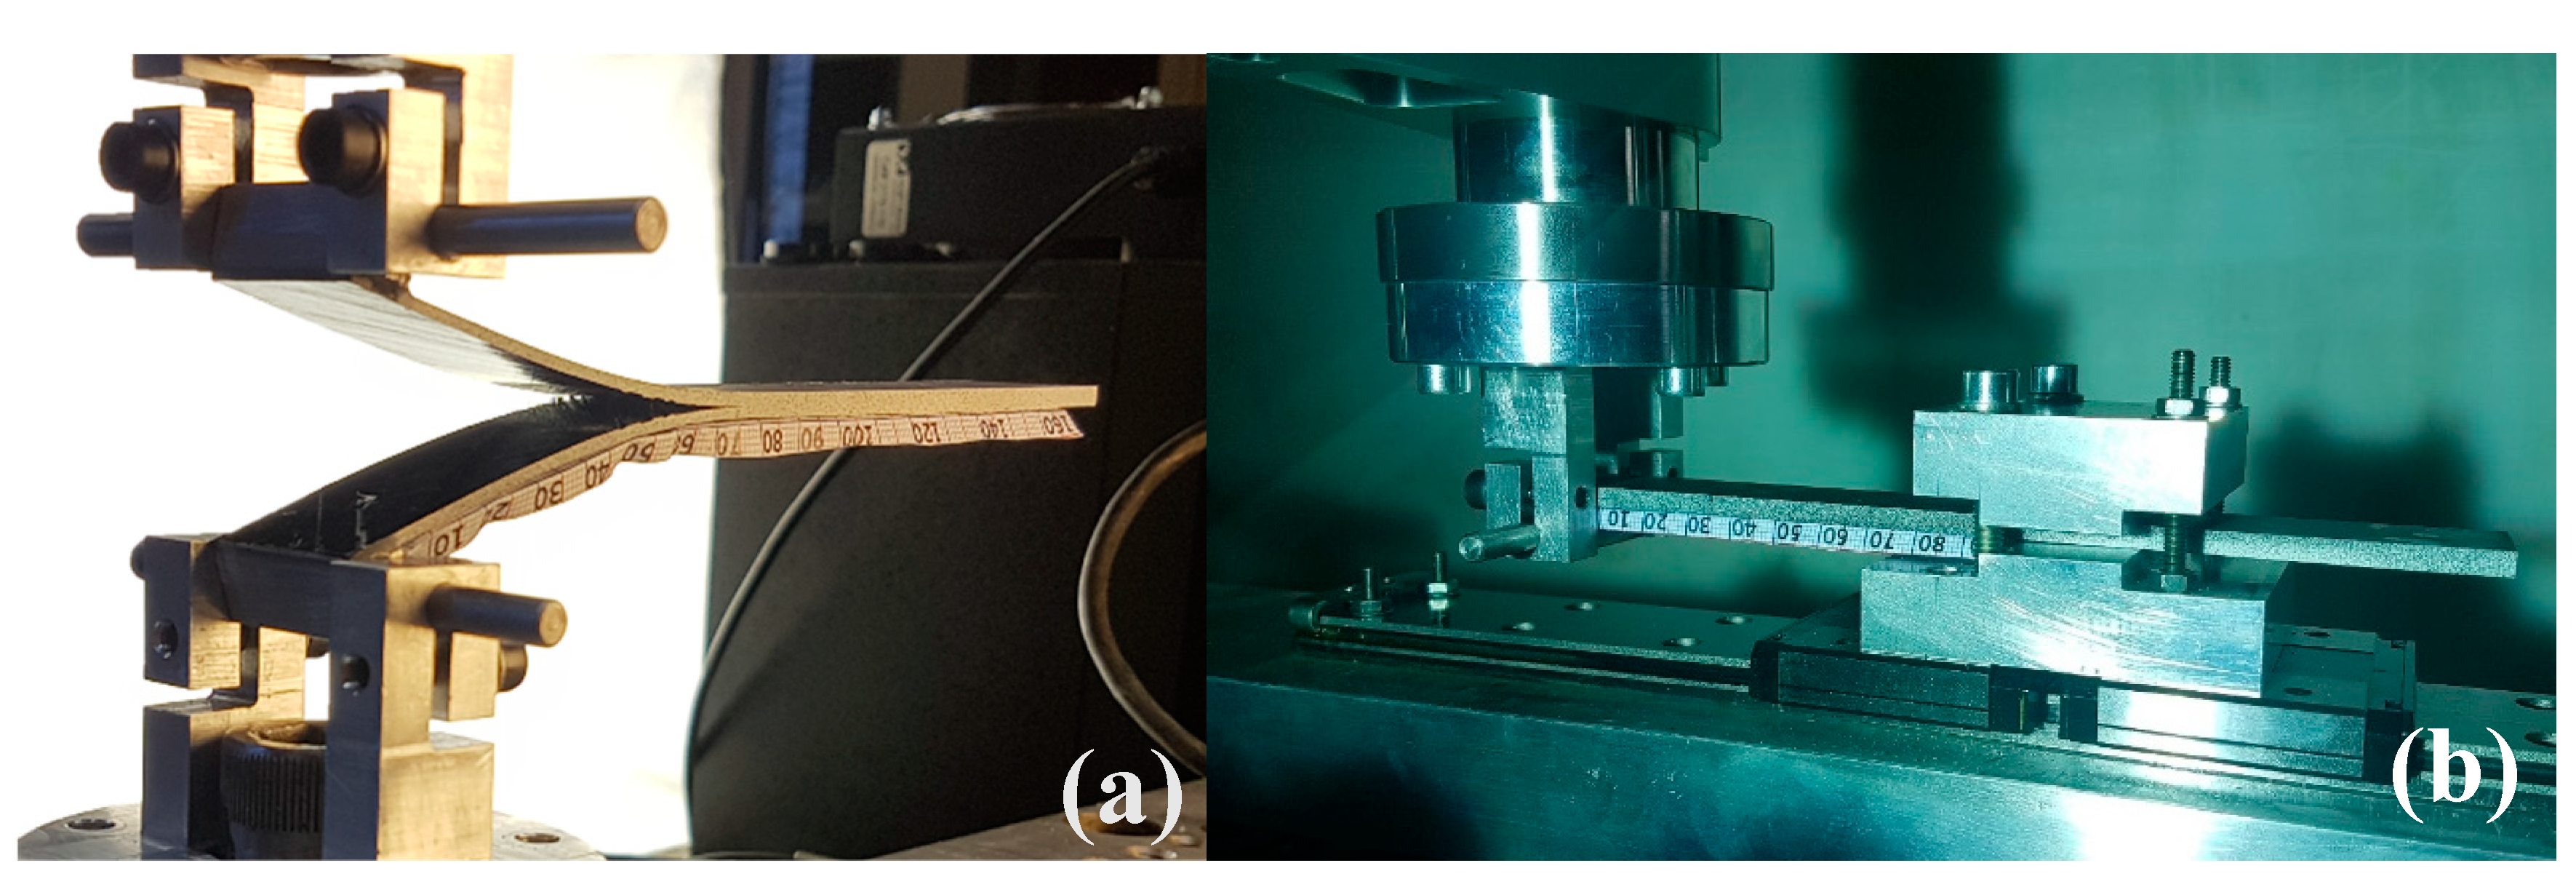
2.2. Test Methods
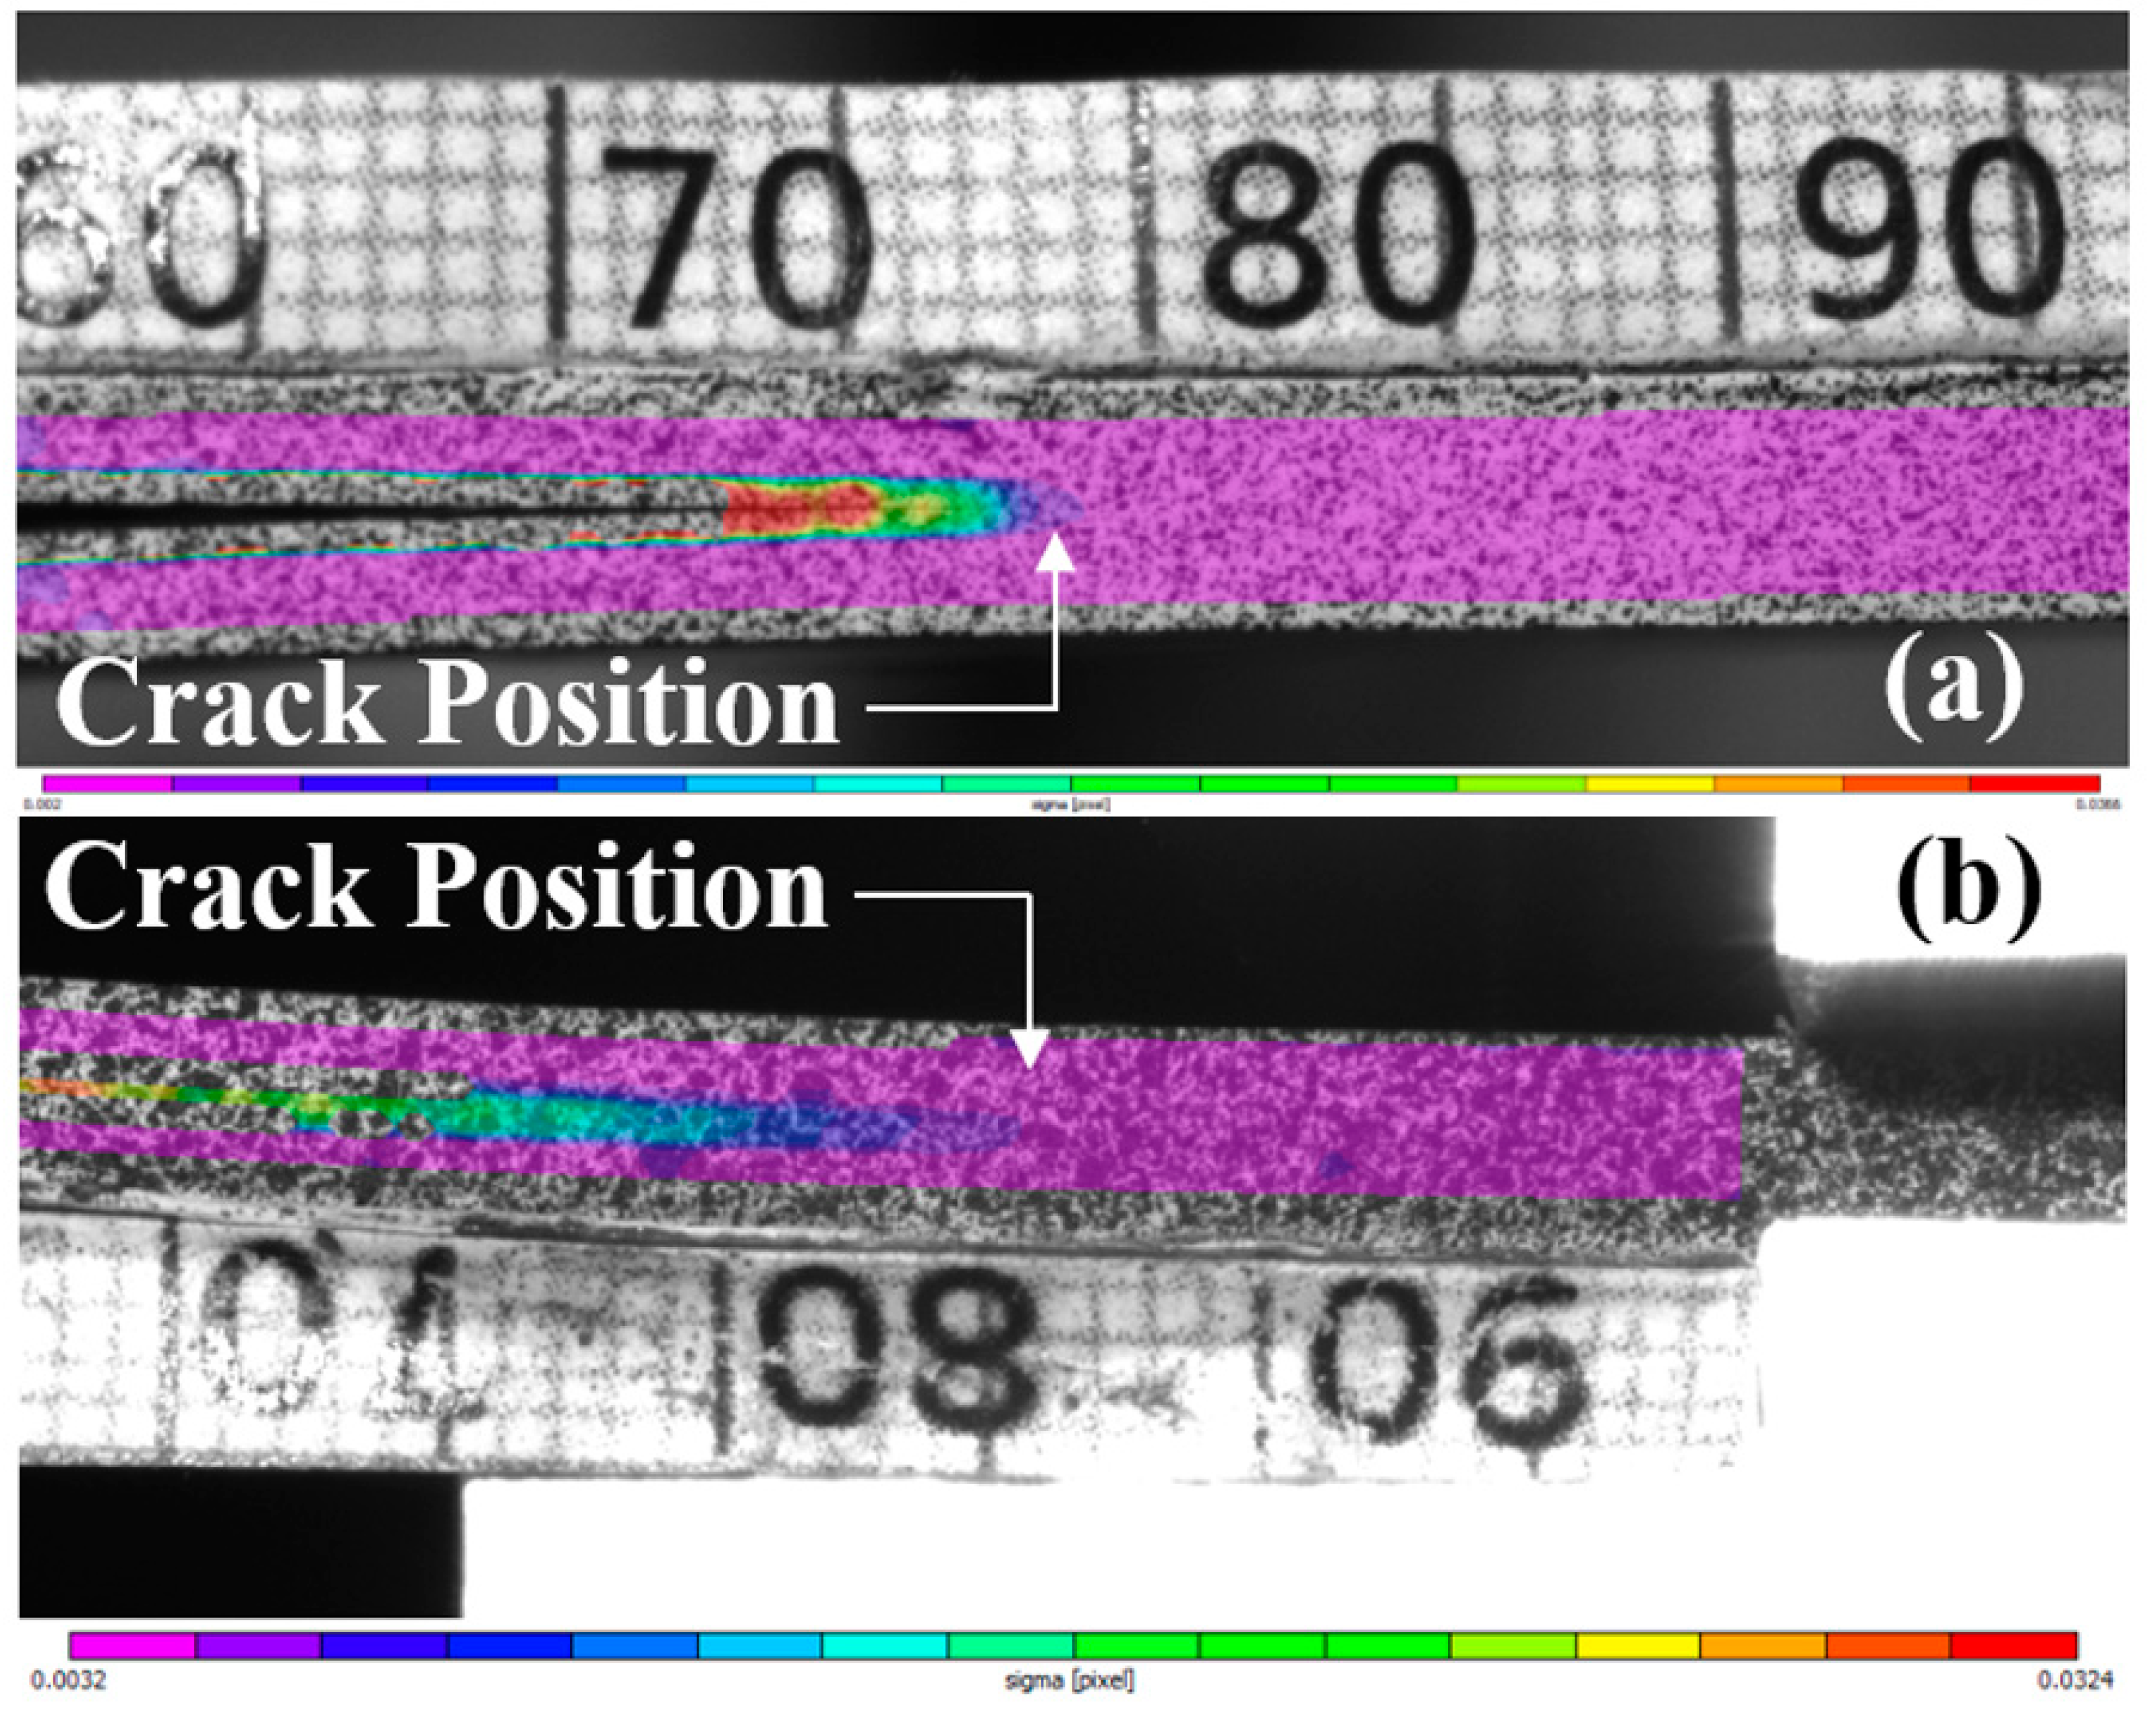
2.3. Digital Image Correlation
2.4. MATLAB Data Analysis
3. Results
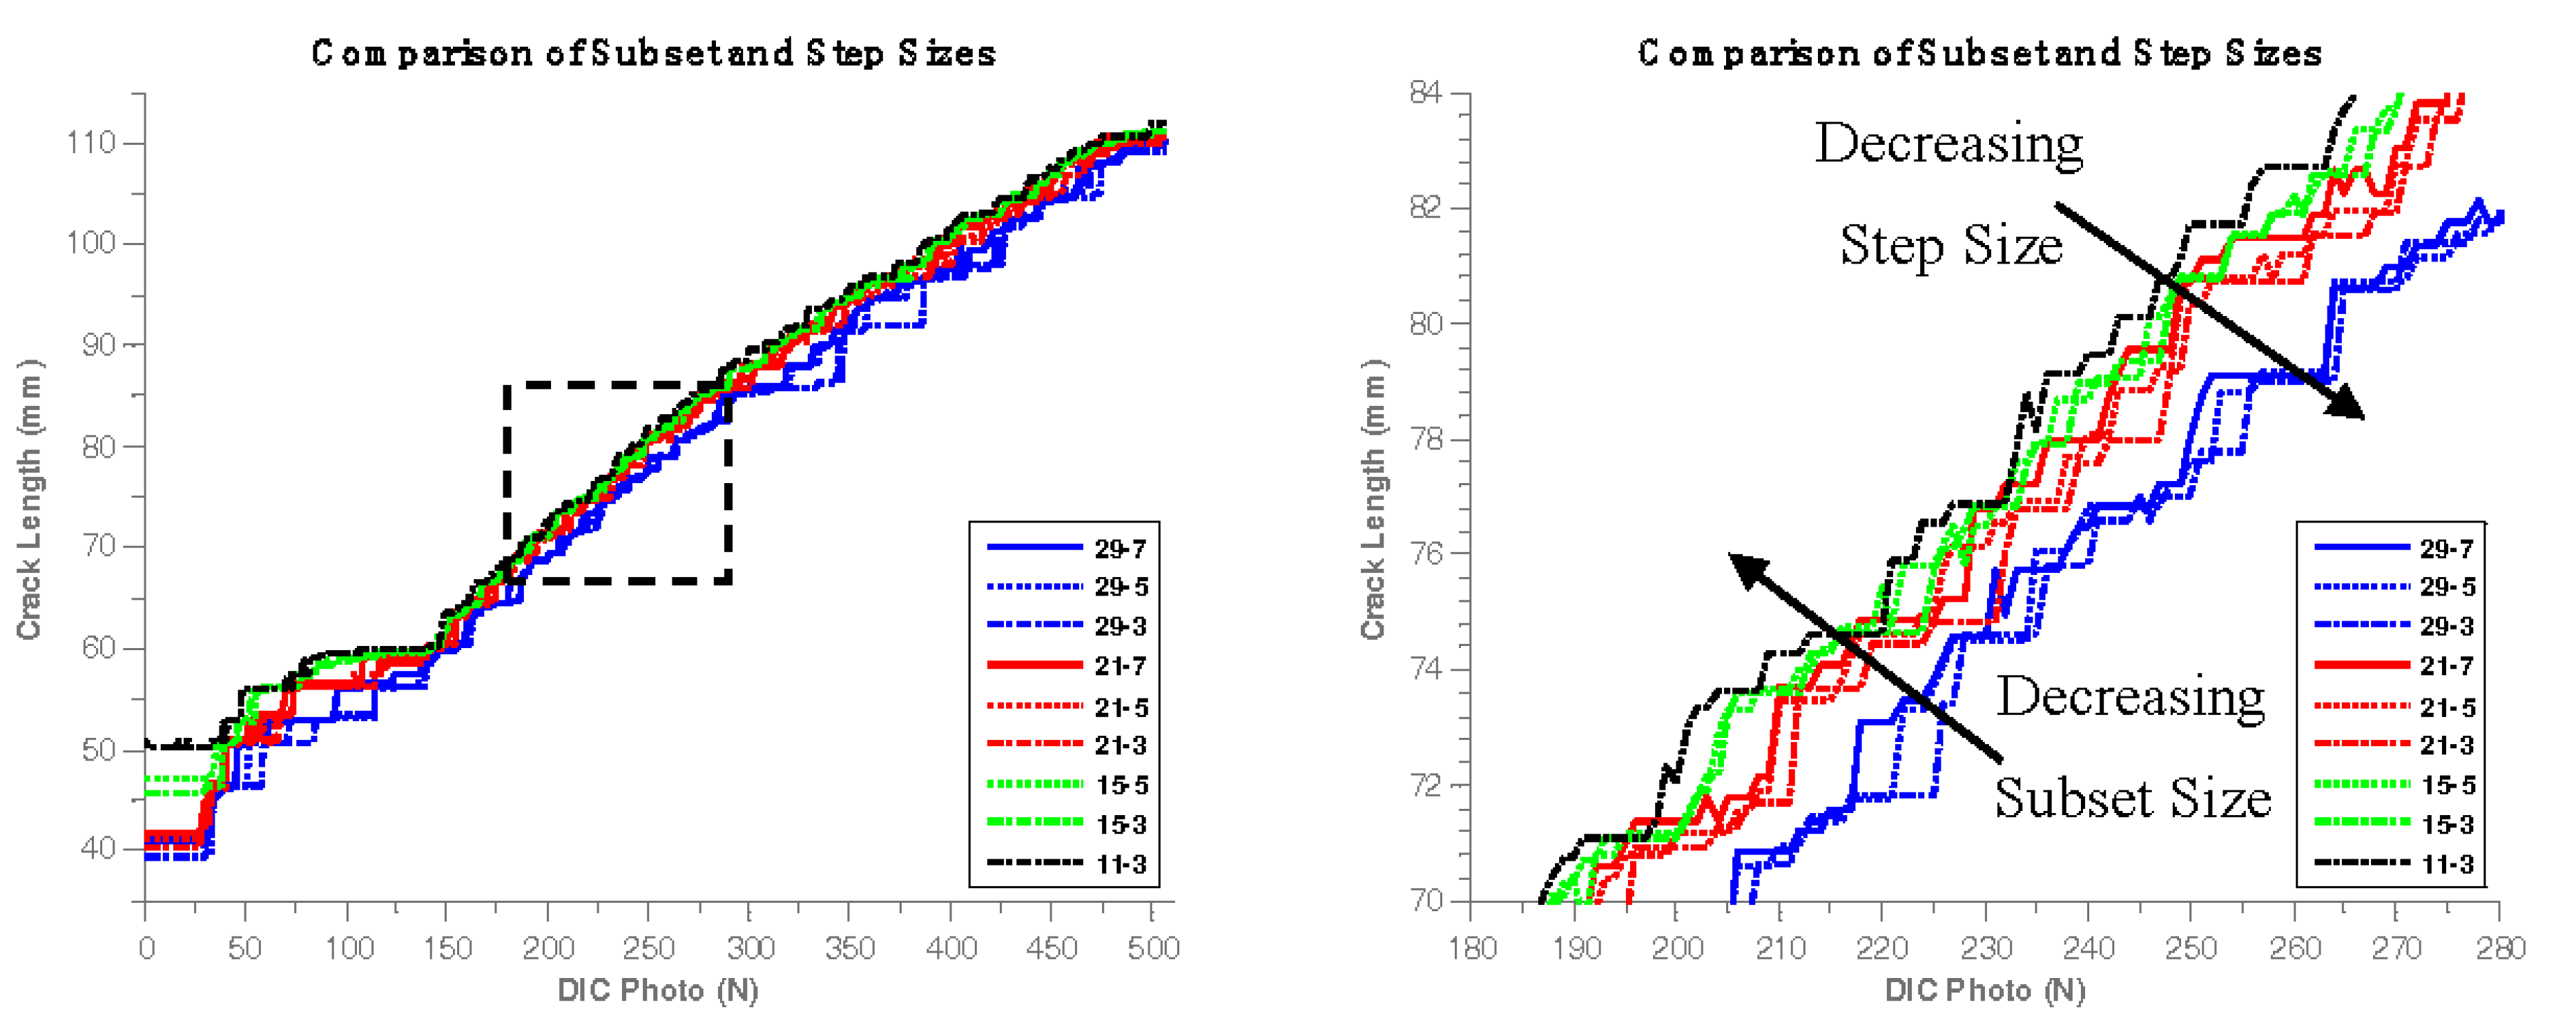
3.1. Subset and Step Size
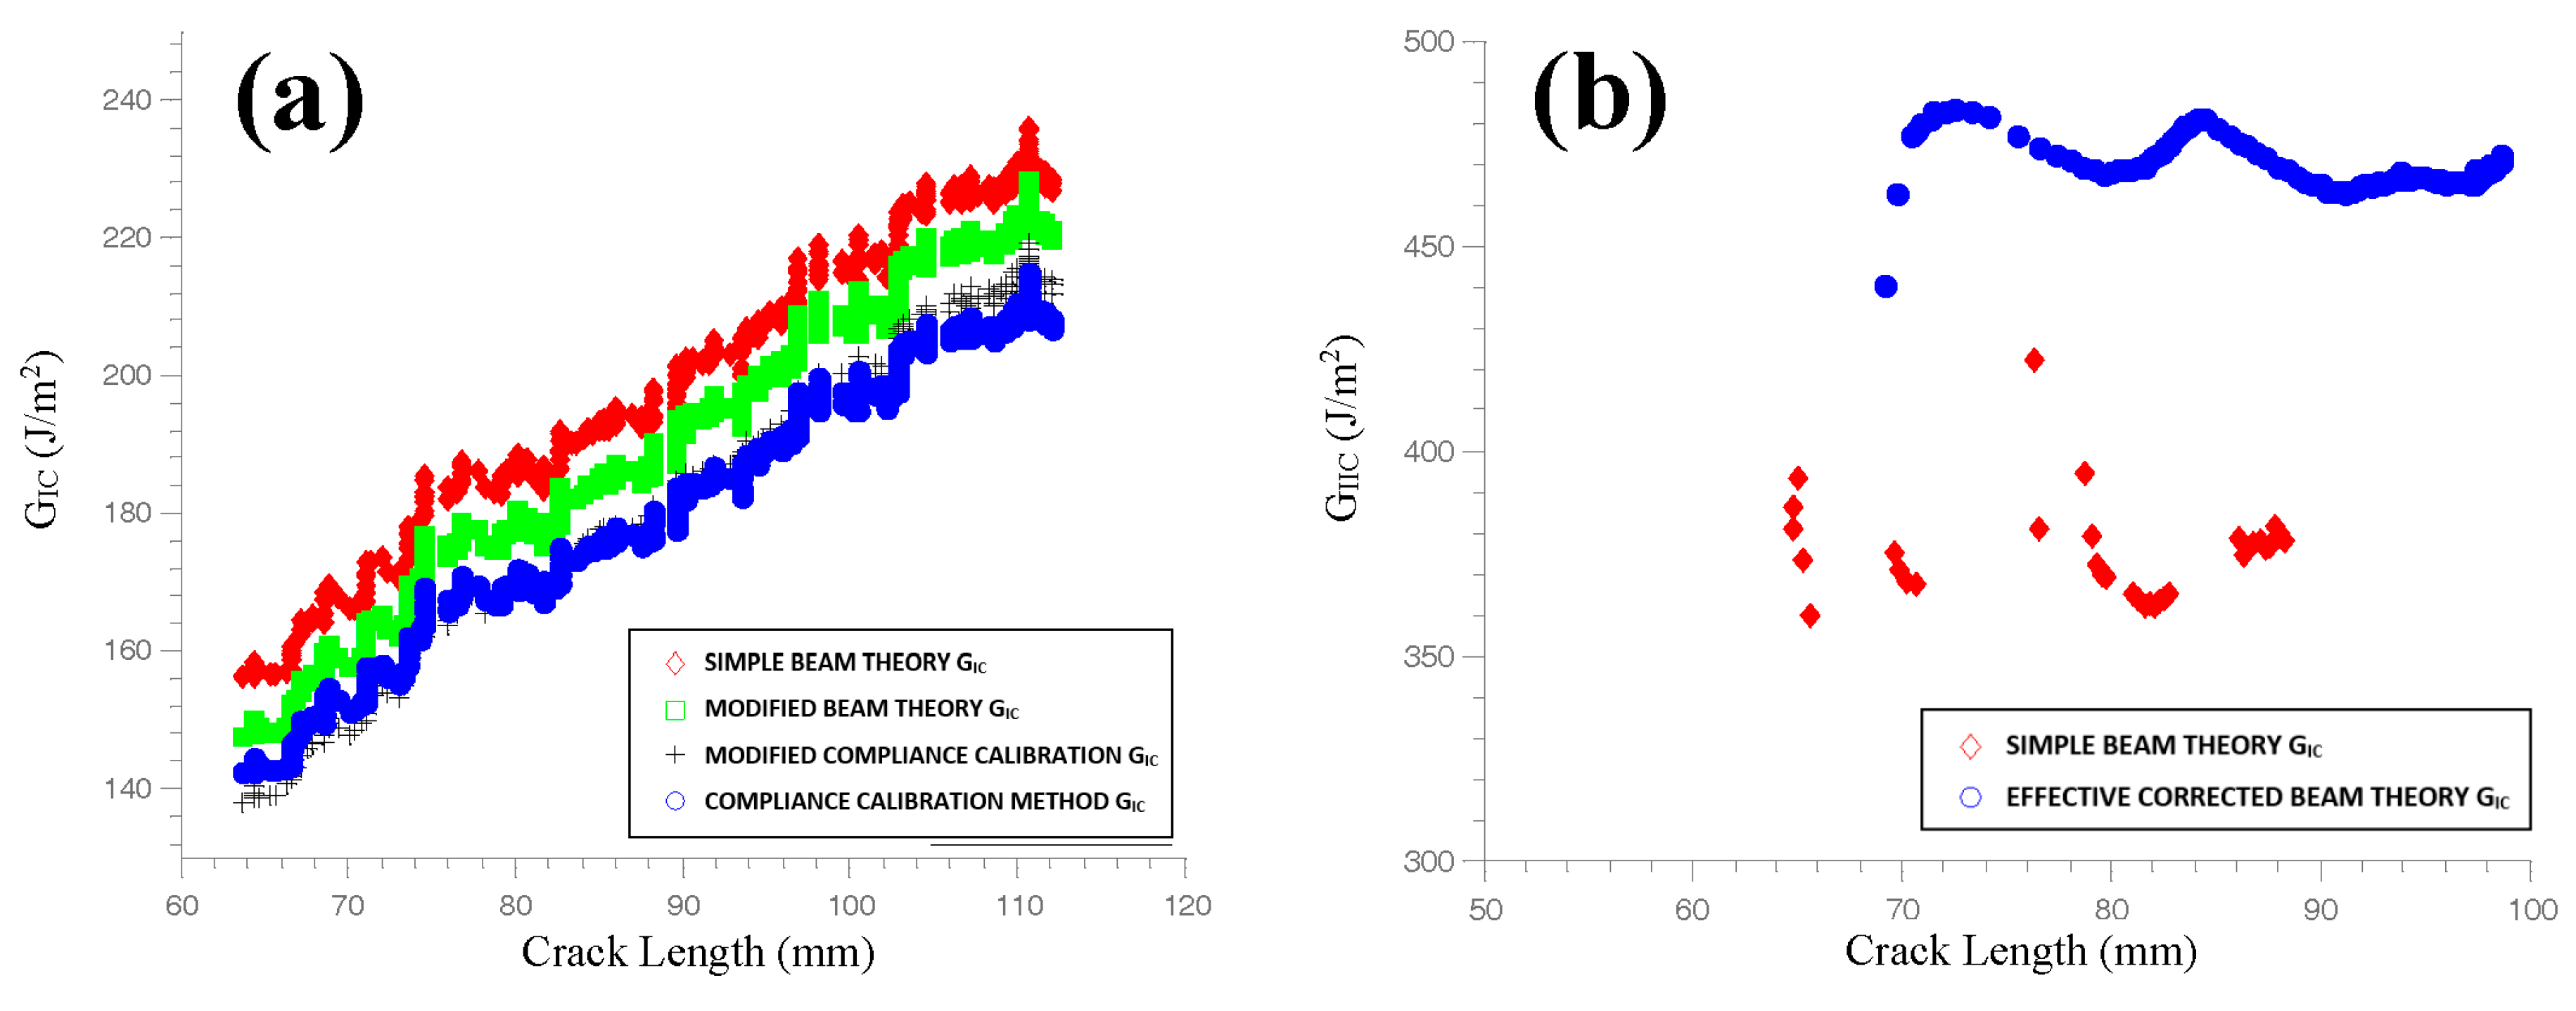
3.2. Static Test Results
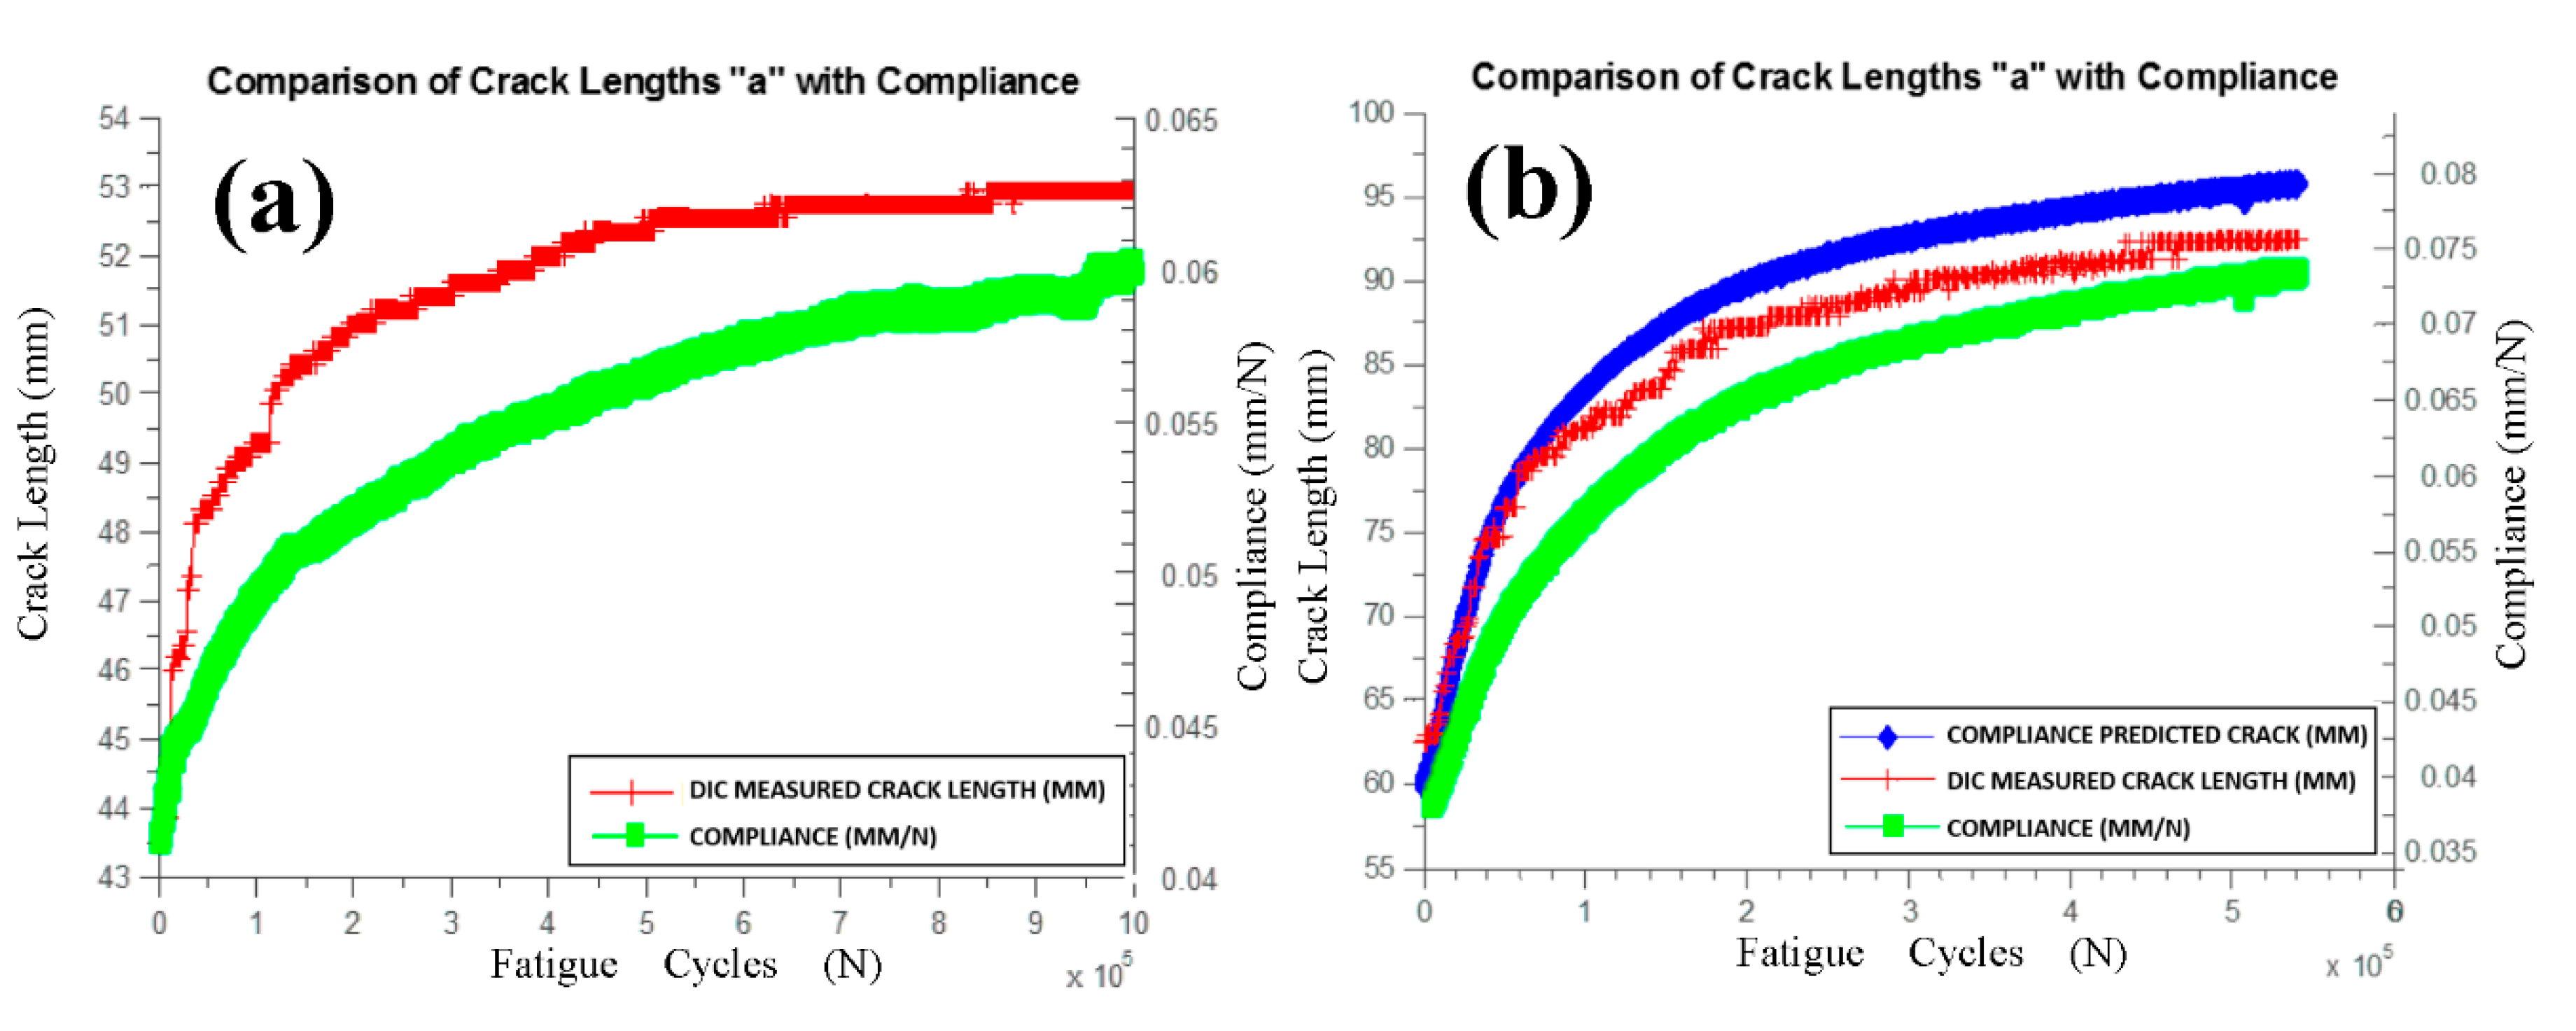
3.3. Fatigue Test Results
4. Discussion and Conclusions
Author Contributions
Acknowledgments
Conflicts of Interest
References
- Murri, G.B.; Martin, R.H. Effect of initial delamination on Mode 1 and Mode 2 interlaminar fracture toughness and fatigue fracture threshold. Compos. Mater. Fatigue Fract. 1991, 38, 239–256. [Google Scholar]
- O’Brien, T.K. Composite Interlaminar Shear Fracture Toughness, GIIC: Shear Measurement of Sheer Myth? NASA TM-110280; NASA Langley Research Center: Hampton, VA, USA, 1997. [Google Scholar]
- Brunner, A.J.; Murphy, N.; Pinter, G. Development of a standardized procedure for the characterization of interlaminar delamination propagation in advanced composites under fatigue mode I. loading conditions. Eng. Fract. Mech. 2009, 76, 2678–2689. [Google Scholar] [CrossRef]
- Lakshmi Aparna, M.; Chaitanya, G.; Srinivas, K.; Rao, J.A. Fatigue Testing of Continuous GFRP Composites Using Digital Image Correlation (DIC) Technique a Review. Mater. Today Proc. 2015, 2, 3125–3131. [Google Scholar] [CrossRef]
- Reiner, J.; Torres, J.P.; Veidt, M. A novel Top Surface Analysis method for Mode I interface characterisation using Digital Image Correlation. Eng. Fract. Mech. 2017, 173, 107–117. [Google Scholar] [CrossRef]
- ASTM D5528. Standard Test Method for Mode I Interlaminar Fracture Toughness of Unidirectional Fiber-Reinforced Polymer Matrix Composites. Am. Stand. Test. Meth. 2014, 3, 1–12. [Google Scholar]
- ISO Standard 15114-2014. Fibre Reinforced Plastic Composites—Determination of the Mode II Fracture Resistance for Unidirectionally Reinforced Materials Using the Calibrated End-Loaded Split (C-ELS) Test and an Effective Crack Length Approach; International Standards Organsiation: Geneva, Switzerland, 2014. [Google Scholar]
- Khan, R.; Alderliesten, R.; Yao, L.; Benedictus, R. Crack closure and fibre bridging during delamination growth in carbon fibre/epoxy laminates under mode I fatigue loading. Compos. Part A Appl. Sci. Manuf. 2014, 67, 201–211. [Google Scholar] [CrossRef]
- ASTM D6115. Standard test method for mode I fatigue delamination growth onset of unidirectional fibre-reinforced polymer matrix composites. Am. Soc. Test. Mater. 2001, 15, 1–6. [Google Scholar]

| Parameter | Value | Unit |
|---|---|---|
| Camera Quality | 5 | MP |
| Lenses | 23 | mm |
| Subset Size | 29–11 | Pixels |
| Step Size | 7–3 | Pixels |
| Pixel Resolution (x/y) | 0.03 | mm |
| Subset Resolution (x/y) | 0.87–0.33 | mm |
| Average Speckle Diameter | (Approx.) 0.12 | mm |
Publisher’s Note: MDPI stays neutral with regard to jurisdictional claims in published maps and institutional affiliations. |
© 2018 by the authors. Licensee MDPI, Basel, Switzerland. This article is an open access article distributed under the terms and conditions of the Creative Commons Attribution (CC BY) license (https://creativecommons.org/licenses/by/4.0/).
Share and Cite
Murray, B.R.; Fonteyn, S.; Carrella-Payan, D.; Kalteremidou, K.-A.; Cernescu, A.; Van Hemelrijck, D.; Pyl, L. Crack Tip Monitoring of Mode I and Mode II Delamination in CF/Epoxies under Static and Dynamic Loading Conditions Using Digital Image Correlation. Proceedings 2018, 2, 389. https://doi.org/10.3390/ICEM18-05225
Murray BR, Fonteyn S, Carrella-Payan D, Kalteremidou K-A, Cernescu A, Van Hemelrijck D, Pyl L. Crack Tip Monitoring of Mode I and Mode II Delamination in CF/Epoxies under Static and Dynamic Loading Conditions Using Digital Image Correlation. Proceedings. 2018; 2(8):389. https://doi.org/10.3390/ICEM18-05225
Chicago/Turabian StyleMurray, Brendan R., Sander Fonteyn, Delphine Carrella-Payan, Kalliopi-Artemi Kalteremidou, Anghel Cernescu, Danny Van Hemelrijck, and Lincy Pyl. 2018. "Crack Tip Monitoring of Mode I and Mode II Delamination in CF/Epoxies under Static and Dynamic Loading Conditions Using Digital Image Correlation" Proceedings 2, no. 8: 389. https://doi.org/10.3390/ICEM18-05225
APA StyleMurray, B. R., Fonteyn, S., Carrella-Payan, D., Kalteremidou, K.-A., Cernescu, A., Van Hemelrijck, D., & Pyl, L. (2018). Crack Tip Monitoring of Mode I and Mode II Delamination in CF/Epoxies under Static and Dynamic Loading Conditions Using Digital Image Correlation. Proceedings, 2(8), 389. https://doi.org/10.3390/ICEM18-05225