Abstract
The inflammation and lipid accumulation in the arterial wall represents a progressive disease known as atherosclerosis. In this study, a numerical model of atherosclerosis progression was developed. The wall shear stress (WSS) and blood analysis data have a big influence on the development of this disease. The real geometry of patients, and the blood analysis data (cholesterol, HDL, LDL, and triglycerides), used in this paper, was obtained within the H2020 SMARTool project. Fluid domain (blood) was modeled using Navier-Stokes equations in conjunction with continuity equation, while the solid domain (arterial wall) was modeled using Darcy’s law. For the purpose of modeling low-density lipoprotein (LDL) and oxygen transport, convection-diffusion equations were used. Kedem-Katchalsky equations were used for coupling fluid and solid dynamics.
1. Introduction
Atherosclerosis is a disorder in the function of the membrane (endothelium) of the first layer of the blood vessel that leads to accumulation of lipids in the intima layer of the blood vessel. Atherosclerosis starts with endothelial dysfunction and after that comes to accumulations of lipid, cholesterol, calcium and cell elements inside blood vessel wall (Figure 1).
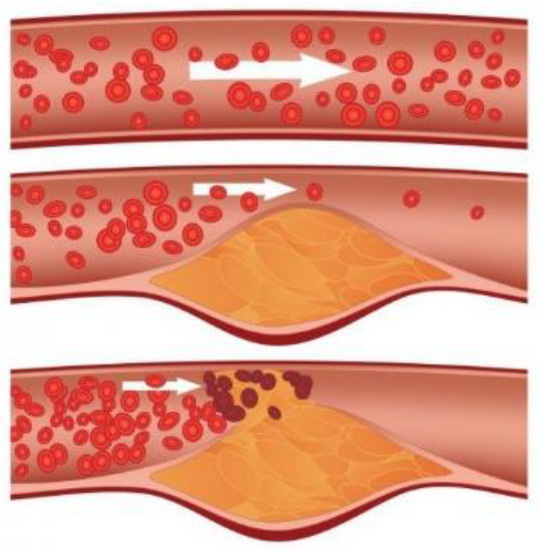
Figure 1.
The process of the formation of atherosclerosis.
There are many factors that influence the development of this disease. Some of them are high blood pressure, use of cigars, physical inactivity, obesity, age etc. In this work, finite element method was used to determine WSS and plaque concentration in the human coronary artery. For many years, the influence of the WSS on the occurrence of plaque and its further progression has been studied [1,2,3]. It was concluded that a low value of shear stress leads to dysfunction of the first layer of the vessel wall.
The purpose of this paper was to determine hemodynamic parameters such as mass flow and wall shear stress with computational fluid dynamics in the right coronary artery using patient-specific data obtained from computed tomography. Also, plaque concentration in the arterial wall was calculated. Coronary geometries of two patients were used.
Two time periods were analyzed: baseline (0 months) and follow-up (after 8 months). Plaque progression was performed using numerical approach. Mass transport of low density lipoprotein through the arterial wall was firstly described. Fluid motion in the lumen domain is described with Navier–Stokes equations, the fluid filtration with the Darcy law, while the Kedem–Katchalsky equations used for the solute flow between the lumen domain, endothelium and the first layer of the vessel wall–intima.
2. Materials and Methods
Computer Model
The fundamental equations for the low density lipoprotein transport through the lumen and solid domain and for plaque development are given within this section. Navier–Stokes equation (Equation (1)), and continuity equation (Equation (2)) of incompressible fluid was used for 3D blood flow:
where ul is blood velocity, pl is pressure, μ is blood dynamic viscosity and ρ is density [4,5]. Darcy’s Law for Newtonian fluids was used to model mass transfer across the wall of the blood vessel:
Low density lipoprotein transport in the lumen of the vessel was coupled with Kedem-Katchalsky equations (Equations (7) and (8)):
where Lp is the hydraulic conductivity of the endothelium, Δp is the pressure drop across the endothelium, Δπ is the oncotic pressure difference across the endothelium, Δc is the solute concentration difference across the endothelium, σd is the osmotic reflection coefficient, σf is the solvent reflection coefficient, P is the solute endothelial permeability, and is the mean endothelial concentration [6,7].
Three additional partial differential equations were used for solving the inflammatory process [8,9]:
where Ox represent oxidized lipoprotein transport or cw—the solute concentration in the wall, M is concentration in the intima of macrophages, S is concentration in the intima of cytokines, d1, d2, d3 are the corresponding diffusion coefficients, λ and γ are degradation and lipoprotein transport oxidized detection coefficients, and vw is the inflammatory velocity of plaque growth.
3. Boundary Conditions
Computer finite element model used here for performing simulations were generated using medical images (CT). There are 492 and 524 DICOM images for these models.
Previous figure, Figure 2, represents the process of obtaining a three-dimensional model using an automatic segmentation algorithm within the Materialize Mimics 10.01 software. Blood flow through the coronary artery was simulated using PAK solver [5]. Blood was considered as a Newtonian fluid with a dynamic viscosity of μ = 0.00365 Pas and incompressible with a density of ρ = 1050 kg/m3. Pulsatile coronary inlet velocity waveform was used (Figure 3). A three-dimensional mesh consists of 210,436 nodes and 175,982 elements, for the first geometry, and 204,364 nodes and 162,432 elements, for the second coronary geometry.

Figure 2.
3D model obtained using DICOM images.

Figure 3.
Pulsatile coronary inlet velocity waveform (adapted from [10]).
4. Results and Conclusions
3D simulation of blood flow through lumen and plaque progression in vessel wall was simulated. The bio molecular parameters such as LDL, HDL and triglycerides are used for the computer simulation, as well as adhesion molecules ICAM1, VCAM1 and E-Selectin (Table 1).

Table 1.
The bio molecular parameters and adhesion molecules for the patient #01.
The results of a first numerical analysis are shown in Figure 4. Figure 4a shows the result of the WSS distribution along the right coronary artery. The black circle indicates the zone of a low WSS value; mean value 0.43 to 0.59 Pa, measured in cross sections at distances 0.5 mm. At a length of 10 mm (black line), the value of the diameter ranges from 3.91 to 4.01 mm. At the same site, plaque concentration (Figure 4b) is determined where the highest measured value is 2.5 × 10⁻³ mg/mL. Further development of atherosclerosis leads to an increase in plaque volume, and to a decrease in lumen diameter. The maximum value of the WSS of the obtained geometry was 19.9 Pa (Figure 4c). The largest reduction in diameter is 1.77 mm, which represent a reduction of 65.7%. Numerical simulations have an increasing importance in medicine because in this way the site of plaque appearance can be determined, as well as its further propagation.

Figure 4.
Patient #01; baseline shear stress distribution (a); baseline plaque concentration (b); follow-up 1 shear stress distribution (c).
Table 2 shows the bio molecular parameters and adhesion molecules for patient #02. The results of a second numerical analysis are shown in Figure 5.
Table 2.
The bio molecular parameters and adhesion molecules for the patient #02.
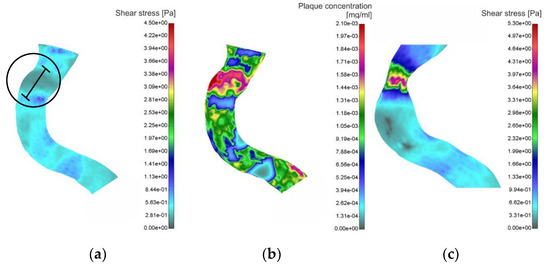
Figure 5.
Patient #02; baseline shear stress distribution (a); baseline plaque concentration (b); follow-up 1 shear stress distribution (c).
Previous figure, Figure 5a, shows the result of the WSS distribution along the segment of the right coronary artery. The black circle, as in the previous case, indicates the zone of a low WSS value; mean value 0.21 to 0.33 Pa, measured in cross sections at distances 0.5 mm. At a length of 10 mm (black line), the value of the diameter ranges from 3.07 to 3.28 mm. At the same site, plaque concentration (Figure 5b) is determined where the highest measured value is 2.1 × 10⁻³ mg/mL. Further development of atherosclerosis leads to an increase in plaque volume, and to a decrease in lumen diameter (Figure 5c). The maximum value of the WSS of the obtained geometry was 5.3 Pa. The largest reduction in diameter is 2.12 mm, which represent a reduction of 35.3%.
Figure 6 shows how the plaque increases in time and also the decrease of lumen diameter in the case of patient #02.
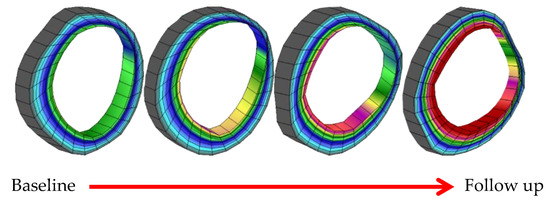
Figure 6.
Plaque progression in time for patient #02.
Cardiovascular disease is responsible for a large percentage of mortality in many countries. Great attention is paid to the prevention of this disease. In this study three-dimensional simulations were investigated in order to determine hemodynamic parameter such as wall shear stress with computational fluid dynamics in the coronary artery using patient-specific data from computed tomography. Also, plaque concentration in the arterial wall was calculated. Two time moments were observed: baseline (0 months) and follow-up 1 (after 8 months). The results of the performed analyzes have shown that sites with lower shear stress values were correlated with the sites of plaque accumulation measurements. By knowing bio-molecular parameters such as LDL, HDL and triglycerides, it is possible to predict the sites of plaque occurrence as well as concentration in certain places of the artery using computer simulation.
Acknowledgments
This research was supported by the grants: EC HORIZON2020 689068 SMARTool, and III41007 and ON174028 Ministry of Education, Science and Technological Development of Serbia.
References
- Filipovic, N.; Rosic, M.; Tanaskovic, I.; Milosevic, Z.; Nikolic, D.; Zdravkovic, N.; Peulic, A.; Kojic, M.; Fotiadis, D.; Parodi, O. ARTreat project: Three-dimensional Numerical Simulation of Plaque Formation and Development in the Arteries. Inf. Technol. Biomed. 2011, 16, 272–278. [Google Scholar] [CrossRef] [PubMed]
- Caro, C.G.; Fitz-Gerald, J.M.; Schroter, R.C. Atheroma and arterial wall shear observation, correlation and proposal of a shear-dependent mass transfer Mechanism for Atherogenesis. Proc. R. Soc. Lond. 1971, 177, 109–159. [Google Scholar] [PubMed]
- Giannogolou, G.D.; Soulis, J.V.; Farmakis, T.M.; Farmakis, D.M.; Louridas, G.E. Haemodynamic factors and the important role of local low static pressure in coronary wall thickening. Int. J. Cardiol. 2002, 86, 27–40. [Google Scholar] [CrossRef]
- Filipovic, N.; Kojic, M.; Ivanovic, M.; Stojanovic, B.; Otasevic, L.; Rankovic, V. MedCFD, Specialized CFD Software for Simulation of Blood Flow through Arteries; University of Kragujevac: Kragujevac, Serbia, 2006. [Google Scholar]
- Kojic, M.; Filipovic, N.; Stojanovic, B.; Kojic, N. Computer Modeling in Bioengineering: Thеoretical Background, Examples and Software; John Wiley and Sons: Chichester, UK, 2008. [Google Scholar]
- Kedem, O.; Katchalsky, A. A physical interpretation of the phenomenological coefficients of membrane permeability. J. Gen. Physiol. 1961, 45, 143–179. [Google Scholar] [CrossRef] [PubMed]
- Kedem, O.; Katchalsky, A. Thermodynamic analysis of the permeability of biological membranes to non-electrolytes. Biochim. Biophys. 1958, 27, 229–246. [Google Scholar] [CrossRef]
- Calvez, V.; Ebde, A.; Meunier, N.; Raoult, A. Mathematical modelling of the atherosclerotic plaque formation. ESAIM Proc. 2008, 28, 1–12. [Google Scholar] [CrossRef]
- Boynard, M.; Calvez, V.; Hamraoui, A.; Meunier, N.; Raoult, A. Mathematical modelling of earliest stage of atherosclerosis. In Proceedings of the COMPDYN 2009—SEECCM 2009, Island of Rhodes, Greece, 22–24 June 2009. [Google Scholar]
- Johnston, B.M.; Johnston, P.R.; Corney, S.; Kilpatrick, D. Non-Newtonian blood flow in human right coronary arteries: Transient simulations. J. Biomech. 2005, 39, 1116–1128. [Google Scholar] [CrossRef] [PubMed]
Publisher’s Note: MDPI stays neutral with regard to jurisdictional claims in published maps and institutional affiliations. |
© 2018 by the authors. Licensee MDPI, Basel, Switzerland. This article is an open access article distributed under the terms and conditions of the Creative Commons Attribution (CC BY) license (https://creativecommons.org/licenses/by/4.0/).