1. Introduction
Land cover analysis and classification is essential for various environmental and mapping applications. Land classification yields thematic maps that integrate land cover materials. Sentinel-2 data has gained leverage in the remote sensing community due to its high spatial and high temporal resolution. The Sentinel-2 multispectral high-resolution sensor (MSI) operates on thirteen different bands, of which four have a resolution of ten meters, six have a resolution of twenty meters and three have a resolution of sixty meters. Hence, Sentinel-2 data provide information on the reflectance of the land surface for many different wavelengths on a local and regional scale. Regardless of the sensor’s spectral resolution, these images are challenged by the presence of mixed pixels, which depict mixtures of distinct materials.
Each mixed pixel is associated with the electromagnetic reflection of various materials measured in numerous spectral bands belonging to the surface depicted by the pixel. These measurements constitute the spectral signature of the pixel. Two processes are fundamental in the analysis, namely (a) the detection of the constituent components of mixed pixels as well as the proportions in which they appear; and (b) the identification of homogeneous regions. The first objective is tackled via spectral unmixing and the second via the use of classification algorithms.
Classification [
1,
2,
3,
4] partition the set of pixels from the input image into compact, homogeneous groups. It is performed in either a supervised or unsupervised manner, usually operating in the spectral signatures of the pixels. Hitherto, the mixed surface features are tackled by supervised classification approaches, which require the availability of a labeled set of pixels. These pixels form the training set that is used to teach the classifier the underlying pixel classification task in order to further classify the unlabeled pixels. Popular classification methods proposed in the literature include the nearest neighbor classifier [
5,
6] and support vector machines (SVMs) [
7].
Several classification methods have been applied to Sentinel-2 images. In this work, we assess the performance of a recently proposed classification method [
2], originally proposed for hyperspectral images on Sentinel-2 data. The main idea of the methodology is to first perform spectral unmixing based on a asuitably selected set of endmembers and represent each pixel by its associated abundance vector (constituted from the corresponding abundance values). Then, the classification of the pixels is performed on the abundance vectors of the pixels and not on their spectral signatures (two supervised and one unsupervised classification algorithm are utilized). To assess the performance of the adopted methodology on Sentinel-2 data, we compared it with a case where spectral signature pixel representations are considered. To the best of our knowledge, this is the first attempt to utilize a combination of both spectral unmixing and classification tasks on Sentinel-2 data.
The area on which the methodology was assessed is the Northern Pindos National Park, Greece (Sentinel-2 data).
Section 2 describes the adopted algorithm.
Section 3 demonstrates the results obtained using ad-hoc classification algorithms utilizing spectral signatures and abundance representations. The conclusions are summarized in
Section 4.
2. Methods
2.1. Test Area
The test area is a specified region of the Northern Pindos National Park in north-western Greece. This region is the largest protected forestry region in Greece, with high topographical diversity. The image has a resolution of 30 m consisting of 333 × 333 pixels. We utilized the image at 30 m resolution instead of the one at 10 m resolution in order to compare the results obtained by the proposed algorithm with the reference classification map provided at 30 m resolution [
6]. The image depicts the artificial lake of Aoos north-west of Metsovo and a small part of the mountains of Pindos. The region is dominated by grassland, prickly oaks and hornbeams, beech, black pine and deciduous oak. The verge of the mountain slope is covered by Bosnian pine. Human agricultural activities are also present along the water basin. The image is atmospherically corrected and this process yielded a reduction of the number of bands from 13 to 10; band 1 (443 nm), band 9 (945 nm) and band 10 (1375 nm) were removed. Four basic classes, namely water, dense vegetation, soil and sparse vegetation are specified.
2.2. Adopted Methodology
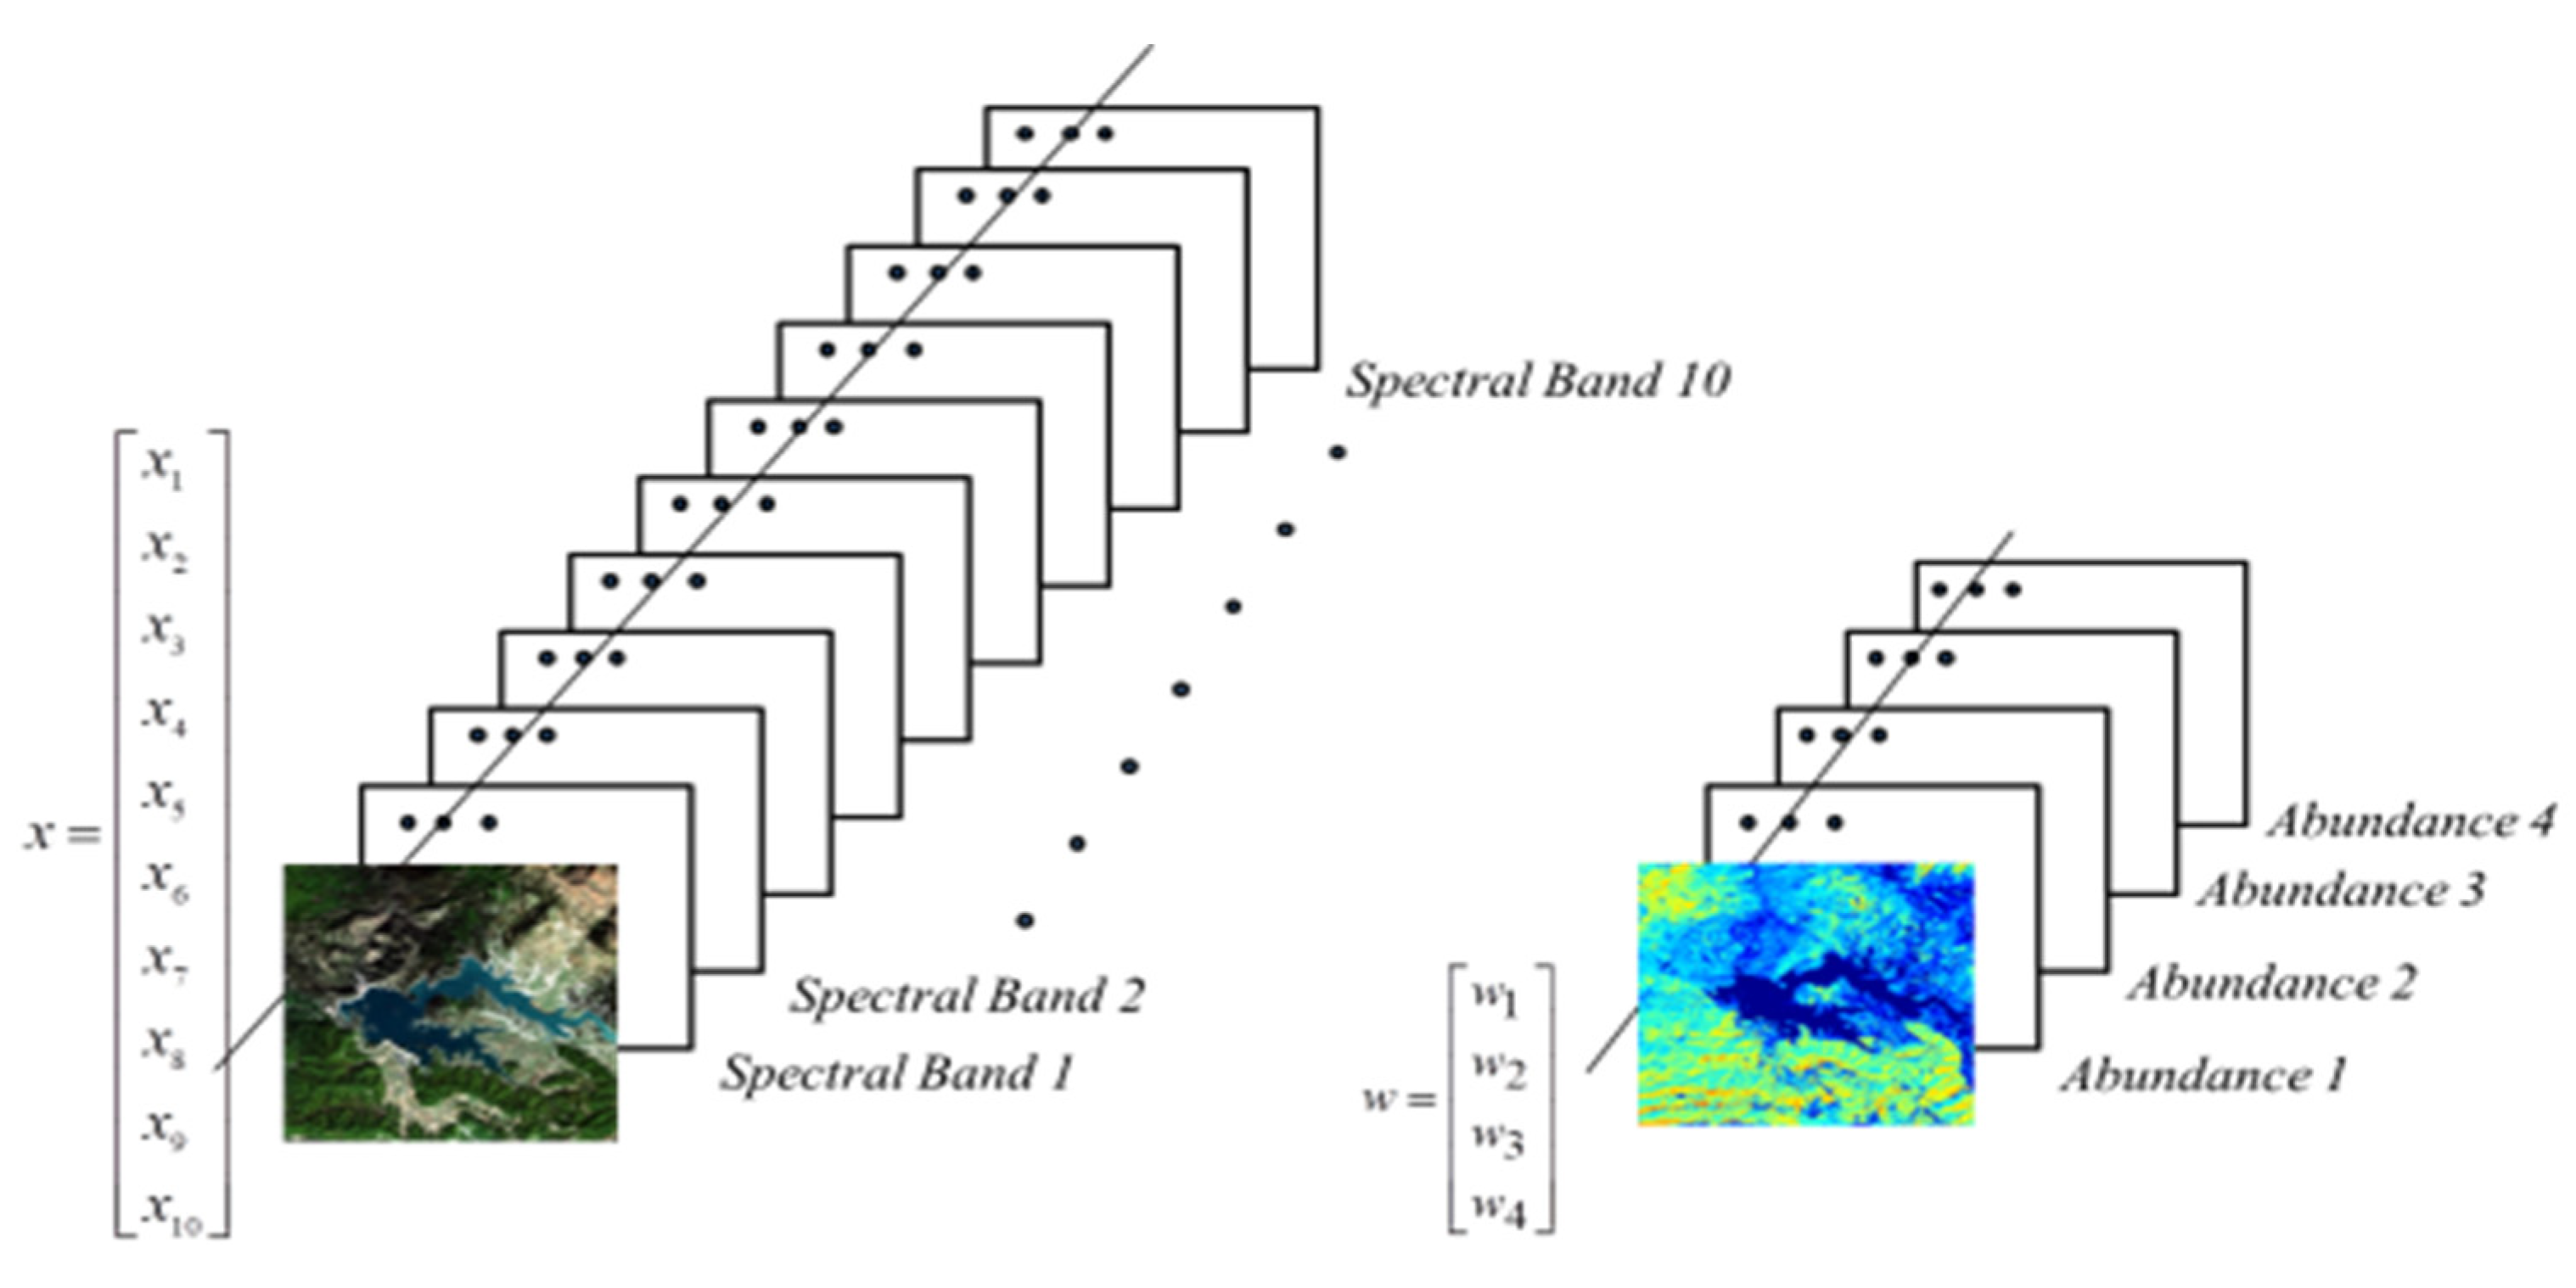
The adopted methodology is motivated by the properties of the abundance of ground materials present in the pixels of a Sentinel-2 image. Each pixel is represented by a vector of ten spectral bands and the original space is reshaped to the dimensionally-reduced space of the abundance. (see
Figure 1). In addition, since the abundance representation of a pixel unveils sub-pixel level information, this allows the proposed algorithm to identify possible refined structures within each region, which is usually not available in ground truth maps.
The scope was to employ first endmember extraction (EE) by identifying spectrally homogeneous regions (regions of interest, ROIs) and extracting the mean endmembers of the image based on the collected ROIs. Secondly, we employed a Spectral Unmixing method that is based on the endmembers extracted by EE, in order to produce the abundance fractions for each pixel, which in turn form the so-called abundance vector of the pixel. These vectors from all pixels were fed into the classification process, which groups pixels according to the abundance representations.
2.2.1. A. EE
With the aim of selecting representative endmembers for each class, suitable regions of interest (
ROIs) were selected. In our experiments we used the four main land cover classes, namely (a) water; (b) dense vegetation; (c) soil; and (d) sparse vegetation. All endmembers were calculated as the average values of the spectral signatures of the pixels in each ROI.
Figure 2 depicts (a) the appropriate ROIs selected on the Sentinel-2 image and (b) the endmembers of the four main classes: water, dense vegetation, soil, sparse vegetation.
2.2.2. B. SU
The selection of the appropriate endmembers is crucial in order to correctly estimate the abundance fractions. The spectral signature of the pixel, denoted by
x, is assumed to follow the linear mixing model (LMM). This adopts the hypothesis that the spectrum of a mixed pixel is a linear combination of its endmembers’ spectra, as follows:
where
is the mixing matrix comprising the endmembers’ spectra in its columns (
L-dimensional vectors
);
w is a
vector consisting of the corresponding abundance fractions, named abundance vector; and
n is an
additive noise vector, which is assumed to be a zero-mean Gaussian distributed random vector with independent and identically distributed elements.
The abundance fractions for each pixel should be non-negative and sum to one. The abundance vector for each pixel is estimated via a variational Bayes algorithm, called BiICE, which is based on an appropriately-defined hierarchical Bayesian model [
8]. In algorithmic form, the abundance vector can be written as:
BiICE is computationally efficient, provides sparse solutions without requiring the fine-tuning of any parameters and converges fast to accurate values even for highly-correlated data. The determined abundance vector w is further used for each pixel representation in the classification process. The abundance representations resulting from BiICE were then fed into the classification process.
2.2.3. C. Classification
The classification was carried out in both supervised and unsupervised terms. Sepcifically, for the former case the nearest-neighbour classifier (NN) was employed, where every training example is stored with its label and a prediction is made for a test example by computing its distance to every training example. In addition to NN, SVMs were also utilized since they show, in general, superior performance to other classification methods. The advantage of an SVM is that it successfully works with a small number of training samples. Finally, for the unsupervised case, a clustering algorithm, called the online adaptive possibilistic c-means (OAPCM), is exploited [
9]. In OAPCM, pixels are processed one-by-one and their impact is memorized to suitably defined parameters. Hence, the algorithm is flexible in tracking variations during the clustering formation. OAPCM starts with zero clusters and during evolution it creates new clusters or merges existing ones.
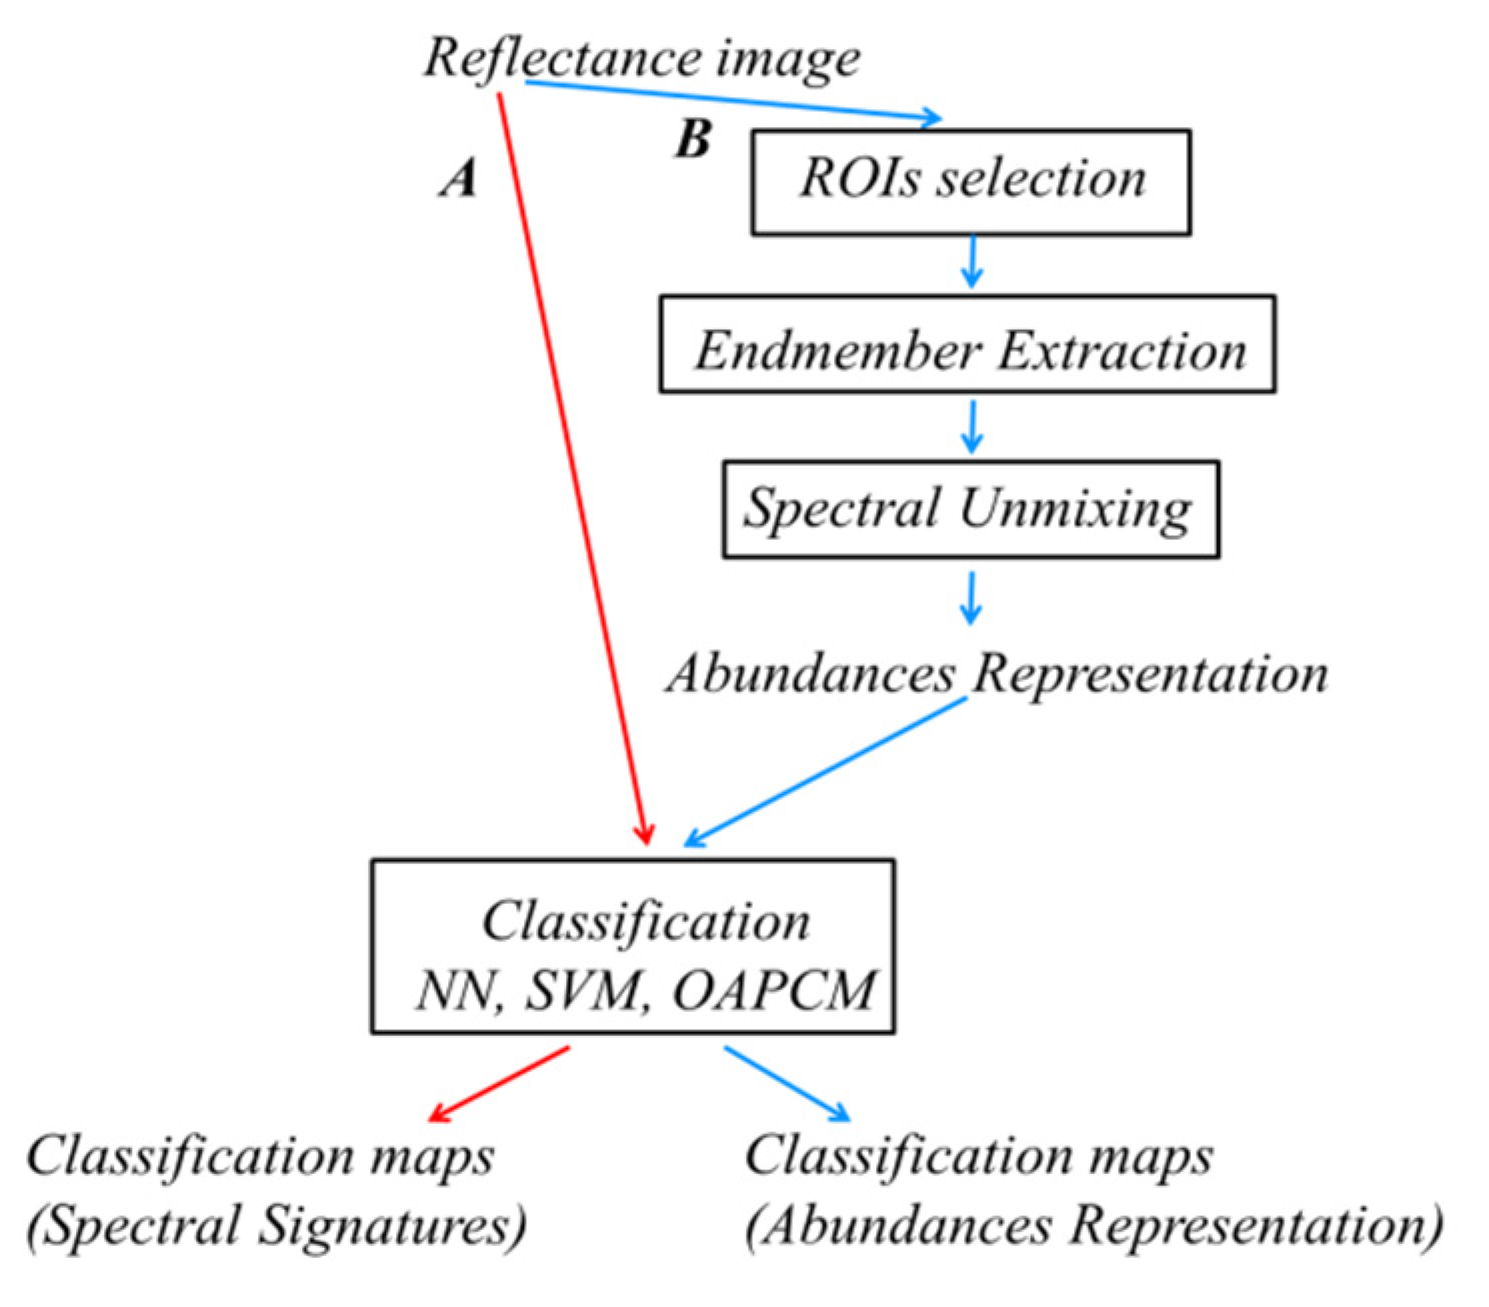
Figure 3 depicts a flowchart of the two case studies: (A) spectral signature classification; and (B) abundance representation classification.
3. Results and Discussion
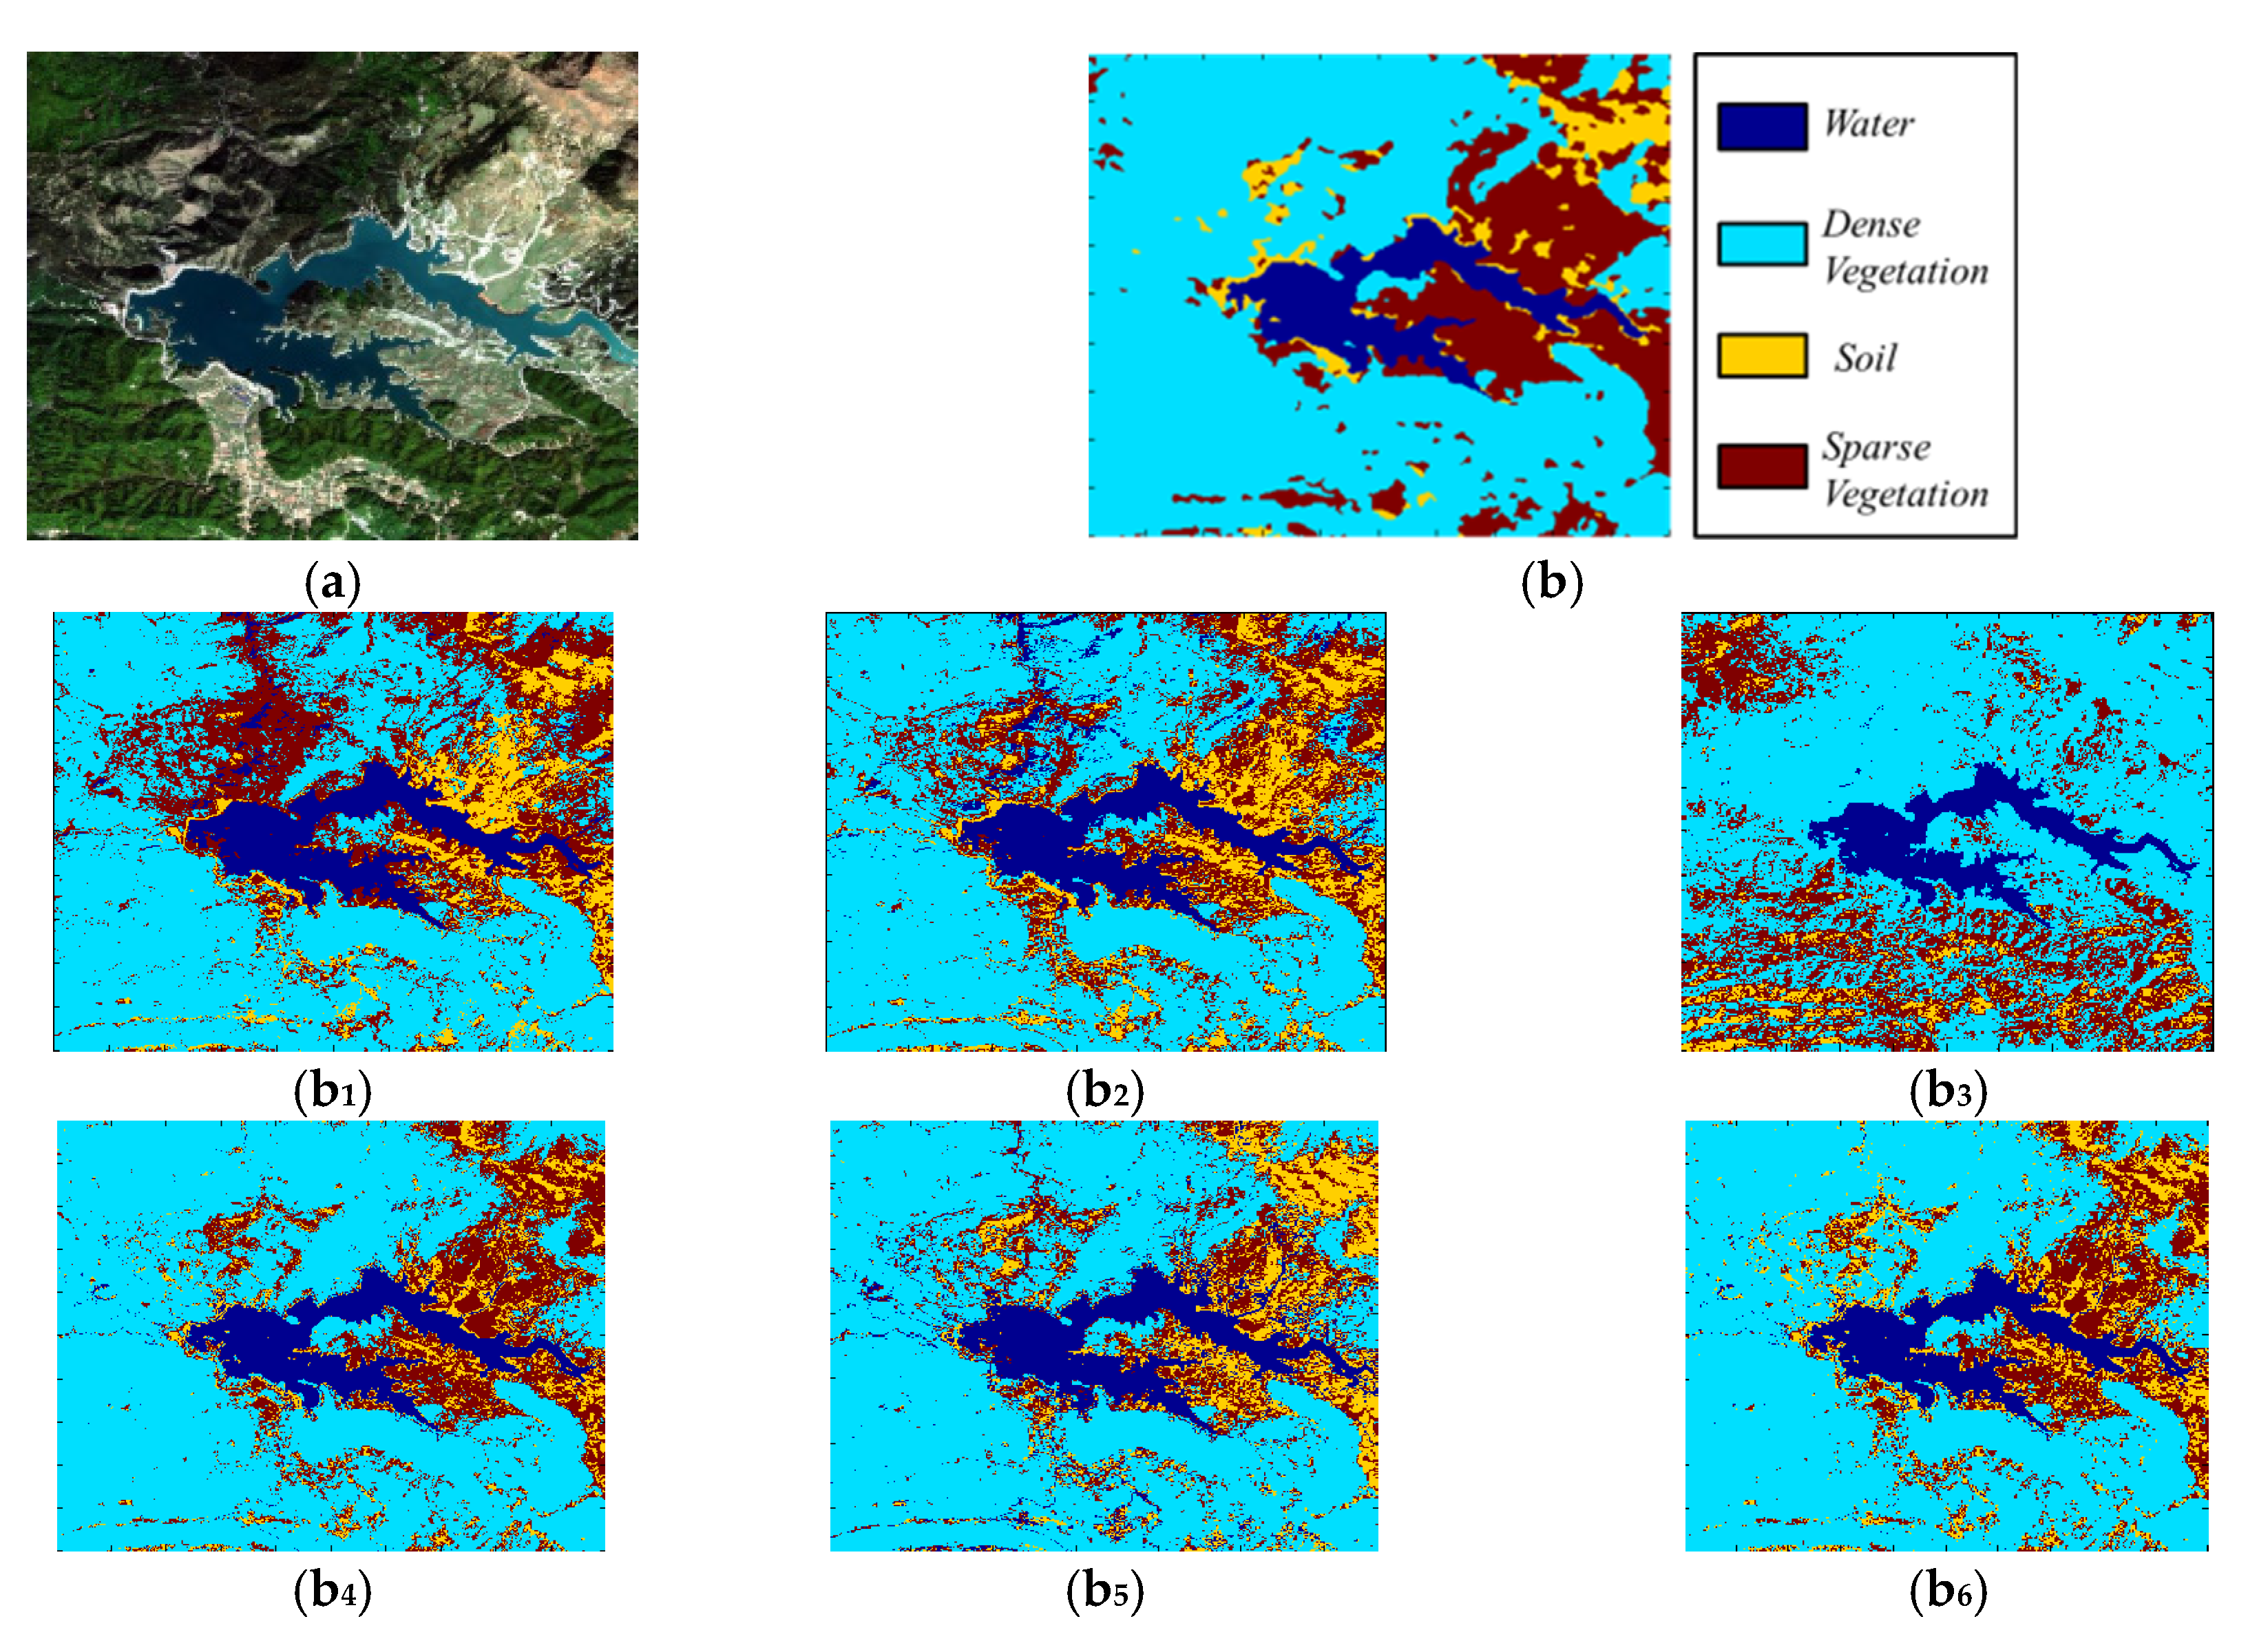
Aiming to achieve a quantitative evaluation, the ad-hoc classification approaches proposed in the literature, such as the nearest neighbor (NN) classifier, support vector machines (SVMs) and the unsupervised OAPCM algorithm, were utilized. The obtained results (classification maps) were validated in terms of accuracy based on the obtained confusion matrix, as can be seen in
Table 1 and
Table 2. In both cases of supervised classification (NN, SVM), the four endmembers extracted in the EE process were used to train the classifiers, whereas the remaining pixels were used for validation. It should be noted that, in the case where the abundance representations are used as the input for classification, spectral unmixing was applied to the four endmembers as well as to the remaining pixels. The abundance representations were used to train the classifiers. As a result, classification maps were generated, providing information of the area of each land class. The classification utilizing the abundance representation (see
Figure 3 case study B) achieved an average accuracy that was higher than the classification utilizing the spectral signatures (see
Figure 3 case study A). The water and soil classes were successfully identified by the two case studies, since the average classification accuracies were similar. However, the dense vegetation and sparse vegetation classes were not successfully identified. The results are shown in
Figure 4.
4. Conclusions
The objective of this study was to assess the performance of a methodology that was successfully applied to hyperspectral Sentinel-2 data when supervised and unsupervised classification approaches were employed. The advantage of this methodology is that it integrates the abundance representation instead of the basic spectral signature representation of the pixels. The abundance representation provides sub-pixel level information and is in principle capable of the more accurate mapping of land cover. The adopted methodology was experimentally evaluated on a Sentinel-2 image of Northern Pindos National Park (Greece), which comprises water, vegetation (dense and sparse) and bare soil areas. The performance of the (two supervised and one unsupervised) classification algorithms proposed in the literature utilizing abundance representations were compared with the same algorithms utilizing spectral signatures in terms of accuracy. The experimental results demonstrate that the proposed algorithm was able to (a) correctly estimate the abundance vectors using a sparsity-promoting unmixing scheme that produces the relevant abundance maps; and (b) generate more accurate classification maps based on the available reference map.

 ,
, 


