1. Introduction
Analysis of competitive swimming races provides much sought after data on the performance of athletes and their competitors. Performance parameters such as stroke-rate, stroke-length and swim velocity provide coaches with quantitative information allowing further discussion on the swimmer’s strengths and weaknesses, effect of training implementations or success of race strategies [
1]. Many elite swimming teams have dedicated sports analysts who film the races and later digitize to extract the required performance parameters. Filming positions are usually in the spectator stands, capturing an above-water view of the race [
2]. Typically, the race analysis will be broken down into phases: start, turns, finish and clean swimming in between. The clean swimming phase is often the focus for performance parameters as the speed or time taken during the phase has been shown to have the highest correlation with overall race time [
3].
Digistisation is required to extract performance parameters from video footage. This can be done manually using ‘tagging’ systems; however, these methods can be time consuming and subject to user error. Digital image processing techniques can be used to automate the process, although, to date no fully automated swimming competition analysis system has been published. Pogalin et al. [
4] developed an automated video-based system to measure swimmer lap times in training but it was not applicable to competition environments due to the number and positions of cameras required. Automated video-based systems have also been developed for drowning prevention applications using a variety of image processing techniques such as block-based models for background and foreground objects [
5], Kalman filters [
6] and classification of the temporal variation in a pixel’s color [
7]. These techniques have potential to be used to track swimmers in competitive race environments but the complexity may lead to difficulties in implementation and long execution times to run.
Collection of performance parameters during training rather than competition allows the use of alternative measurement techniques such as wireless accelerometers or inertial sensors [
8,
9,
10]. These systems offer real-time feedback and valuable velocity data of the swimmers, but unfortunately are not able to be used in competitive environments.
The aim of this research was to develop an automated stroke-rate detection system for use in competitive swimming environments. The system was required to work for all four swim disciplines: breaststroke, butterfly, backstroke and freestyle, using a single camera mounted in the spectator stands.
2. Method
2.1. Equipment and Data Collection
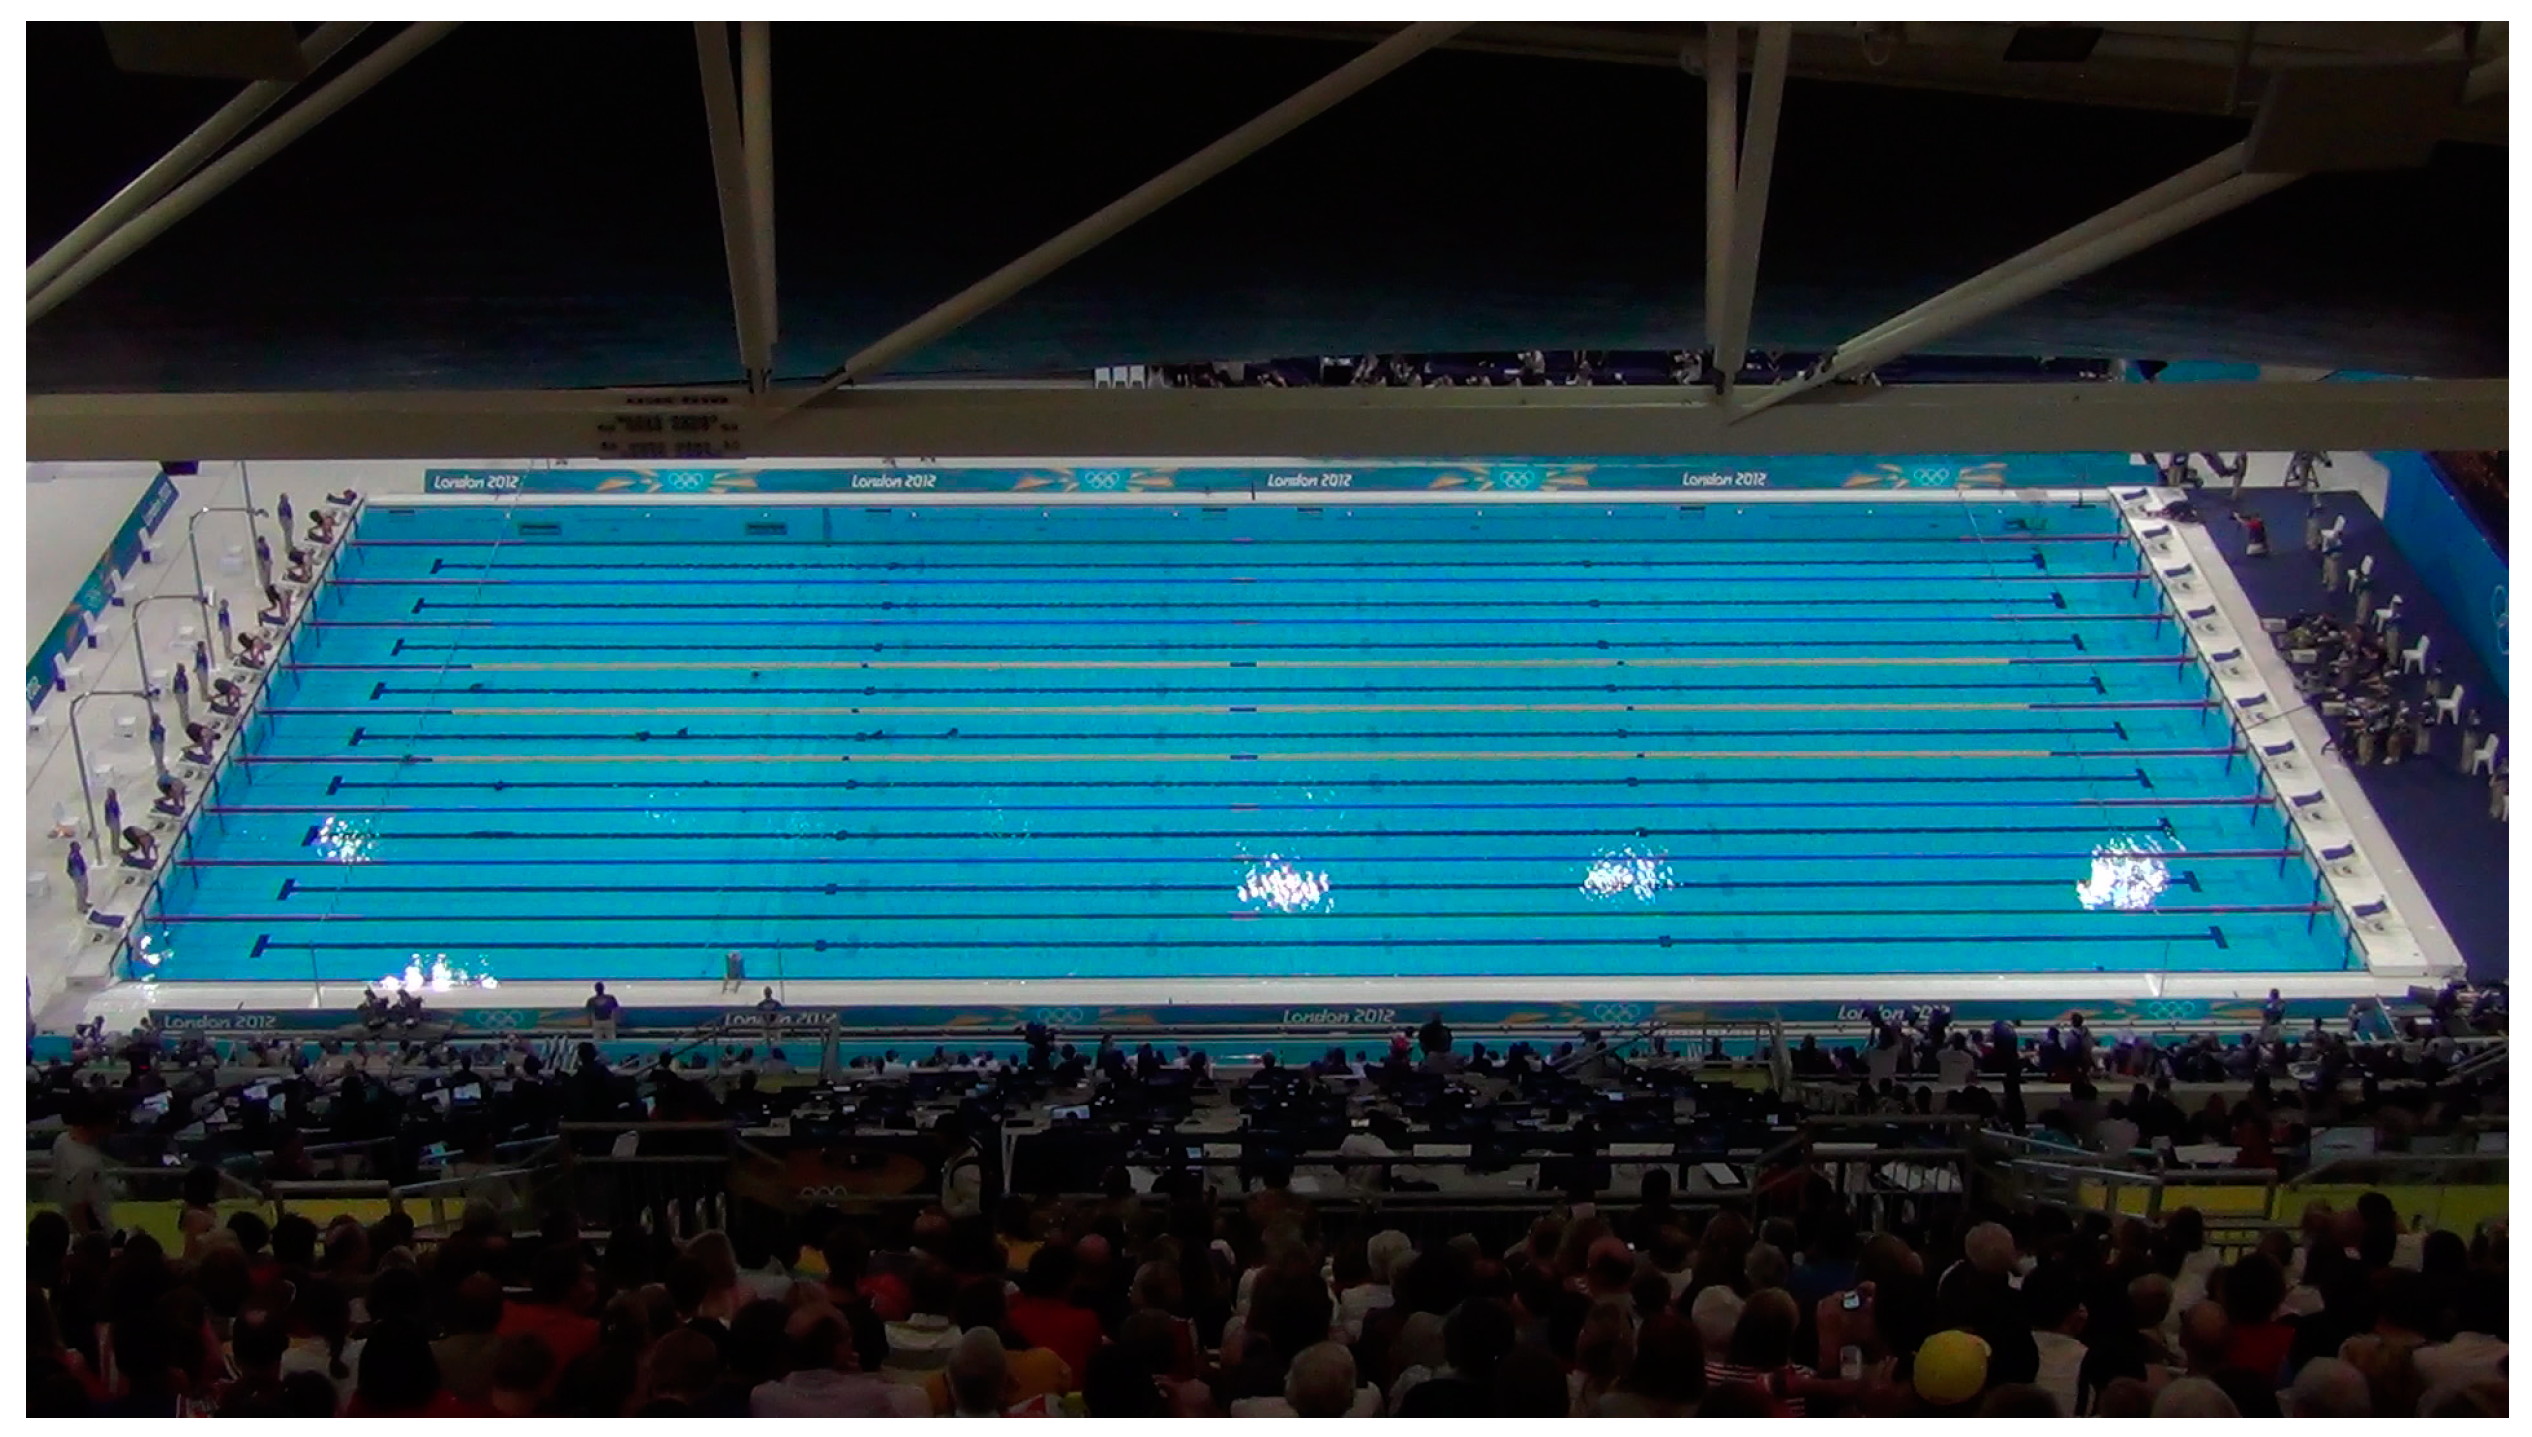
Video footage was collected (with permission from British Swimming) at the 2012 Olympic Games using a Sony HDR-PJ260VE camera (1920 × 1080 pixels, 50 Hz, progressive scan). The camera was mounted at the highest point in the temporary seating stand of the London Aquatics Centre. The optical axis was approximately perpendicular to the swimming direction, 25 m along the long axis of the pool (
Figure 1). The .MTS video files were converted to .PNG images using Avisynth and VirtualDub. MATLAB
® (2012a), image processing and statistics toolboxes were used for the analysis. Footage of a women’s 200 m medley race was used for algorithm development and validation of the proposed system.
2.2. Image Processing Algorithm
This section reports the image processing algorithm that was used to obtain the signal relating to the approximate position of the swimmer. The first stage of the algorithm was to segment the pool into regions of interest (ROI) consisting of individual lanes. This allowed either analysis of a single lane for computational efficiency, or the potential for multi-lane analysis. Further processes were then applied to identify the position of a swimmer along a lane. Analysis of the RGB color map used by MATLAB
® indicated that tracking the splash leading or trailing a swimmer was more reliable than attempting to identify the body of a swimmer. As such, the resulting signal relates only to the approximate location of the swimmer. A description of the processes used is outlined below. For this, and subsequent stages, a
background image was required; this was an image of the pool in which no swimmers were in the water, the lane rope markers were undisturbed and the camera was located in the same position as used for race capture (
Figure 1).
2.2.1. Stage 1: Lane Segmentation
Aim: Generate image coordinates of ROI relating to lane rope boundaries.
Method: The background image was masked and cropped to a trapezoid boundary defined by the corners of the swimming pool (manually identified by user). A perspective transform was applied to create an image of the pool in which the swimming lanes ran parallel to the horizontal and were equally spaced vertically. The number and width of the lanes were used to generate a coordinate matrix defining 11 horizontal points along the length of each lane. A reverse transformation was applied to convert the coordinate matrix back to the original image coordinate system. Polynomial lines were formed from the 11 evenly spaced points, defining the lane ropes; thus segmenting the pool into ROIs. Segmentation of the pool into ROI reduced the computational processes required to analyze a single swimmer (hence single lane and just one ROI) and provided the potential for multi-lane/swimmer analysis.
2.2.2. Stage 2: Swimmer Identification
Aim: Provide an approximate location of the swimmer in the ROI and return a signal from which stroke parameters can be identified.
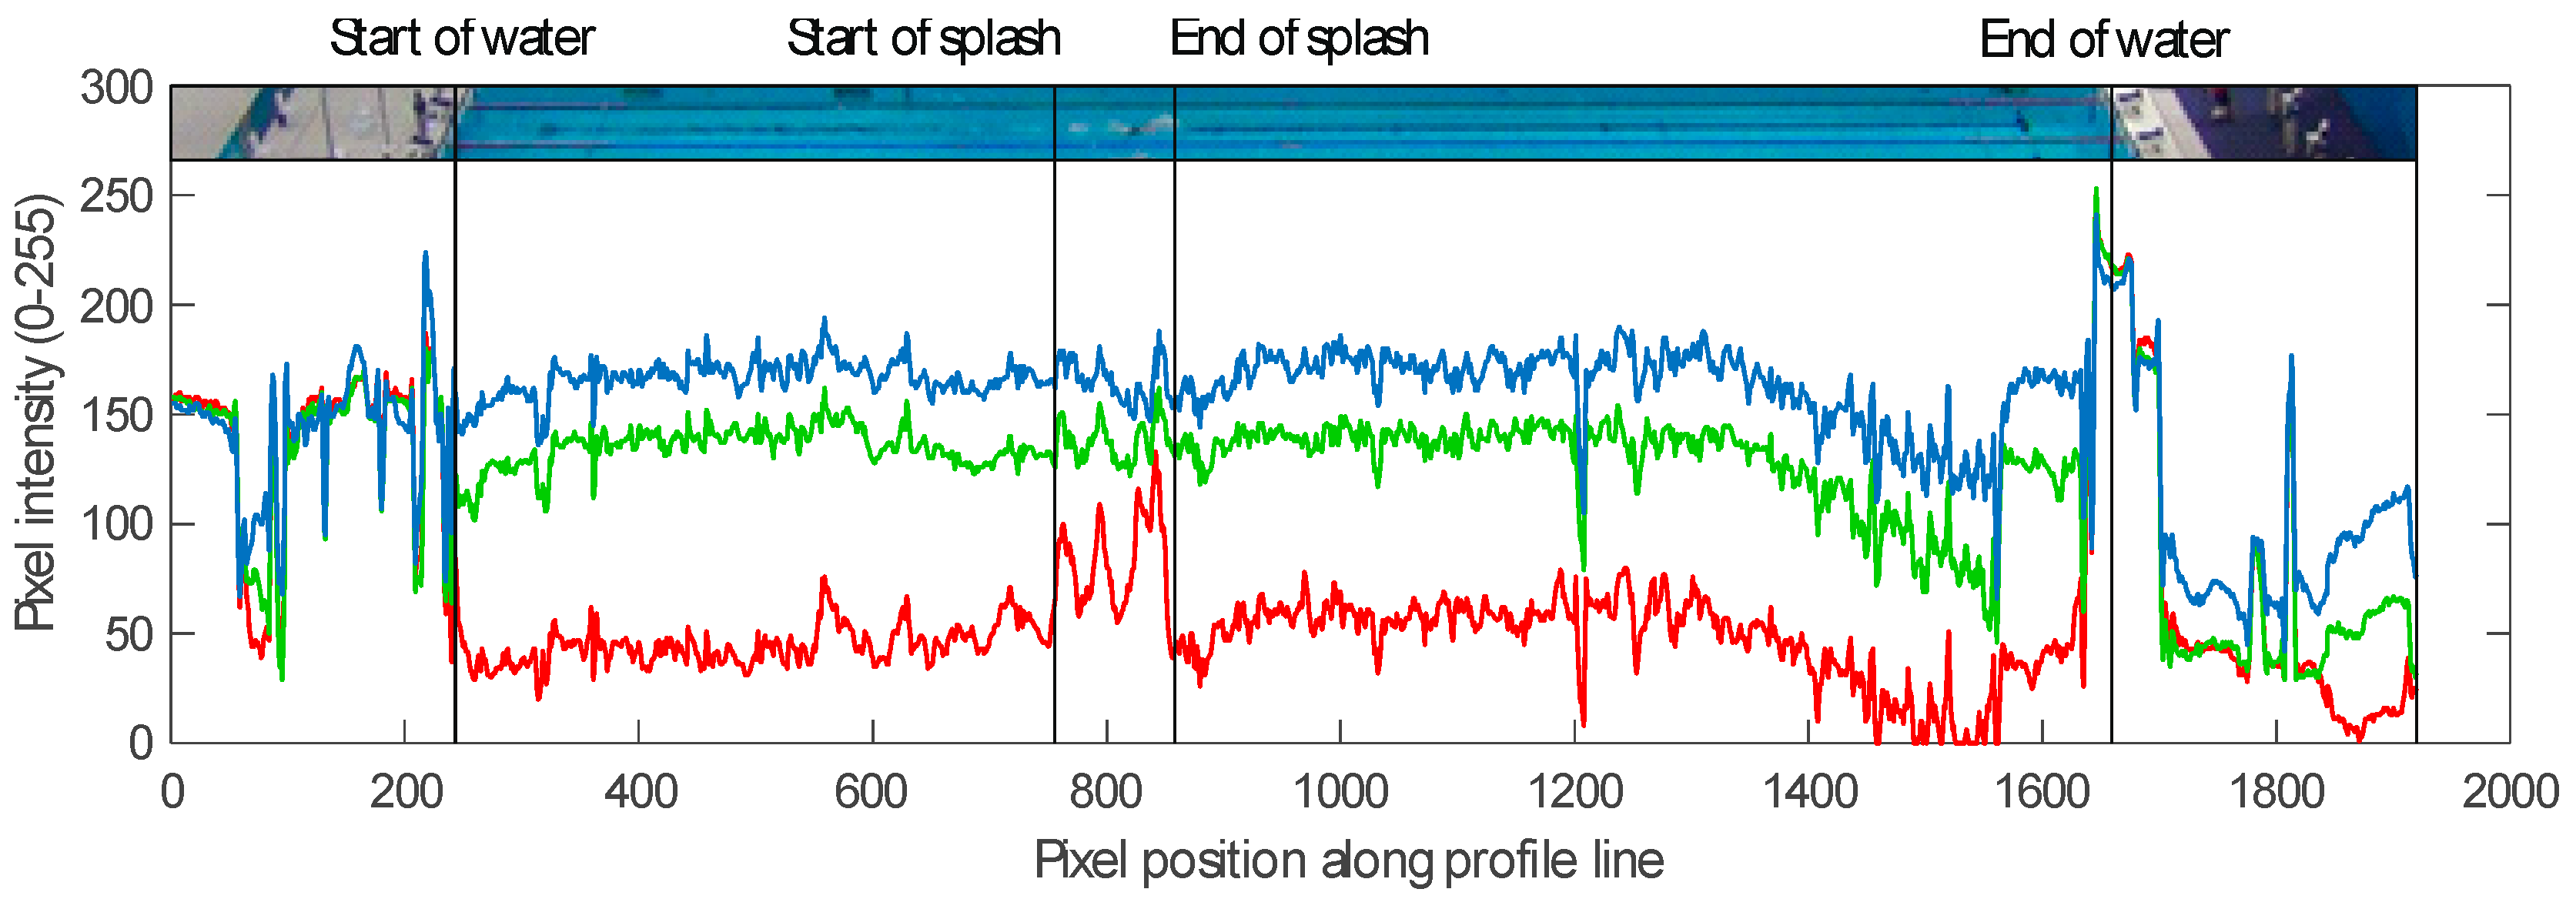
Method: An image (1080 × 1920 array, three 8-bit pixels in the RGB color space) containing a swimmer during the butterfly stroke (at time of arms entering the water) was used for the initial algorithm development. This image was chosen as it contained both a splash event and the swimmer was visible out of the water. The RGB components of the image were viewed and results indicated that the water was predominately formed of the blue and green components. The red component (RGB
r) formed a low percentage of the water composition, but increased in intensity around the swimmer, most notably in the region of splash at the feet and arms of the swimmer where the water appeared white instead of blue (
Figure 2). No advantage in identifying the swimmer (or splash) location was seen by converting the image into alternative color spaces (e.g., HSV or L*a*b) and as such, RGB
r was selected for further analysis.
To reduce computation time, RGBr values along profile lines were analyzed rather than the complete intensity array from the whole ROI. Five profile lines were defined that ran parallel to the lane boundaries identified in stage 1. The lines were equally spaced about the center of the ROI, with a larger spacing at each lane rope to account for interference from lane rope markers or splash from adjacent swimmers. For the images used in this analysis, the profile lines had a spacing of four pixels (1/8th of the ROI). The RGBr values along the five profile lines were obtained for each image from the video as well as the background image. The background image RGBr values were subtracted to reduce the influence of consistent noise such as reflections or permanent objects in the water.
Visually, a distinct peak of increased RGBr values was seen around the region of splash, but due to the unstable water surface, the signal contained a high level of noise that triggered false positives. A filtering stage was used to improve the likelihood of correct detection. The values from all five profile lines were sorted into ascending order and a threshold value was assigned at the 98th percentile. Each profile line was filtered and RGBr values below the threshold were set to zero. The mean of the filtered profile lines was calculated and the values sorted into ascending order. The 50th percentile was selected as a second threshold. Further filtering with the second threshold returned a group of values along the profile line, the position of which corresponded to the start and end of the splash. The position of both the first and last values from the filtered group were important due to the change in direction of the swimmer at each lap. Swimming left to right (with respect to camera view), the last value detected was the most reliable signal (relating to splash from arms) with the first value detected (foot splash) showing high variations in location. When the swimmer changed direction (right to left), the first value became the leading splash (from arms) and the more stable signal for tracking. The signal exported for further analysis contained three values: (1) pixel position along ROI relating to the first detected value and (2) last detected value; and (3) the magnitude of the RGBr value.
2.3. Signal Processing
The second phase of the developed system was to use the signal generated from the image processing algorithm to obtain stroke parameters. The chosen parameter for validation was the stroke duration: the time from the start of one stroke cycle to the start of the next i.e., hand entry to hand entry (butterfly), right/left hand entry to right/left hand entry (backstroke and freestyle) or head breakout to head breakout (breaststroke).
2.3.1. Stage 3: Lap Segmentation
Aim: Identify video frame number corresponding to the start and end of each lap.
Method: The change in gradient on the plot of detected pixel position against frame number was used to segment the race into lanes. The difference between consecutive values of pixel position were calculated and filtered using a Boolean statement with the 90th percentile used as the threshold. The running mean of 100 consecutive values was then calculated and when the mean value was below 0.01, this identified the start of the lap; when the mean value rose above 0.01, this signaled the end of a lap. For the 200 m medley race, the signal was divided using this method into four data sets relating to each swim discipline.
2.3.2. Stage 4: Identification of Stroke Parameters
Aim: Calculation of mean stroke duration for each lap of the race.
Method: For the butterfly, backstroke and freestyle disciplines (lap 1, 2 and 4 respectively) the following signal processing steps were applied:
The raw pixel positions from stage 4 were filtered to remove values that may lead to false stroke identification:
A linear polynomial regression line was calculated;
If the pixel position was greater than the set threshold (default = 100) it was replaced with the value from the regression line;
The filtered data was smoothed using a five-point moving average filter;
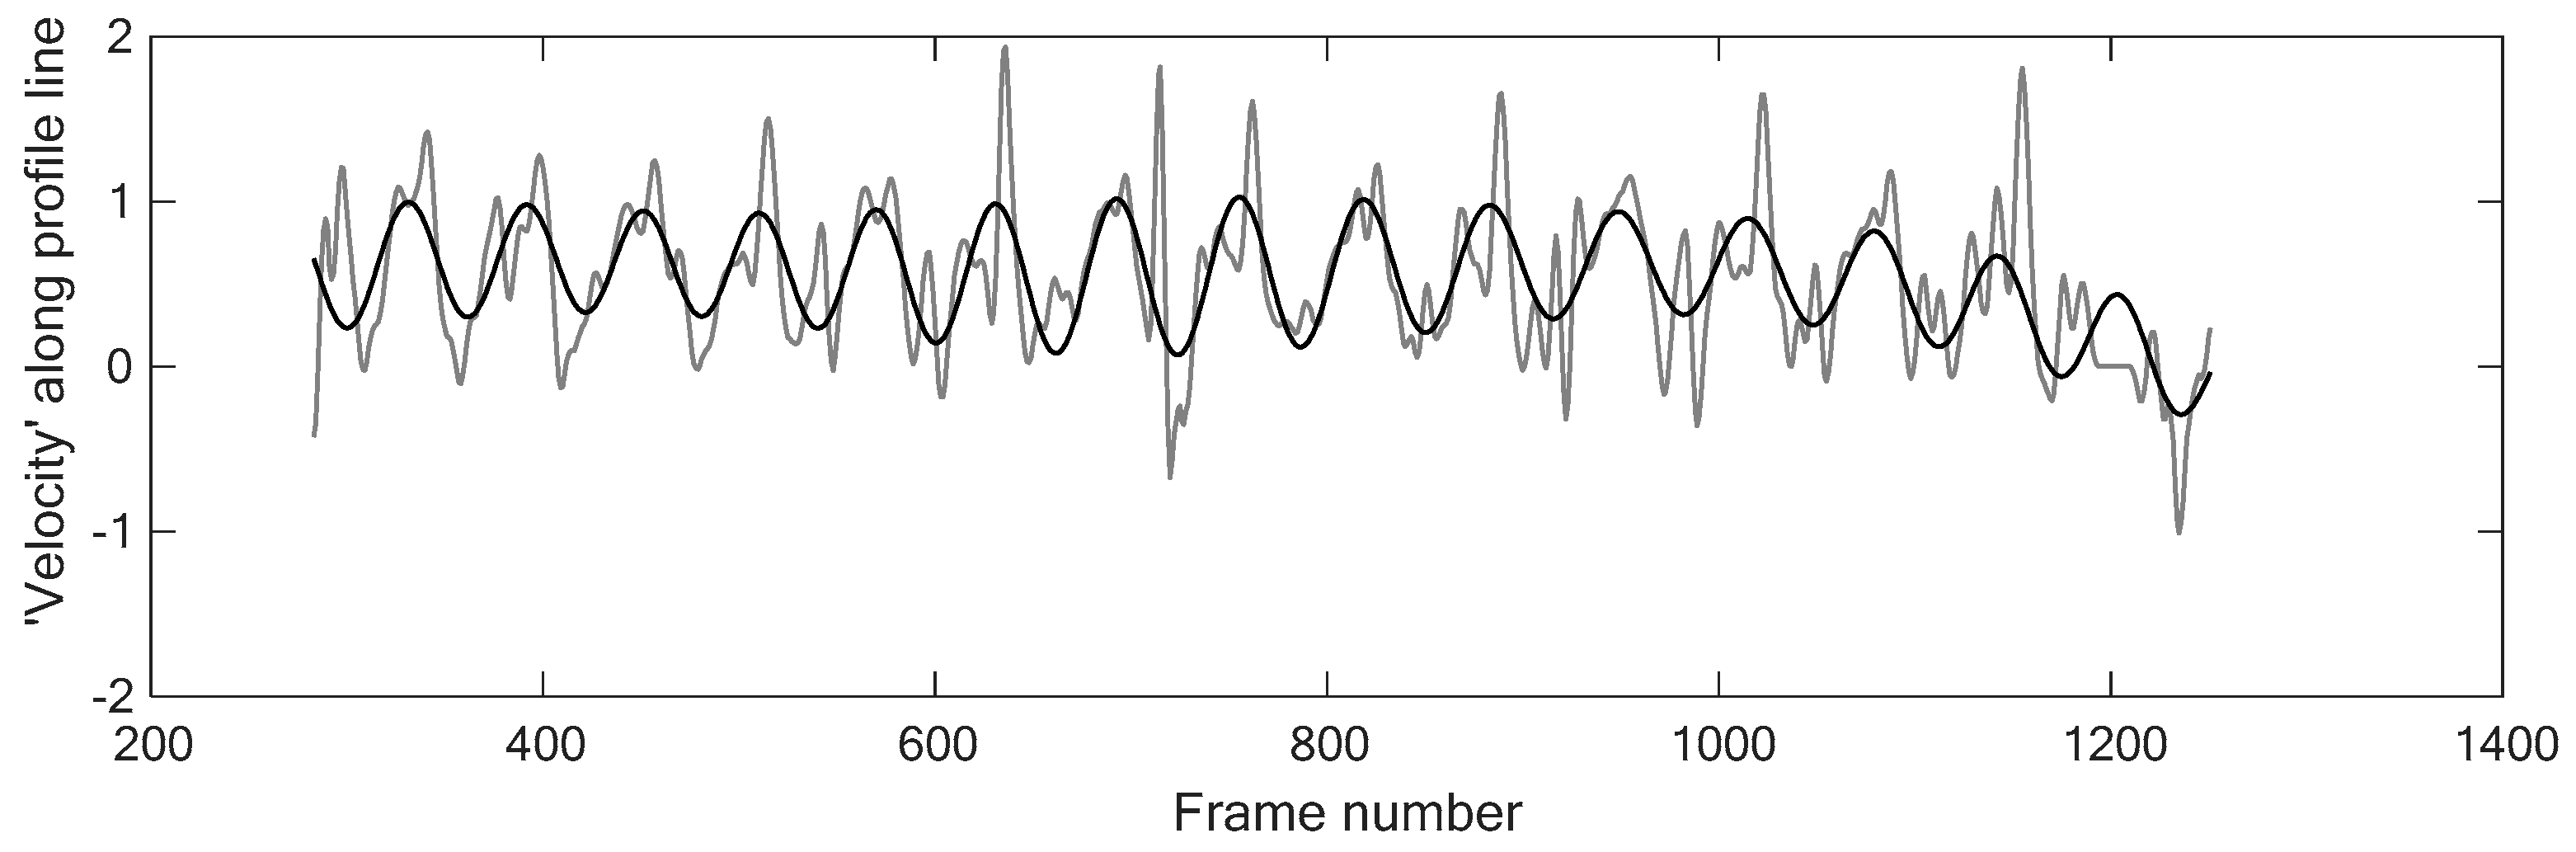
A five-step central differencing method was used to calculate the pseudo velocity of the swimmer;
The velocity signal was smoothed using a five-point moving average filter;
A sum of sine curve was fitted to the smoothed velocity signal (
Figure 3);
The maxima of the sine curve signal were identified using the peakfinder function [
11] and the corresponding frame numbers returned;
The difference between each maxima were calculated and the mean value obtained for each lap.
A different approach was used for the breaststroke disciple; the long glide phase followed by a sudden splash as the arms and head break out from the water gave greater periodicity in the intensity of the splash than the pseudo velocity profile. The magnitude of the RGBr value was instead used as the signal. This was filtered using a five-point moving average and a sum of sine curve was fitted. Again, the maxima of the sine curve were identified and the mean of the difference calculated to obtain the stroke duration.
3. Validation
This section outlines a practical example of the system used to analyze a women’s 200 m medley race. The results were validated by comparison to manual identification of strokes based on the notational analysis method used by performance analysts (
Table 1). Only the clean swim phase of each lap was considered.
A maximum difference of 0.02 s (one frame at 50 fps) was observed between the manual digitization method and the developed system. An accuracy of ±1 frame was considered to demonstrate excellent agreement between the two measures (no significance in t-test). For the freestyle lap, the developed system was not able to detect two strokes; it is likely these occurred near the turn or finish of the race. The developed system for the butterfly lap detected an additional stroke. This is thought to be an artifact of applying the sine-fitting function.
4. Conclusions
The proposed system used a single camera that was positioned in the spectator stands. The system consisted of two developed processing algorithms for the image and signal. The RGB values along the profile lines were obtained. RGBr values were filtered and taken forward to the signal processing stage of the system. From the approximated swimmer position, a five-step central differencing method was used to calculate the pseudo velocity of the swimmer. In future developments of the system, it would be interesting to compare the obtained velocity profile with data from wireless inertial sensors. The velocity profile obtained was periodic and clear peaks were observed that correlated with the individual swimming strokes. A sine-fitting function was used to quantify the location of the peaks, from which the frequency was used to define stroke-duration and thus, stroke-rate.
The following limitations of the system were noted:
Taking the mean of the stroke-rate and duration during the clean swimming phase prevents the ability to detect changes in stroke parameters during the lap.
Changes in the background have not be modelled; instead careful positioning of the profile lines to avoid problematic regions such as lane rope markers was used. This would therefore not be appropriate to track swimmers adjacent to the lane ropes.
The current system is not suitable for near real-time analysis; this could be improved by using alternative programming environments.
The robustness of the system has not been fully tested. A 200 m women’s medley race was used for development. It is not known whether this system would be able to detect faster rate events such as the men’s 50 m freestyle or longer distance events such as 200 m breaststroke or 1500 m freestyle. These events are likely to generate the extremes of splash.
The developed system was able to detect periodic motion from a single camera view of a swimming pool. It is thought that the algorithms developed have the potential to be used to detect performance parameters from other periodic sports such as cycling or rowing.


