Abstract
The purpose of this study is to propose a two-dimensional (2-D) mathematical model of sports surfaces for evaluating the shock attenuation and deformation properties in both the vertical and horizontal direction, especially in competitive track and field materials. We develop a 2-D impact test device that can control the initial impact angle and intensity with parallelogram linkage. Using this device, various intensity impacts with angles ranging from 5–25 degrees were performed on test specimen. A 2-D mathematical model for sports surfaces and parameter identification method is also proposed for evaluating such surfaces, especially for polyurethane competitive track and field materials. The model is constructed from vertical and horizontal elements, and the parameters for each element are identified separately. Finally, vertical and horizontal forces with various angles and intensities can be estimated with an identified parameter set.
Published: 11 February 2018
1. Introduction
Sports surfaces, such as artificial lawns, polyurethane tracks, and gymnasium floors, have two important functions. One of them is to provide the conditions necessary for athletes to perform well, while the other is to protect athletes from injuries. To prevent injuries, the shock attenuation property of the material must be taken into account during the product design and evaluation. To evaluate surface properties, mechanical drop-mass tests are performed to examine vertical shock attenuation. Some organizations, such as the I.A.A.F. [1] and DIN [2], incorporate mechanical tests based on their own testing apparatus and evaluation criteria. These mechanical tests usually evaluate the force reduction of the maximum force and maximum deformations of the impact as the shock attenuation properties. Although such tests are highly reproducible and have strict criteria, they also are limited in that the results are very dependent on the testing conditions.
We therefore proposed an approach to assessing sports surface properties by computer simulation instead of mechanical tests. To accomplish this, we proposed various viscoelastic models for sport surfaces and an evaluation method using computer simulation in previous studies [3]. However, the mathematical models in these studies addressed vertical characteristics only. Meanwhile, actual sports activities have a wide range of impact angles and intensities. For this reason, we here develop a two-dimensional (2-D) impact test device for sport surfaces, and use data from this device, such as maximum force and maximum deformation in each direction, to revaluate the properties found in previous studies [4,5]. To evaluate practical attenuation properties, not only the vertical but also the horizontal property should be taken into account. In this study, a 2-D mathematical model and parameter identification method are proposed for sport surfaces. Especially in competitive activities, performance is affected not only by vertical properties but also by horizontal shock attenuation and deformation properties, because athletes prefer high stiffness to low in order to achieve their highest performance. Actual activities are therefore composed of both vertical and horizontal impact forces.
2. Methods
2.1. Two-Dimensional Impact Test Device
Figure 1 shows the structure of the 2-D impact test device. An impact force F is produced by dropping an impact mass onto the upper edge of a parallelogram linkage. The parallelogram linkage, represented by a dashed line in Figure 1, divides force F into a horizontal force and a vertical force, and transduces these forces to the sensor unit through the slider unit (A1, A2) without angular momentum. The parallelogram linkage is rigid, so that it always keeps the sensor unit in a horizontal position, even while the upper edge of the parallelogram linkage descends along the vertical linear guideway attached to the frame. That the force data from vertical load cells (C1 and C2) show almost the same time-series data supports this assertion. The initial angle θ controls the ratio of fx/fy. To calculate the forces applied to a specimen, f’x and f’y, a multiple of the sensor unit mass (0.8262 kg) and the relevant directional acceleration are subtracted from the measured forces fx and fy. Part D is a 2-D accelerometer. Horizontal and vertical velocity and displacement are calculated from acceleration by integration. Initial angle θ and drop height are measured by an angular sensor and laser displacement sensor, respectively. Impact mass is 6.5 kg, held and released by an electromagnet system to produce certain height drops.
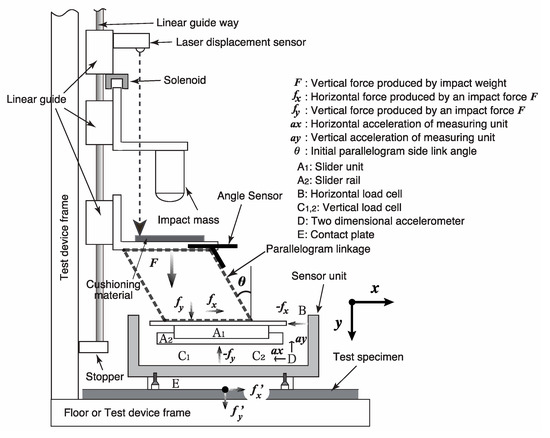
Figure 1.
2-D impact test device. According to the parallelogram linkage, the impact force produced by impact mass onto the upper edge of the linkage is divided into the vertical force fy and the horizontal force fx and applied to the test specimen.
2.2. Test Specimen and Experimental Conditions
The test specimen was one of the common urethane track materials certified by the I.A.A.F. for international track and field competitions. The specimen was 14-mm thick, and attached to the top of a concrete block to simulate the construction at a stadium.
In a previous study, the initial angles could not have wide range because of less friction between the bottom of the sensor unit and the top of the specimens. To extend the experimental range of the initial angle, double-sided adhesive tape was used to bind the top of the specimen and the bottom of the sensor unit. Because the tape was very thin, the cushioning it provided was negligible. The initial angle of impacts ranged from 5–25 degrees in 5-degree steps, and the impact intensity was controlled by the drop height of the mass, which ranged from 30–150 mm in 20-mm steps. Three trials were performed for each condition. The maximum horizontal and vertical impact forces were 2394.0 N and 3284.6 N, respectively, so that the impact intensities in both directions covered those of actual human activities.
2.3. 2-D Mathematical Model with Angular Parameter
In previous studies, an exponential function type nonlinear Voigt model with area parameters was proposed to represent the behavior of multi-intensity multi-area impacts for sport surfaces [6]. The identification accuracy of the model was very high, and the impact forces were well estimated at various intensities and impact areas with a parameter set. In this study, angular parameters are incorporated into the model instead of area parameters. Figure 2 shows the 2-D mathematical model for sport surfaces. The model assumes that the horizontal and vertical elements are orthogonal and work separately during the angled force, and that each element has a nonlinear elastic and viscous element.
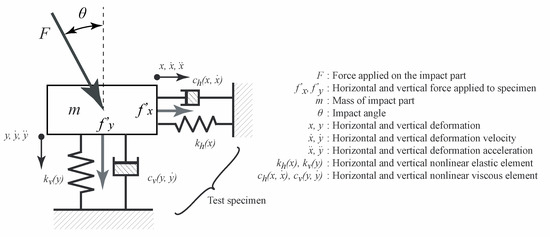
Figure 2.
2-D mathematical model of sport surface proposed in this study. The model consisted of horizontal and vertical elements. By using experimental data acquired from 2-D impact tests with various impact angles and intensities, the parameter set of each element was identified separately.
Assuming that the force F is applied to the surface with at angle θ, the horizontal Voigt model constructed by nonlinear elastic and viscous element is represented as follows:
In Equation (1), m is the mass of the impact part, fx is the horizontal force applied to the specimen, fhk is the force generated by the nonlinear horizontal elastic element and fhc is the force generated by the nonlinear horizontal viscous element. Equation (2) shows the reaction force generated by the horizontal elastic force. In this study, angle θ and angular parameter αh, βh were incorporated into the model to represent the reaction force with the changing the impact angle. The vertical force fy was represented in a same manner, with all the parameters for the vertical element represented by the subscript ‘v’ instead of ‘h’.
2.4. Parameter Identification of 2-D Mathematical Model with Angular Parameter
As the horizontal and vertical elements have the same components, and the identification process is the same for both, we describe only the parameter identification method for the horizontal element below.
Impact force, deformation velocity, and deformation time series data were acquired from 2-D impact tests with 5 different initial angles and 7 different drop heights. In each impact test, the deformation and the force pair where were extracted to calculate the elastic fhk parameters. According to Equation (1), the impact force fx is equal to fhk if the impact velocity is zero (. The parameters in Equation (2) were calculated by the least squares method if the parameter αh, βh was given. To identify the parameter set, the combination of αh and βh that showing the minimum error between the experimental and estimated fhk were searched as a first step. Figure 3a shows the horizontal deformation—force fhk pair with the marker and the estimation curves. Each initial angle has a unique marker and line type, as indicated in the legend. As shown in Figure 3a, most fhk were on their own estimated lines, indicating that fhk were represented by a set of horizontal parameters and initial angle parameter θ. Figure 3b shows those of vertical elements, and that fvk can also be estimated with a vertical parameter set and initial angle parameter θ. After calculating the set of horizontal parameters, fx–fhk in every moment were calculated as fhc, and the parameters of fhc in Equation (3) were calculated by the least squares method. The vertical parameters fvc were calculated in this manner as well.
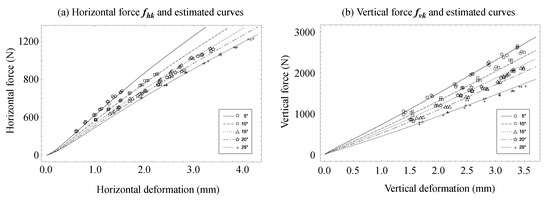
Figure 3.
Experimental deformation-force pair where the deformation velocity equaled zero in each impact test, and the estimation curves from parameter identification in the horizontal element (a), and vertical element (b).
3. Identification Results and Accuracy of Estimation
In this study, parameter identification accuracy was evaluated by the RSE (relative standard error) between the experimental force and estimated forces represented by Equation (4) in the horizontal and vertical elements separately.
where is the mean impact force, are the estimated and experimental forces in the ith time series data, respectively, and n is the number of time series data in an impact test. Furthermore, the MRSE (mean relative standard error) of each angle and both directions were calculated as an average of 21 trials with same initial angle to evaluate the total identification error.
Table 1 presents the MRSE of each initial angle in both directions and the total average of MRSE. Figure 4 shows a comparison of the maximum intensity of the experimental force and estimated force at: (a) 5-degrees of initial angle and 150-mm drop height; and (b) 25-degrees initial angle and 150-mm drop height. In the figure, solid lines show the experimental force and dashed lines the estimated force calculated from the identified parameter set; the left sub-panel of each figure shows the horizontal force and the right sub-panel shows the vertical force.

Table 1.
Horizontal and vertical MRSE (mean relative standard error) between experimental force and estimated force with each initial angle and total average of MRSE.
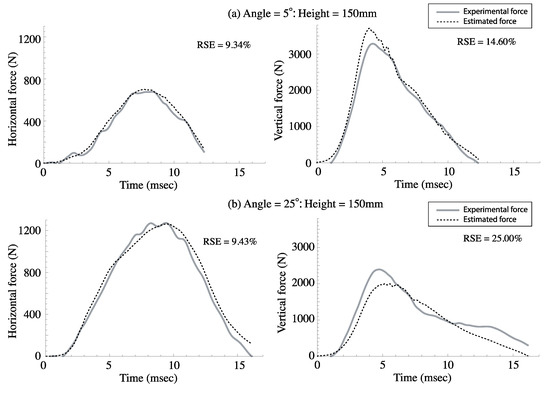
Figure 4.
Comparison of experimental force and estimated force at (a) 5-degrees initial angle and 150-mm drop height; and (b) 25-degrees initial angle and 150-mm drop height. The left panels show the horizontal force and the right the vertical force.
As shown in Table 1, the horizontal forces were well estimated with the identified parameters throughout the range of initial angles, even for the maximum initial angle. On the other hand, the vertical force estimation had relatively low accuracy, especially at an angle of 20 degrees. Although the MRSE is not especially low in vertical forces, the estimation force curves in Figure 4 are similar to the experimental force curves in peak timing and impact duration, even for the vertical force at a 25-degrees initial angle. Because some gaps were observed between the markers and estimated lines in Figure 3, it should be possible to improve the experimental results. Additionally, the model should be modified to improve the accuracy, especially in vertical force estimation.
4. Conclusions and Future Work
In this study, 2-D angled multi-intensity impact tests were performed on a common sports surface certified by the I.A.A.F. Impact tests were conducted from 5 different initial angles ranging from 5–25 degrees, and 7 different intensities. The 2-D model was then proposed. Conclusions are as follows:
- The model is constructed from horizontal element and vertical elements, and each element can be represented by an exponential functional type nonlinear Voigt model with initial angular parameters
- The experimental deformation-force data in the horizontal and vertical elastic elements, fhk and fvk, can be represented by the estimated curves from the identified parameters
- Although the estimation accuracy in the vertical element was not high, the horizontal impact forces were well represented by the identified parameters
According to the results of this study, the proposed model can be used to represent the behavior of sports surfaces with various impact angles and impact intensities. The identification accuracy needs to be improved, especially for the vertical component. In future work, we plan to consider the properties of sports surfaces with various impact angles and intensities by computer simulation.
Acknowledgments
This work was supported by JSPS KAKENHI Grant Number JP15K01575. We would like to express our thanks to Oku En-tout-cas Co. Ltd. for their valuable contributions to the study.
References
- International Association of Athletics Federations. Track and Field Facilities Manual; International Association of Athletics Federations: Stockholm, Sweden, 2008. [Google Scholar]
- Deutsches Institut für Normung. Sport Halls—Halls for Gymnastics and Games; Floors for Sporting Activities, Testing; DIN 18032-2; Deutsches Institut für Normung: Berlin, Germany, 1991. [Google Scholar]
- Kobayashi, K.; Yukawa, H. Identification of the Exponential Function Type Nonlinear Voigt Model for Sports Surfaces by Using a Multi-Intensity Impact Test. JSME J. Syst. Des. Dyn. 2011, 5, 1326–1336. [Google Scholar] [CrossRef]
- Yukawa, H.; Kawamura, S.; Kobayashi, K. Two-dimensional cushioning characteristics of sports surfaces. Sports Technol. 2010, 3, 26–33. [Google Scholar] [CrossRef]
- Yukawa, H.; Aduma, R.; Kawamura, S.; Kobayashi, K. Shock attenuation properties of sports surfaces with two-dimensional impact test. Procedia Eng. 2012, 34, 855–860. [Google Scholar] [CrossRef]
- Yukawa, H.; Murai, T.; Nishimura, H.; Kawamura, S.; Kobayashi, K. Parameter identification of nonlinear viscoelastic model with impact area parameter for sport surface by using multi-intensity multi-area impact test. Procedia Eng. 2011, 13, 395–401. [Google Scholar] [CrossRef]
Publisher’s Note: MDPI stays neutral with regard to jurisdictional claims in published maps and institutional affiliations. |
© 2018 by the authors. Licensee MDPI, Basel, Switzerland. This article is an open access article distributed under the terms and conditions of the Creative Commons Attribution (CC BY) license (https://creativecommons.org/licenses/by/4.0/).