Proceeding Paper

Accuracy of Centre of Pressure Gait Measurements from Two Pressure-Sensitive Insoles †

Smart Equipment Engineering and Wearable Technologies Research Program, Centre for Design Innovation, Swinburne University of Technology, Melbourne, VIC 3122, Australia
*
Author to whom correspondence should be addressed.
Presented at the 12th conference of the International Sports Engineering Association, Brisbane, Queensland, Australia, 26–29 March 2018.
Proceedings 2018, 2(6), 277; https://doi.org/10.3390/proceedings2060277
Published: 13 February 2018

Abstract

:
Footwear-based wearable applications are relevant to numerous fields and have great commercial and clinical potential. However, scientifically validated, reliable data on these devices is largely missing. Centre of pressure (COP) is an important and common factor for measuring balance and gait and hence the validity of such devices is essential for reading accurate data. This study aims to investigate COP accuracy of an existing system, Pedar (PE), and a newly designed Smart Insole (SI) using a force plate (FP). This was done by means of COP data noise (R2), and gradient of the fit function (k). For the SI, the maximum COPx and COPy data achieved R2 values of 0.7837 and 0.9368 and k values of 0.8867 and 0.8538 respectively when compared with the FP. Conversely, the Pedar achieved R2 values of 0.8409 and 0.9401 and k values of 1.0492 and 1.08 when compared with the FP respectively.

1. Introduction

Annual sales of wearable technology are projected to reach $25 billion by 2019 [1]. Wearable technology devices are relevant to numerous fields and have great commercial and clinical potential. However, scientifically validated, reliable data on these devices is largely missing [2]. In addition, significant variation exists in the specifications of currently available in-shoe measurement devices from sensor number and sampling rate to the percent surface-area covered. Some devices used in gait research are Pedar [3] and F-Scan systems [4], with PE being the most common. The PEinsole has been scientifically validated with results published extensively in the professional literature [5,6] and is the current gold standard portable in-shoe measurement device for clinical applications. The PE is used in applications such as orthotic design, rehabilitation assessment and sports biomechanics. In this study, we chose to concurrently validate the PE insole and an innovative footwear-based SI system designed by our team against a force plate. AFP instrumented with piezoelectric sensors was considered the gold standard for measuring COP positions. COP is an important and common factor for measuring mechanical and neurological responses of individuals [7,8,9]. COP is defined as the origin of the resultant force of the sum of all forces acting on an area. FPfor biomechanical and posturographic measurements are the most common tool for measuring COP. In this study we focused on comparing gait parameters of the PE to a newly-developed innovative SI. The SI is an in-shoe plantar measuring system developed by Tan et al. with recently published papers [10,11]. The study aims to investigate the COP accuracy of the PE and SI systems during gait, using a FP, by means of COP data noise (R2), and the gradient of the fit function (k).

2. Methodology

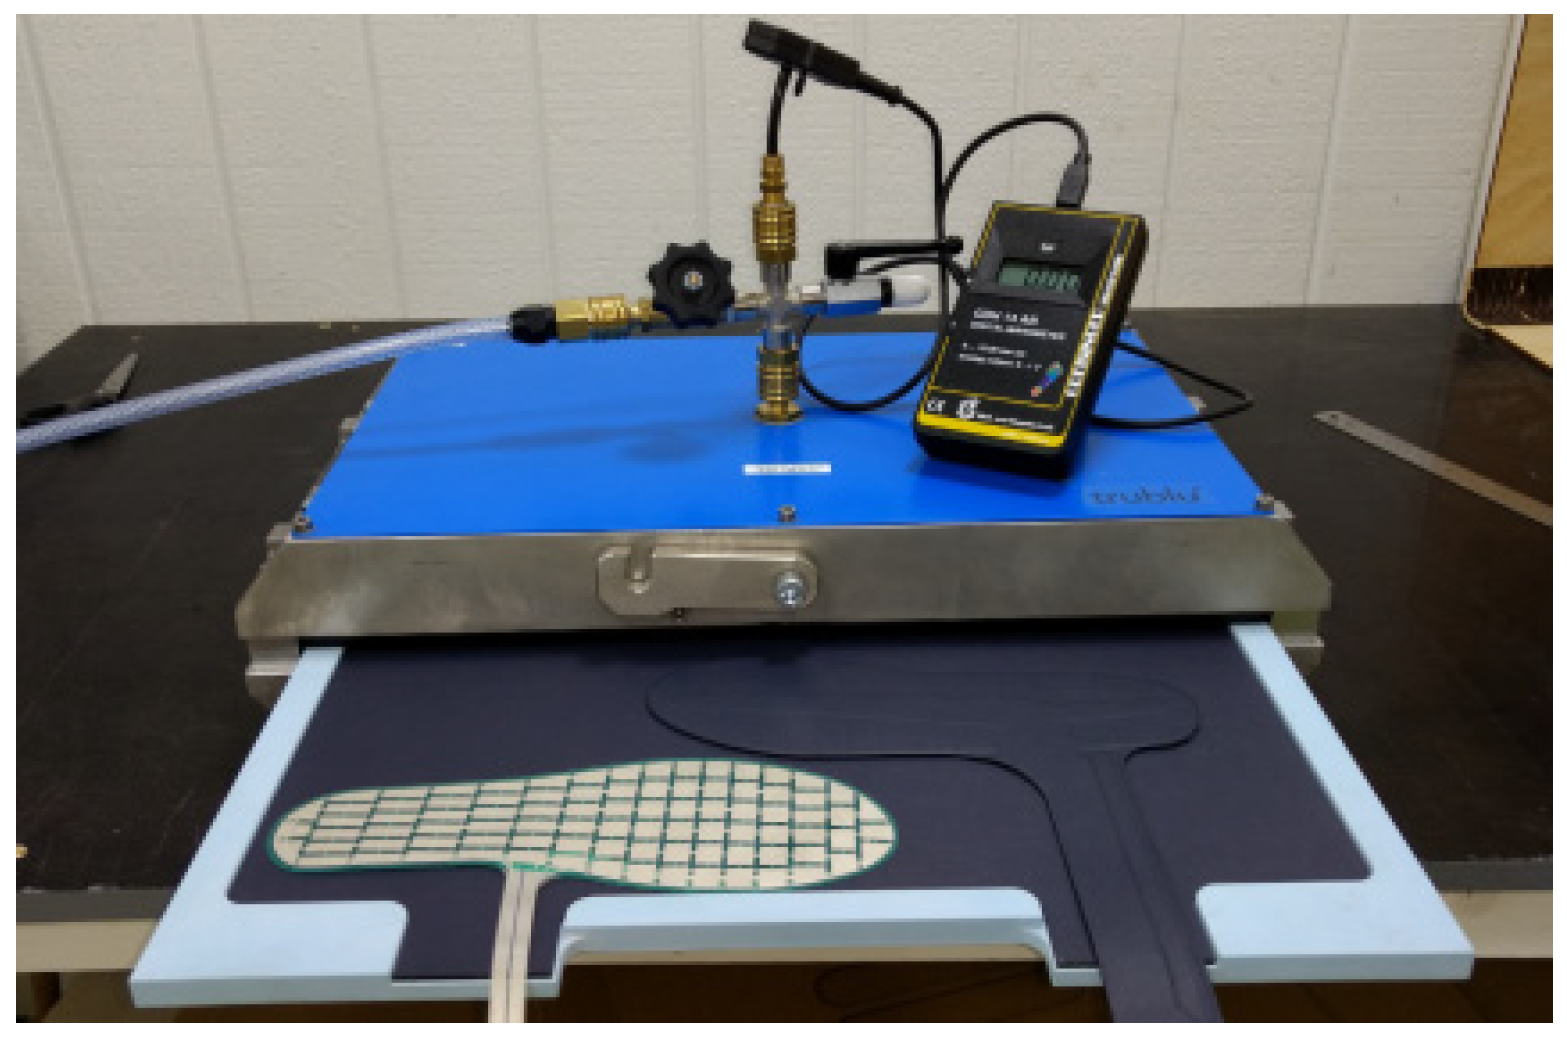
2.1. Experimental Set-Up

The PE and SI insoles were calibrated individually using a pressure vessel (Trublu calibration device, Novel GmbH, Munich, Germany). Pressure was incrementally increased up to 0.6MPa and an individual calibration function was calculated for each sensor in the sensor array (Figure 1).
Coordinates in x and y directions of all systems were defined and then spatially aligned along the same points. Each insole was then secured with tape to the FP, in the correct system-specific alignment, to prevent any movement of the insole during the tests. Two participants performed 10 repetitions of 3 foot-rocking motions for each insole as follows (left foot only, shoe size: US 8): (1) forward and backward; (2) side-to-side; and (3) circular motion of the centre of mass. The set-up used a 0–5 kN, 500 × 600 mm Kistler force plate (type 9260AA6, Kistler, Winterthur, Switzerland). For the PE against FP test, both systems recorded the data at 50 Hz. For SI against FP, SI recorded at approximately 19 Hz and FP at 19 Hz due to a maximum recording speed limitation of the SD card on the SI system. Data from all systems were then synchronized for further compression and analysis of the COP in the medial-lateral direction (COPx) and the COP in the anterior-posterior direction (COPy).

2.2. COP Data Analysis

The pressure data from SI was calculated and interpolated, using Matlab (MathWorks, Inc., Natick, MA, USA), to match the sampling frequencies of the FP. Next, the COPx and the COPy of the SI were calculated from Equations (1) and (2), where Mx and My are moments about x and y-axes, respectively, and Fz is the vertical ground reaction force in the z-direction calculated from the calibration functions.
C O P x = M y F z
C O P y = M x F z
COPx of each insole was plotted against COPx of the FP and a liner regression was fitted through the data. Next, the same method was repeated for COPy direction. This analysis provided us with the coefficient of determination (R2) and the gradient of the fit function (k). The need for both parameters is paramount as the R2 value is a measure of the random error whereas the k value is a measure of the systematic error.

3. Results

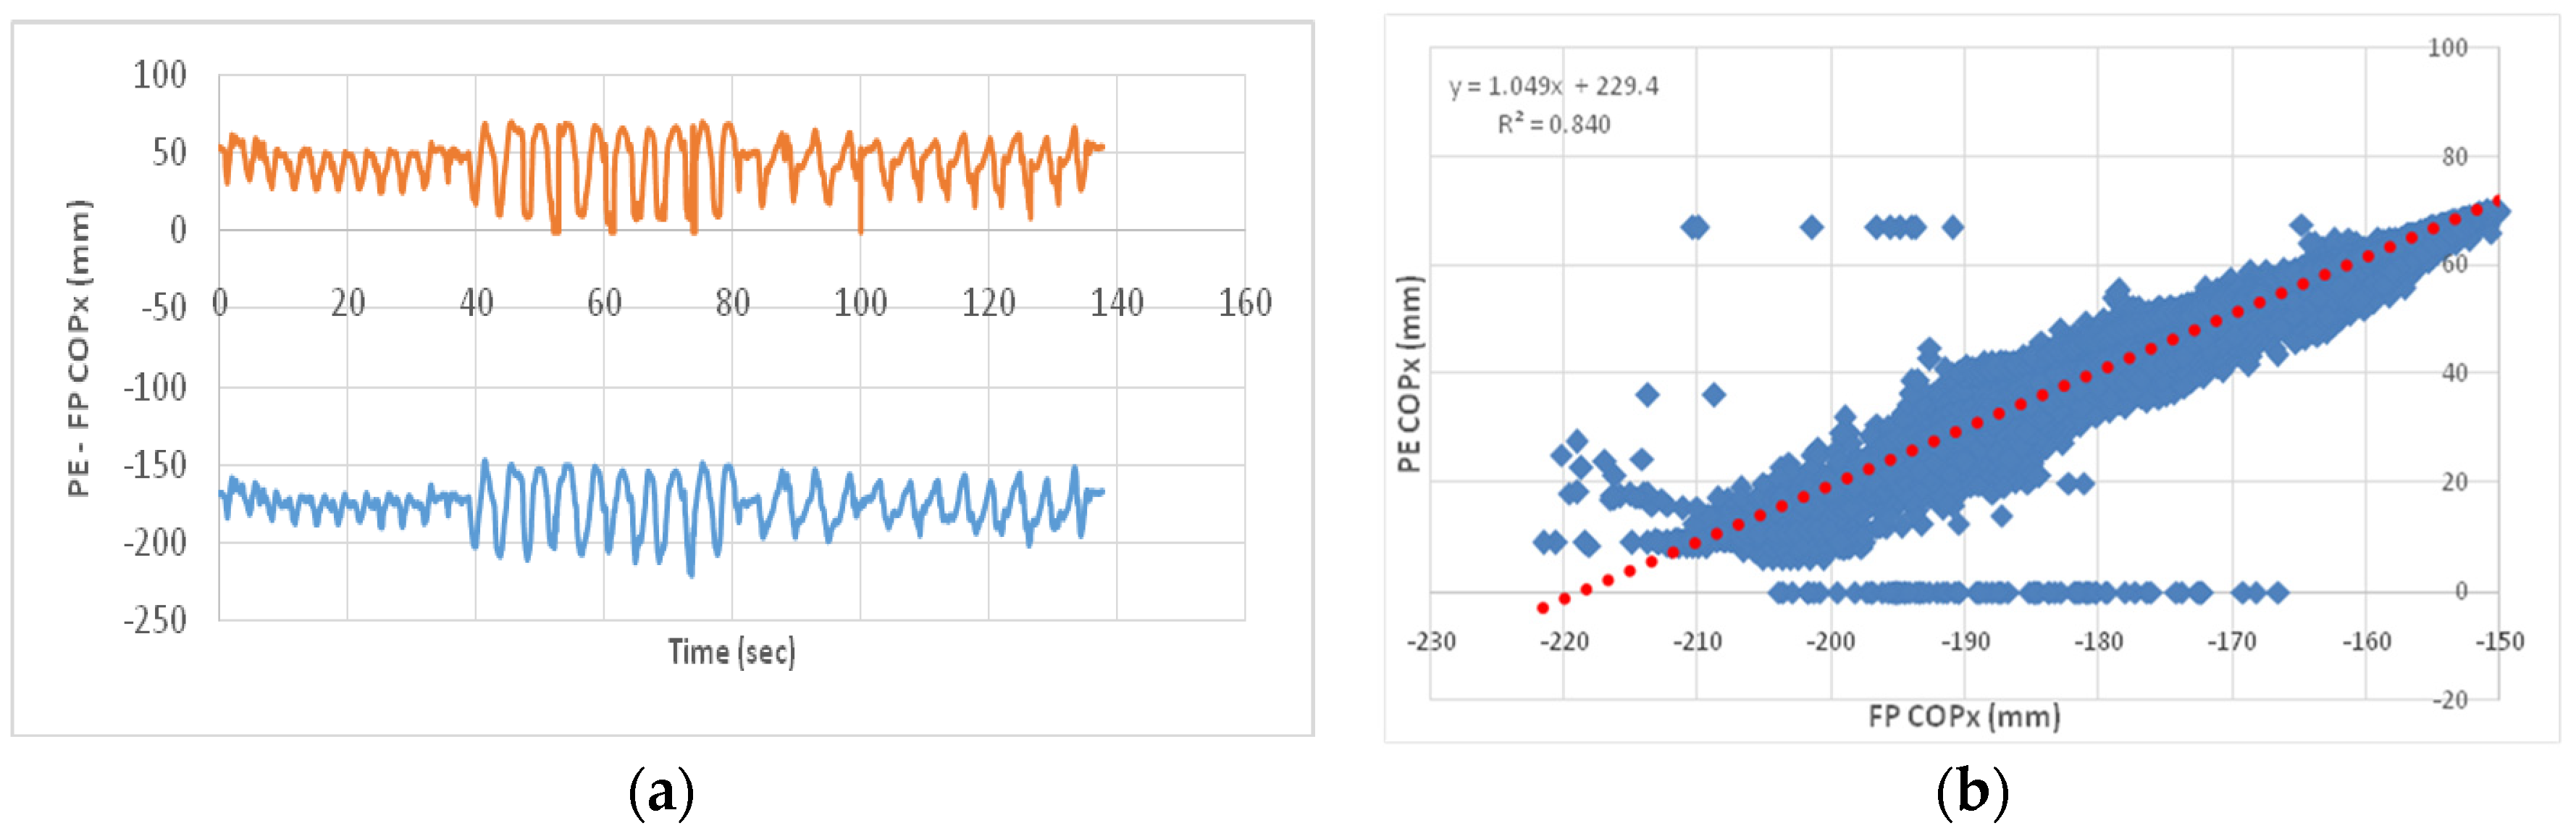
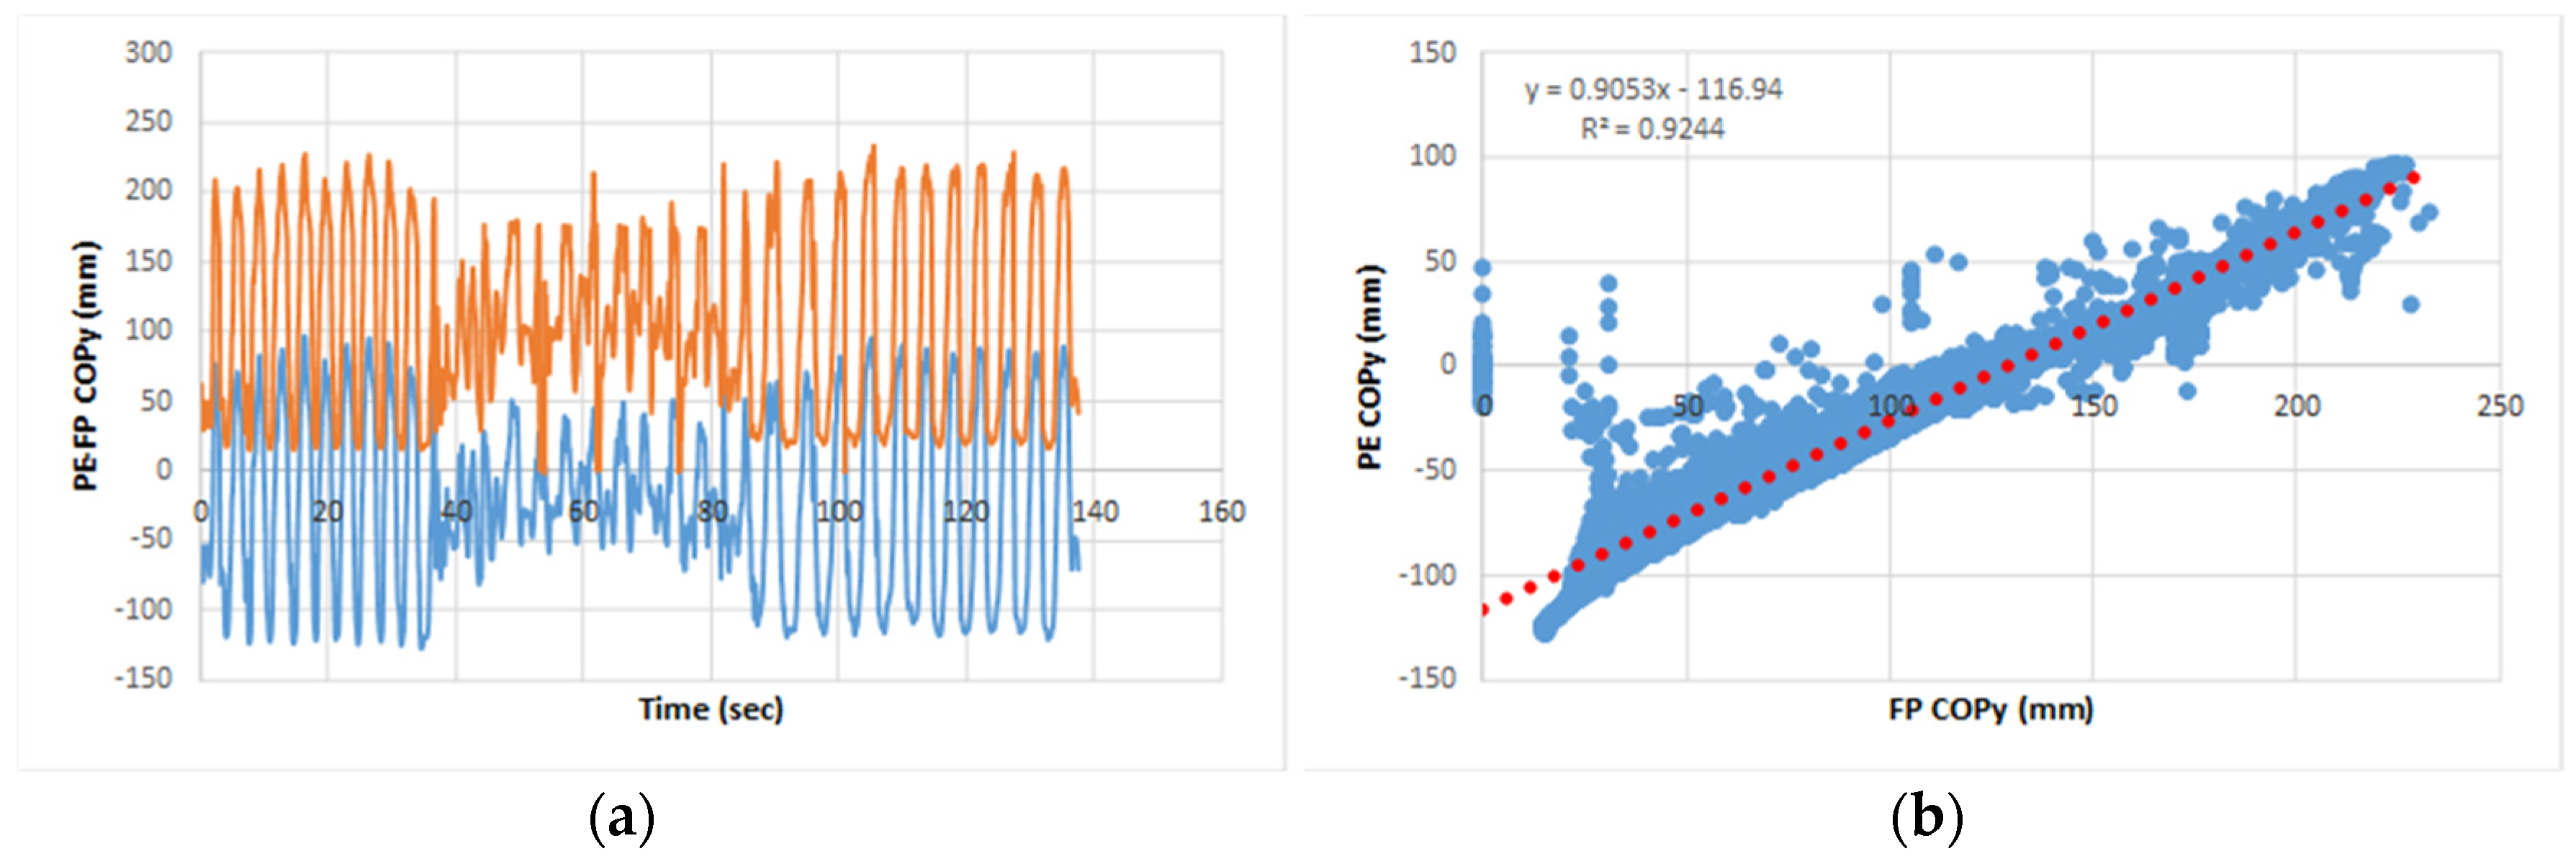
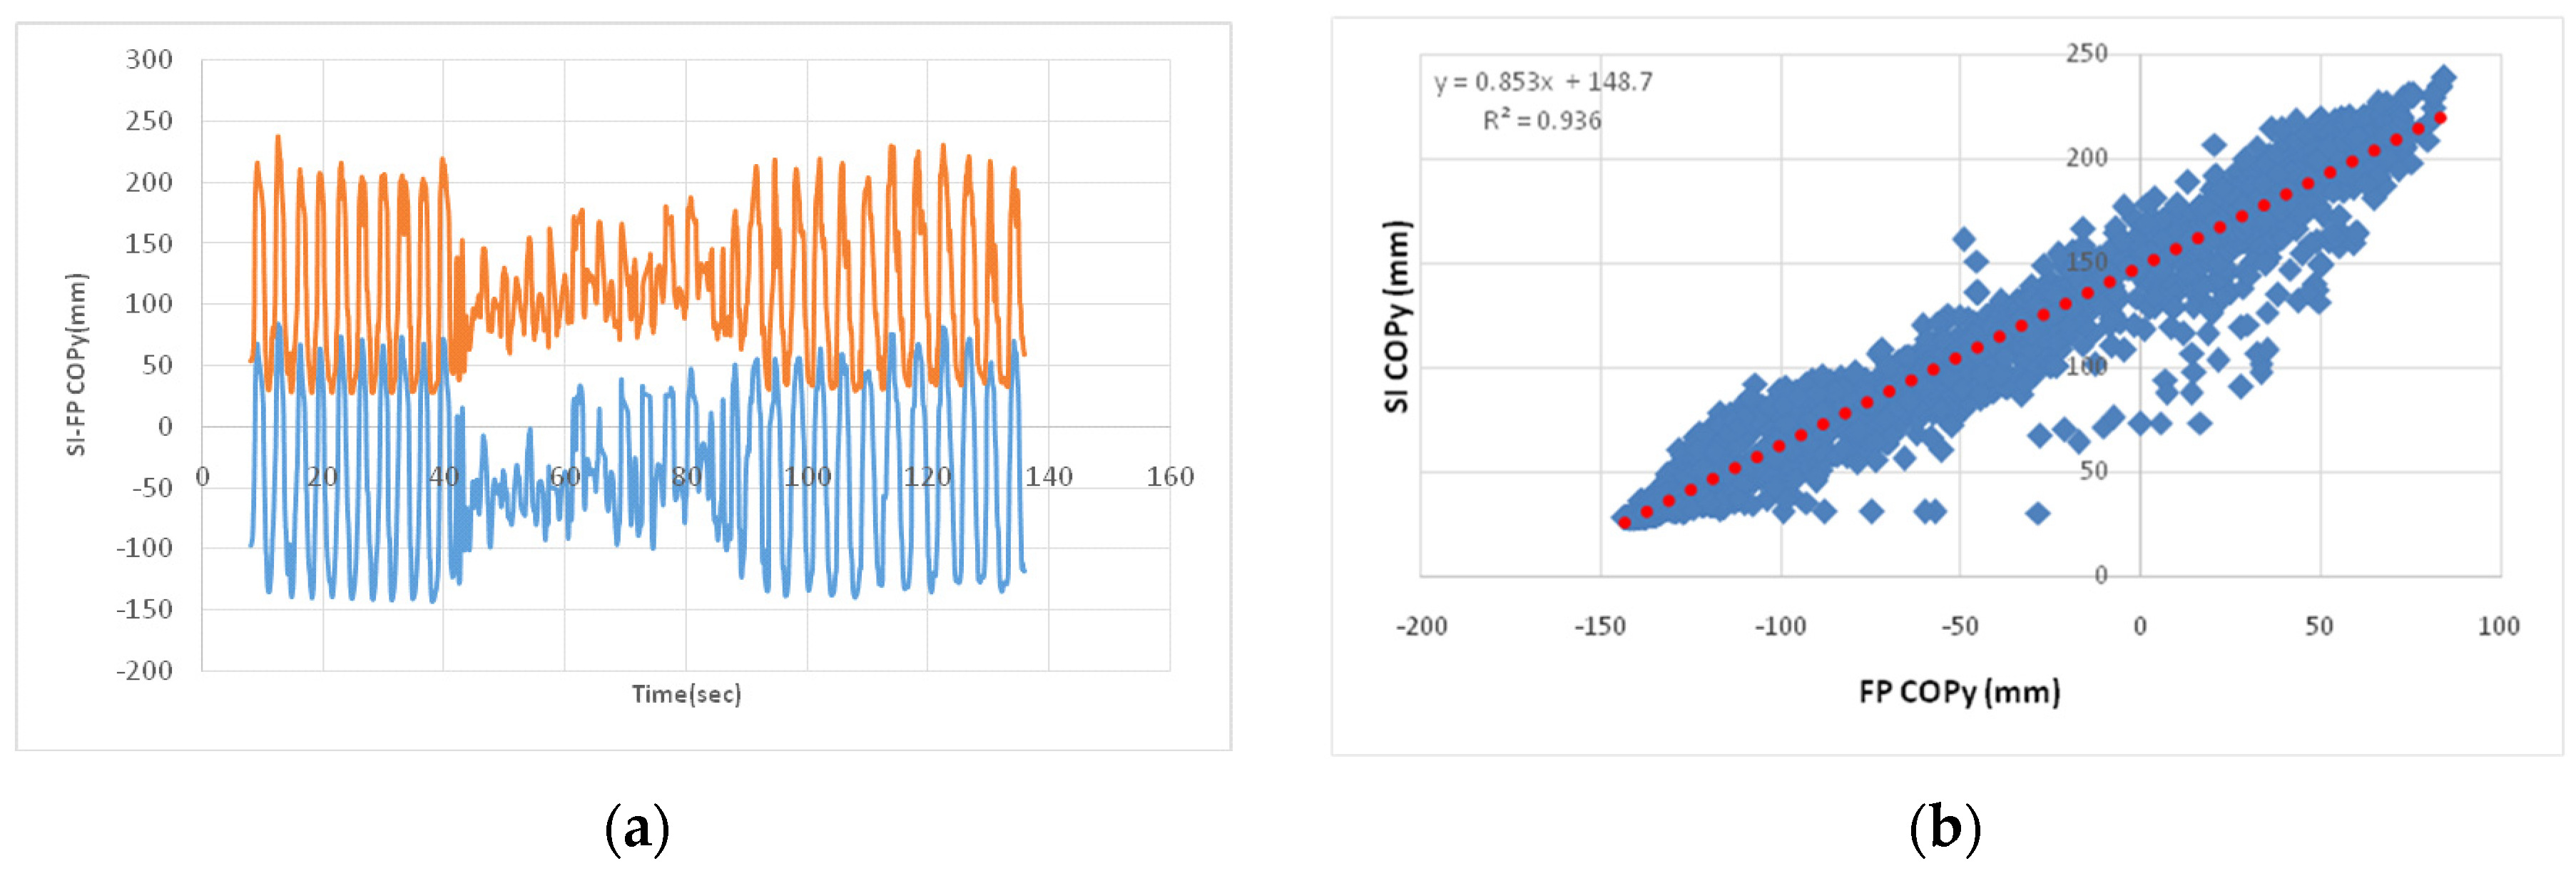
3.1. Pedar Insole Data—COPx and COPy

Pedar experiment results shown below are from one participant. The COPx of the PE (orange) and the FP (blue) were plotted against time and assessed visually (Figure 2a). Next, the R2 (0.8409) and k value (1.0492) were extrapolated (Figure 2b).
The COPy of the PE (orange) and the FP (blue) were plotted against time and assessed visually (Figure 3a). Next, the R2 (0.9244) and k value (0.9053) were extrapolated (Figure 3b).

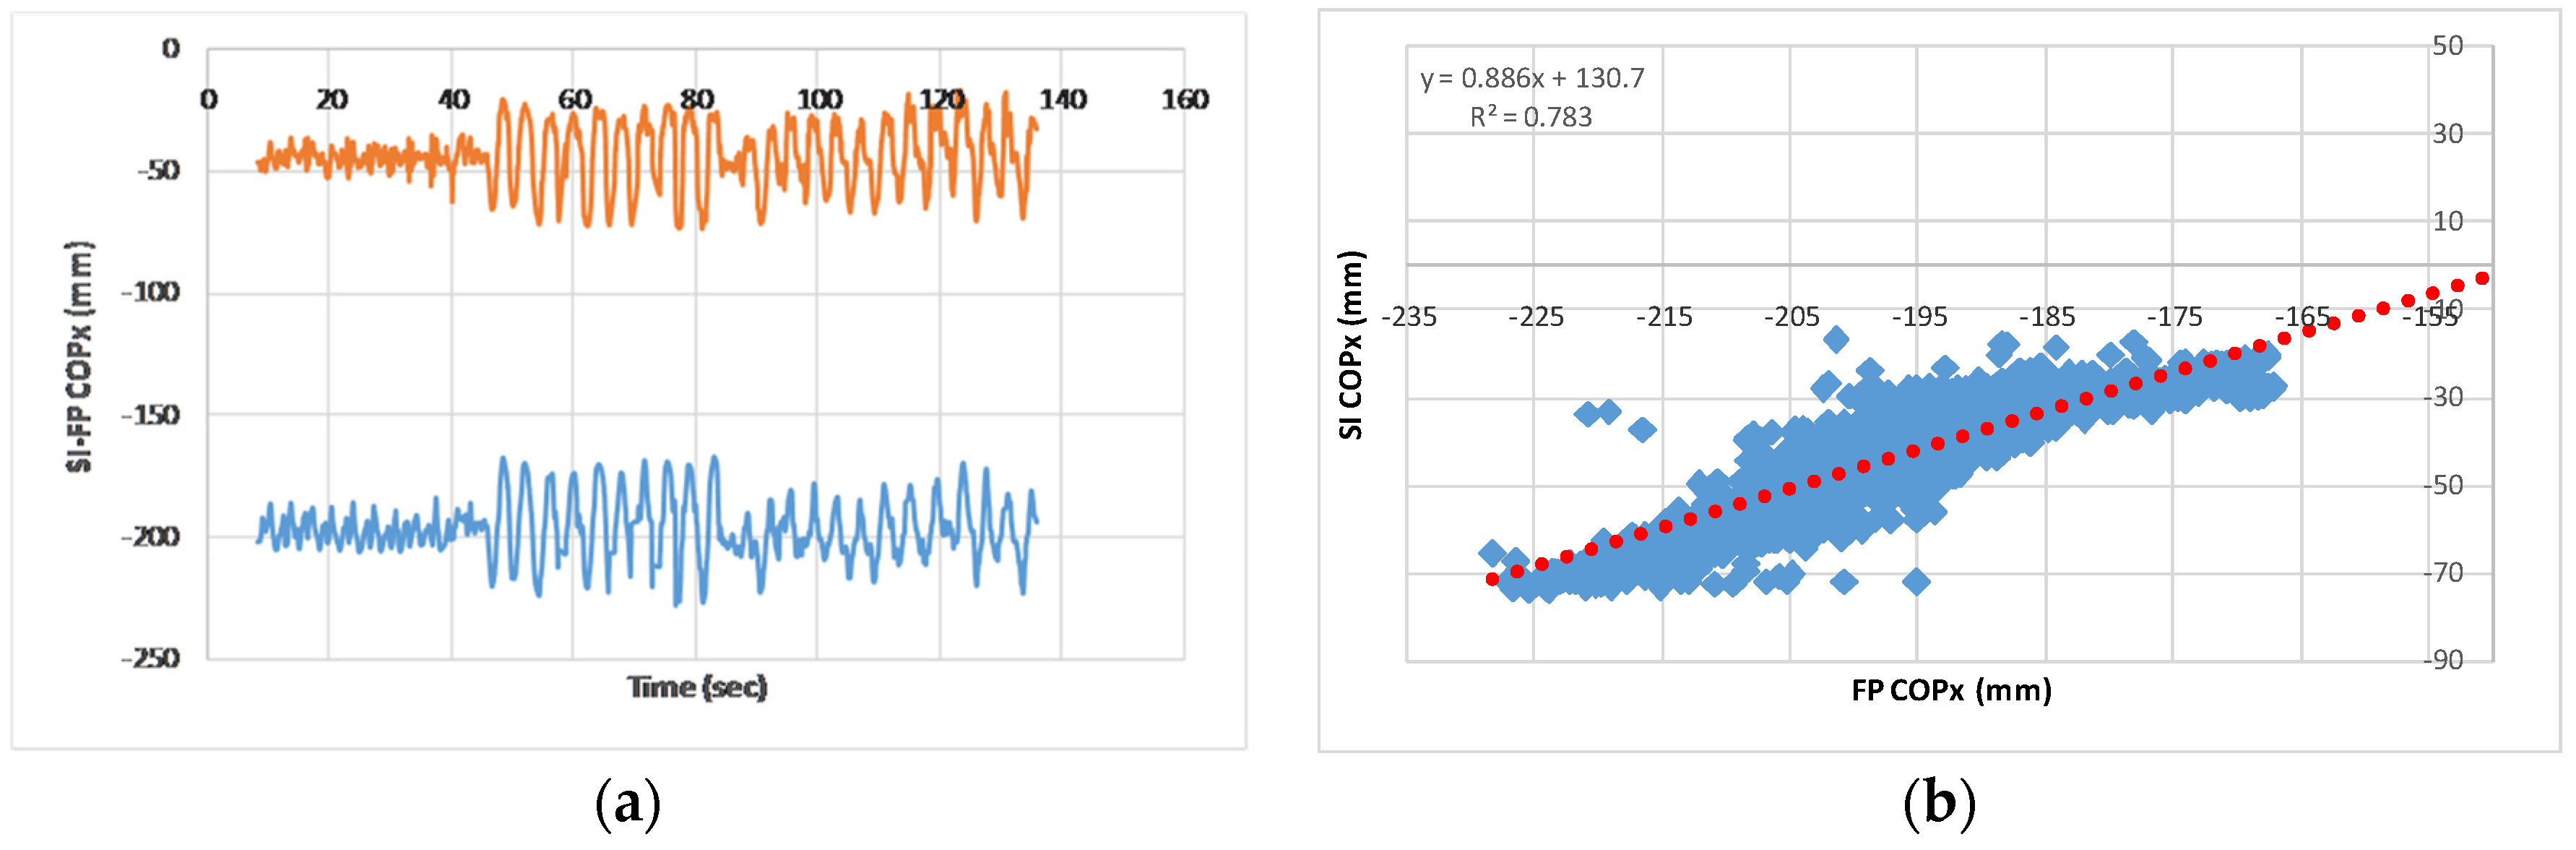
3.2. Smart Insole Data—COPx and COPy

SI experiment results shown below are from one participant. The COPx of the SI (orange) and the FP (blue) were plotted against time and assessed visually (Figure 4a). Next, the R2 (0.7837) and k value (0.8867) were extrapolated (Figure 4b).
The COPy of the SI (orange) and the FP (blue) was plotted against time and assessed visually (Figure 5a). Next, the R2 (0.9368) and k value (0.8538) were extrapolated (Figure 5b).

4. Discussion and Conclusions

This study focused on comparing gait parameters between the PE insole to a newly-developed innovative Smart Insole (SI). The study aimed to investigate the COP accuracy of the PE and SI systems during gait, using a FP, by means of COP data noise (R2), and the gradient of the fit function (k).
The above results can be summarized into Table 1. For the SI, the maximum COPx and COPy data achieved R2 values of 0.7837 and 0.9368 and k values of 0.8867 and 0.8538 respectively when compared with the FP. Conversely, the Pedar achieved R2 values of 0.8409 and 0.9401 and k values of 1.0492 and 1.08 when compared with the FP respectively. The p-value, if < 0.05, indicates a significant relationship between the variables in the regression model, i.e., the dependent and independent variables are related to each other. p < 0.0001 for all R2 calculated except for the COPx data of the SI of participant one. The lowest k values of SI and PE were for the COPx, showing that both systems are less accurate in the lateral-medial direction compared to the the anterior-posterior direction.

Acknowledgments

The research team acknowledges and appreciates the support from the Wound Management Innovation Cooperative Research Centre and the Australian Government’s Cooperative Research Centres Program.

Conflicts of Interest

The authors declare no conflict of interest. The funding sponsors had no role in the design of the study; in the collection, analyses, or interpretation of data; in the writing of the manuscript, and in the decision to publish the results.

References

  1. Hlson, S.L.; Peake, J.M.; Sullivan, J.P. Wearable technology for athletes: information overload and pseudoscience? Int. J. Sports Physiol. Perform. 2016, 11, 705–706. [Google Scholar] [CrossRef] [PubMed]
  2. Düking, P.; Hotho, A.; Holmberg, H.C.; Fuss, F.K.; Sperlich, B. Comparison of non-invasive individual monitoring of the training and health of athletes with commercially available wearable technologies. Front. Physiol. 2016, 7, 71. [Google Scholar] [CrossRef] [PubMed]
  3. Mohamed, O.; Cerny, K.; Jones, W.; Burnfield, J.M. The effect of terrain on foot pressures during walking. Foot Ankle Int. 2005, 26, 859–869. [Google Scholar] [CrossRef] [PubMed]
  4. Han, T.R.; Paik, N.J.; Im, M.S. Quantification of the path of center of pressure (COP) using an F-scan in-shoe transducer. Gait Posture 1999, 10, 248–254. [Google Scholar] [CrossRef]
  5. Hurkmans, H.L.P.; Bussmann, J.B.J.; Benda, E.; Verhaar, J.A.N.; Stam, H.J. Accuracy and repeatability of the Pedar Mobile system in long-term vertical force measurements. Gait Posture 2006, 23, 118–125. [Google Scholar] [CrossRef] [PubMed]
  6. Ramanathan, A.K.; Kiran, P.; Arnold, G.P.; Wang, W.; Abboud, R.J. Repeatability of the Pedar-X® in-shoe pressure measuring system. Foot Ankle Surg. 2010, 16, 70–73. [Google Scholar] [CrossRef] [PubMed]
  7. Winter, D.A. Human balance and posture control during standing and walking. Gait Posture 1995, 3, 193–214. [Google Scholar] [CrossRef]
  8. Takala, E.P.; Korhonen, I.; Viikari-Juntura, E. Postural sway and stepping response among working population: reproducibility, long-term stability, and associations with symptoms of the low back. Clin. Biomech. 1997, 12, 429–437. [Google Scholar] [CrossRef]
  9. Melzer, I.; Benjuya, N.; Kaplanski, J. Postural stability in the elderly: a comparison between fallers and non-fallers. Age Ageing 2004, 33, 602–607. [Google Scholar] [CrossRef] [PubMed]
  10. Tan, A.M.; Fuss, F.K.; Weizman, Y.; Woudstra, Y.; Troynikov, O. Design of low cost smart insole for real time measurement of plantar pressure. Procedia Technol. 2015, 20, 117–122. [Google Scholar] [CrossRef]
  11. Tan, A.M.; Fuss, F.K.; Weizman, Y.; Troynikov, O. Development of a smart insole for medical and sports purposes. Procedia Eng. 2015, 112, 152–156. [Google Scholar] [CrossRef]
Figure 1. Calibration process: SI (left) and PE (right) systems placed inside a calibration device.
Proceedings 02 00277 g001
Figure 2. (a) COPx of PE (orange) and FP (blue) against time (one participant); (b) linear regression fit function for COPx (mm) FP vs COPx (mm) PE (one participant).
Proceedings 02 00277 g002
Figure 3. (a) COPy of PE (orange) and FP (blue) against time (one participant); (b) linear regression fit function for COPy (mm) FP vs COPy (mm) PE (one participant).
Proceedings 02 00277 g003
Figure 4. (a) COPx of SI (orange) and FP (blue) against time (one participant); (b) linear regression fit function for COPx (mm) FP vs COPx (mm) SI (one participant).
Proceedings 02 00277 g004
Figure 5. (a) COPy of SI (orange) and FP (blue) against time (one participant); (b) linear regression fit function for COPy (mm) FP vs COPy (mm) SI (one participant).
Proceedings 02 00277 g005
Table 1. Comparison of coefficient of determination (R2) and gradient of the fit function (k) of the centre of pressure (COPx and COPy) between smart (SI) and Pedar (PE) insoles data.
ParticipantsCOPp-ValueSI vs. FPPE vs. FP
R2kR2k
1COPx0.09890.70460.66550.68250.7458
COPy00.90770.84550.94011.08
2COPx00.78370.88670.84091.0492
COPy0.00010.93680.85380.92440.9053
Publisher’s Note: MDPI stays neutral with regard to jurisdictional claims in published maps and institutional affiliations.

