1. Introduction
Gait analysis is the systematic measurement and description in the study of the human locomotion [
1] and is commonly used in research, medical and sports applications. The Pedar is deemed to be one of the most commonly used devices for in-shoe pressure measurement [
2] for gait analysis. The ability of this system to measure dynamic pressures and forces makes it one of the measurement tool of choice for gait analysis, in contrast to the static force platform devices. The validation of such systems cannot be understated and several researches had been conducted to find the accuracy [
3] and repeatability [
2,
4] of the Pedar system. Most of these methods involve expensive lab equipment. When using a pressure-sensing insole, the body weight (BW) is measured from the pressure at individual sensors multiplied by their respective areas. This requires a high percentage area of coverage of the foot sole with sensors. Electrical effects of the sensors, such as viscosity and non-linearity influence the accuracy of this measurement. The aim of this study was to evaluate the Pedar insole in terms of BW measurements under both static and dynamic conditions. For our study, we have used the Kistler force plate for static BW measurement. The static and dynamic BWs were calculated from summing the forces of both feet and averaging over time (zero net vertical impulse). Furthermore, 2 baseline correction methods were introduced to improve the accuracy of the data collected. Baseline correction is a common method to handle residual pressures detected by the sensors [
5], although there are no standardized approaches. The purpose of this study is to validate the dynamic forces measured by these commercially insoles without the need for additional expensive equipment and complicated set-ups.
2. Methodology
During level walking, the sum of the vertical (Z-direction) velocity of the center of mass is zero. Equation (1) reflects the conservation of momentum in the Z-direction
where
Sz is the impulse, i.e., the integration of all forces with time; Δ
pz is the change of momentum, expressed as the product of the constant body mass
m and the change of the velocity
vz in the Z-direction. Equation (1) yields
where
FZL and
FZR are the vertical forces from the left and right foot respectively.
W is the body weight of the participant; and
az is the gravitational acceleration. For this analysis, we always start with the left foot and thus
HSLi is the first left heel strike and
HSRj is the last right heel strike, where both
i and
j are integers. The mean vertical velocity is zero in level walking, thus rendering
, resulting in Equation (3).
Rearranging Equation (3), and assuming that the weight of the participant does not change within the short duration of the test, we obtain Equation (4).
Equation (4) forms the fundamental basis on which all data will be calculated and compared. Note that the negative sign of W in Equation (4) merely indicates that the body weight vector or gravitational force vector points downward.
A participant was asked to stand on a force plate (Type 9260AA6, Kistler, Winterthur, Switzerland) to measure his body weight and this would be used as the benchmark as the force plate is often regarded as the gold standard for force measurement. Then the participant was asked to perform the following range of motion: (1) Slow speed walk; (2) Medium speed walk; (3) Fast speed walk; (4) Medium speed run; (5) Fast speed run and (6) Self-induced Limping. The limping gait was artificially induced and was use as a comparison to the other gait patterns. This was done on flat ground over a distance of 30 m. Pedar-X system (Novel GmbH, Munich, Germany) was used in the experiments to obtain the vertical ground reaction force from the left and right insoles at a sampling frequency of 50 Hz. Prior to each activity, the participant was asked to stand still for 10 s in order to record the static BW. This is to take note of the variations of the BW that was measured by the system. Before the use of the Pedar system, it was calibrated using the recommended Trublu pressure vessel (Novel GmbH, Munich, Germany). The first and last 5 s of recording were ignored and only 8 consecutive left and right steps were selected for analysis.
The data were collected and Equation (4) was used to calculate the bodyweight of the participant during both the static and dynamic phases. The baseline offset is supposed to be 0 if the foot is completely off the ground. However, the baseline is always near zero but never exactly at 0. This may be due to the residual stress in existence when the shoe is tight. Taking the baseline into consideration, the baseline values were treated in 2 different manners. The first was just to zero the baseline values below a threshold of 50 N. The second was to correct the entire set of data with respect to the baseline. In other words, we deducted the mean baseline value from the entire set of data. The body weight calculated from the 3 methods were normalisd to the values obtained from the force plate measurement. In addition, the disparities between each step within a specific activity were investigated. A full gait cycle is defined as heel strike to heel strike of the same foot. During a full gait cycle, the total impulse is expected to be approximately the same, with only slight variations between steps. To analyse the BW calculated for one full gait cycle, the time at the first heel strike left (HSLi) to the second heel strike left (HSLi+1) is used to calculate the summation of impulse between the left and right foot during that time phase, divided by the time difference of HSLi and HSLi+1. This was repeated for all 8 steps starting from HSL within each activity. Similarly, this was carried out for the calculation of the BW starting from heel strike right (HSR). With both sets of data, starting from HSL and HSR, we calculated the mean and standard deviation within each activity. This investigation was carried out to understand the degree of variations that may occur due to the influence of the gait itself. Ideally, the calculated static and dynamic BWs from the Pedar system should be the same as the value obtained from the Kistler force plate.
3. Results
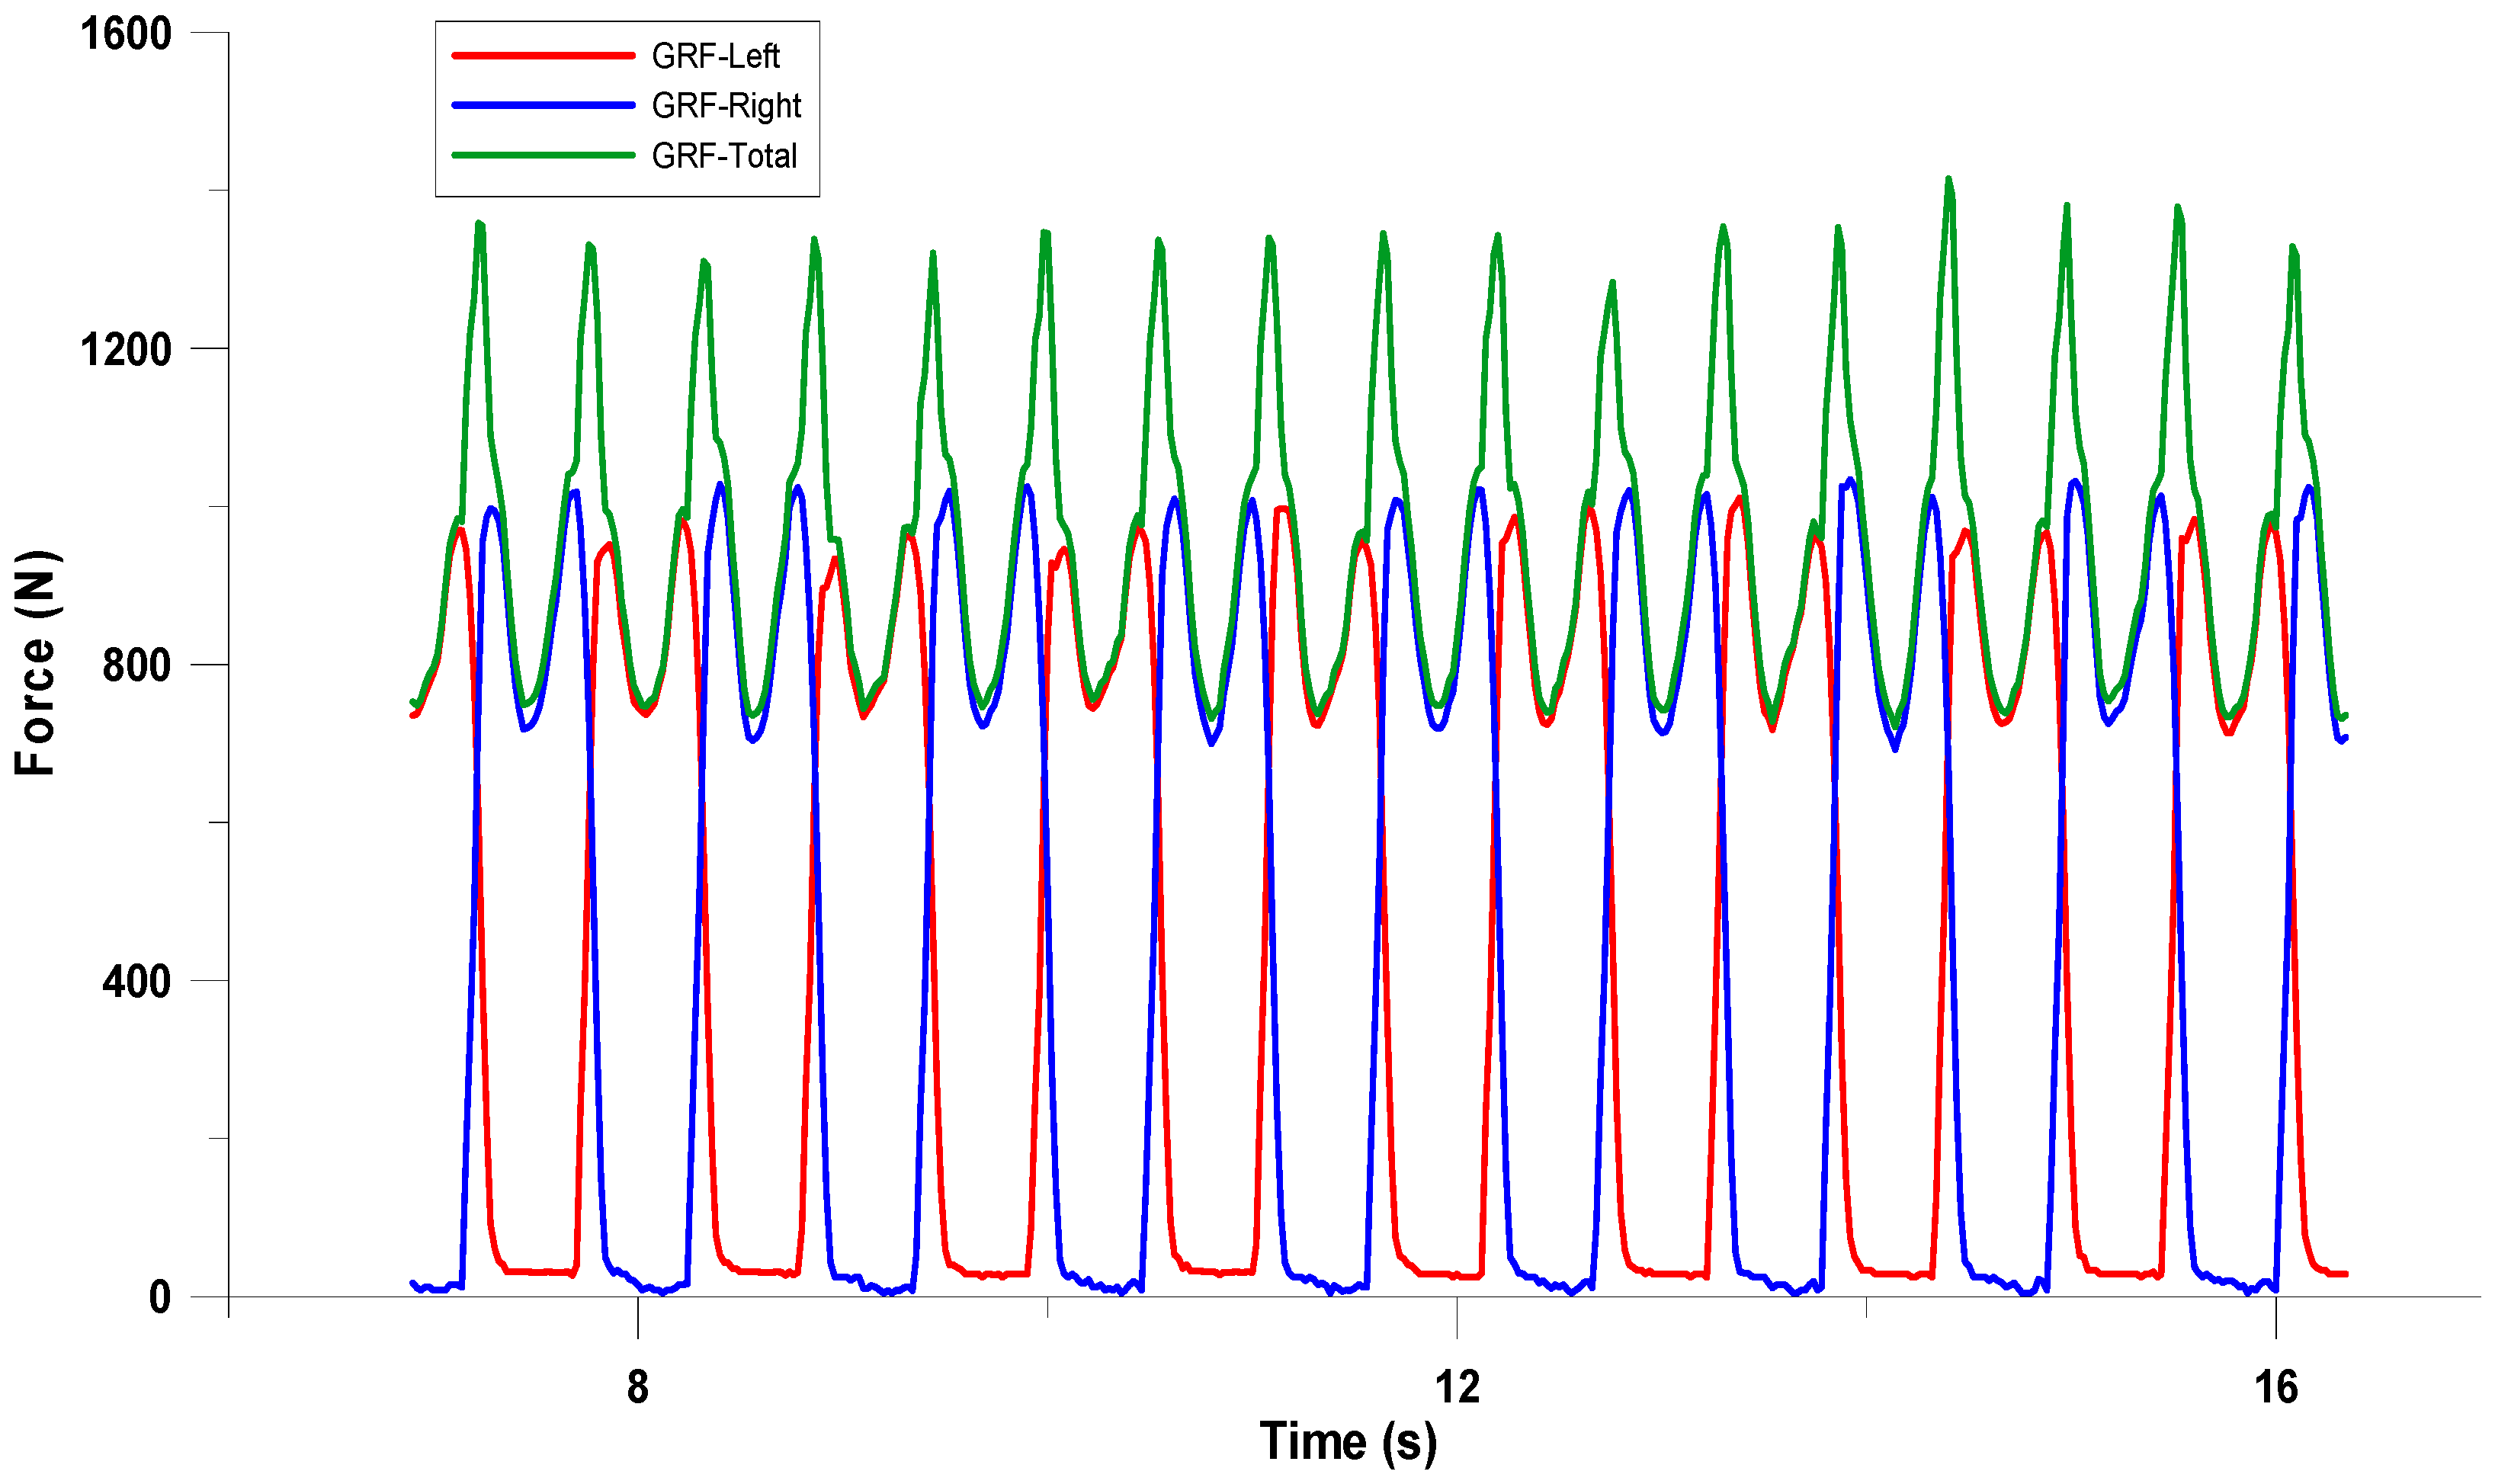
Figure 1 shows an example of the data obtained from the experiment. The green line was used to find the mean bodyweight of the participant with respect to time. It was noticed that the peaks of the summed forces occur at the double stance phase of the walk. Do take note that the double stance phase is not existent during running. From the force plate measurement, the participants body weight was determined to be 902.7 N.
Table 1 shows the calculated BWs normalized to the actual BW for all activities measured. The trend was that the forces calculated for Baseline Values Zeroed and Data Corrected by Baseline methods were lower than the original force output without baseline correction. This is understandable as the Pedar system does not return negative values. As such, activities that started with a force value higher than the actual bodyweight benefitted from the correction methods but not when the forces measured were lower to begin with, in particular, the 2 running activities. The results of the walks and limping activities seemed to have improved with the implementation of baseline correction methods. However, the results from the Medium and Fast speed runs were significantly lower than the walks and the limp. This was unexpected and needed a more thorough analysis. The normalized static BW had a mean error of 10.17%. This was calculated by taking the mean of the static normalized BW, taken prior to the start of each dynamic experiment. This was higher than all corresponding dynamic activies. When grouping the locomotion into 3 groups: running, walking and zero (static), then the BW increases as the locomotion group speed decreases. By identifying this trend, we suspect that the accuracy of the results is dependent on the speed of the dynamic activity.
To look at the running data in greater detail, the data was compared to the medium speed walking.
Figure 2a shows the data points for the fast running whereas
Figure 2b shows the data points for medium speed walking. It was noticed that there were not enough data to capture the peak forces during running. Several data points were located at the force peaks during medium speed walking, indicating that the sampling rate of the system was sufficient, whereas, only one single date point was located at the peak force during running. This indicated that the force measured by Pedar for running was incorrect as the peak forces were probably not captured. This may explain the relatively lower values obtained during running.
In order to look at the variation of the body weight measurement in greater detail, individual steps, defined as heel strike to heel strike force measurement of the same foot, was investigated within each activity.
Table 2 summarizes the results obtained.
Once again, the inability of Pedar to perform when running was clearly seen. The higher standard deviations during runs shows the lack of repeatability in the system. The increase in standard deviation is not a matter of the instability of the participant during high speed movements. This could be verified by the slow limping action which had been artificially induced. The limping action was slower than both the medium speed and fast speed walking and yet the standard deviations of both the left and right feet are higher. Thus, it is not recommended to use the Pedar with a sampling rate of 50 Hz to measure plantar force or pressure during running. Researches in running, using the Pedar at 50 Hz sampling rates may have questionable results [
6,
7].
Upon identifying the limitations of the data derived for running, we narrowed the findings of the correction method to only the walking and limping activities. The errors returned by the Pedar insoles are 6.01% on average and the correction method 1, Baseline values zeroed, improved the accuracy of the insoles by approximately 1.75% on average, whereas, correction method 2, subtracting baseline values from entire signal, improved the accuracy by 4.02% on average.
4. Discussion and Conclusions
The use of the Pedar involves an initial unloading procedure of the insoles while the insoles are in the shoes worn by the user. This is to capture the baseline pressure which exist due to the presence of inherent stress when the sole of the foot is in contact with the insoles in a confined, tight space. Nevertheless, the baseline pressure was not eliminated completely in almost all cases. This may be the reason why the static BW measurement had a relatively high mean error of 10%. For greater accuracy, the baseline pressure may have to be removed manually after collection of the data. Two methods had been introduced in this report and it seemed like the deduction of the mean baseline pressure from the entire data set returned better results. This, in so far, makes sense as the sensors are designed to measure a change in pressure. If the baseline is removed, then what we obtain is the change in pressure from offloading to full loading of the insoles, which in turn, returns the force exerted on the ground. With baseline correction, the accuracy of the Pedar system can be improved by approximately 4%, from 6% error to 2%. We have thus established a method to quantify the accuracy of plantar pressure measurement devices without the need of other equipment and, at the same time, to improve the output of these devices. These are our initial findings, but more tests should be carried out, with a larger pool of participants, to establish the repeatability of the results. Other baseline correction methods should be explored as well.


