Proceeding Paper

Influence of Toe-Hang vs. Face-Balanced Putter Design on Golfer Applied Kinetics †

1
Department of Human Kinetics, St. Francis Xavier University, Antigonish, NS B2G 2L9, Canada
2
PING, Phoenix, AZ 85029, USA
*
Author to whom correspondence should be addressed.
Presented at the 12th Conference of the International Sports Engineering Association, Brisbane, Queensland, Australia, 26–29 March 2018.
Proceedings 2018, 2(6), 244; https://doi.org/10.3390/proceedings2060244
Published: 23 February 2018

Abstract

:
The influence of the location of the center of mass (cm) of the putter head, relative to the shaft, on golfer applied kinetics at the grip was investigated. Participants made 12 attempts at a straight up-hill (2.2° slope) 8 ft putt with half of the attempts executed using a PING Anser 4 toe-hang putter (TH) and half with an Anser 5 face-balanced putter (FB). The net torque applied by the golfer, acting about the long axis of the shaft, was significantly greater in magnitude with the TH putter in comparison to the FB putter. The TH putter was also associated with a higher angular velocity about the shaft and a more open face at impact. These findings may have important implications for fitting the style of putter to a particular stroke or individual golfer as golfer applied kinetics would be strongly associated with the ‘feel’ of a putter.

1. Introduction

The design of a golf club can have important influences on golfer performance. For example, increasing the mass of a driver typically results in a reduction in the maximum clubhead speed that can be generated [1]. Presumably this is due to a relatively fixed applied impulse (kinetics) acting on an increased mass, which results in less change in velocity on the downswing. There is also evidence to suggest that golf club design features that influence the ‘feel’ of club to the golfer may alter the kinetic profile the golfer applies to the club. For example, [2] found that golfers change their swing kinematics with changes in shaft stiffness, yet these changes disappeared when the researchers blocked the golfers’ ability to perceive changes in shaft stiffness. Similarly, [3] demonstrated that shaft stiffness meaningfully influenced grip kinematics and suggested that this was due to the golfer applying a different kinetic pattern to the grip in response to how the club felt during the swing.
Since golfer applied kinetics (along with gravity and air resistance) completely determine the motion and orientation of the club at impact, it is important to understand how golf club design features may influence these kinetics. Several researchers have investigated golfer applied kinetics using the methods of inverse dynamics [4,5,6,7]; yet, only [4] examined the influence of club design features on swing kinetics and their study was only 2D in nature. A single study has measured 3D putter kinetics [8]; however, only two participants and a single putter style were analyzed using relatively outdated 3D methods (two cameras operating at 30 Hz). Therefore, the purpose of this study was to investigate the influence of putter design (toe-hang vs. face-balanced) on golfer applied kinetics.

2. Methods

2.1. Participants

Thirty-three right-handed golfers (age: 29.4 ± 7.8, handicap: 10.3 ± 4.2) volunteered to participate. The study was approved by the University’s Research Ethics Board, and testing procedures, risks, and time required were fully explained to each participant before they read and signed an informed consent document.

2.2. Procedures

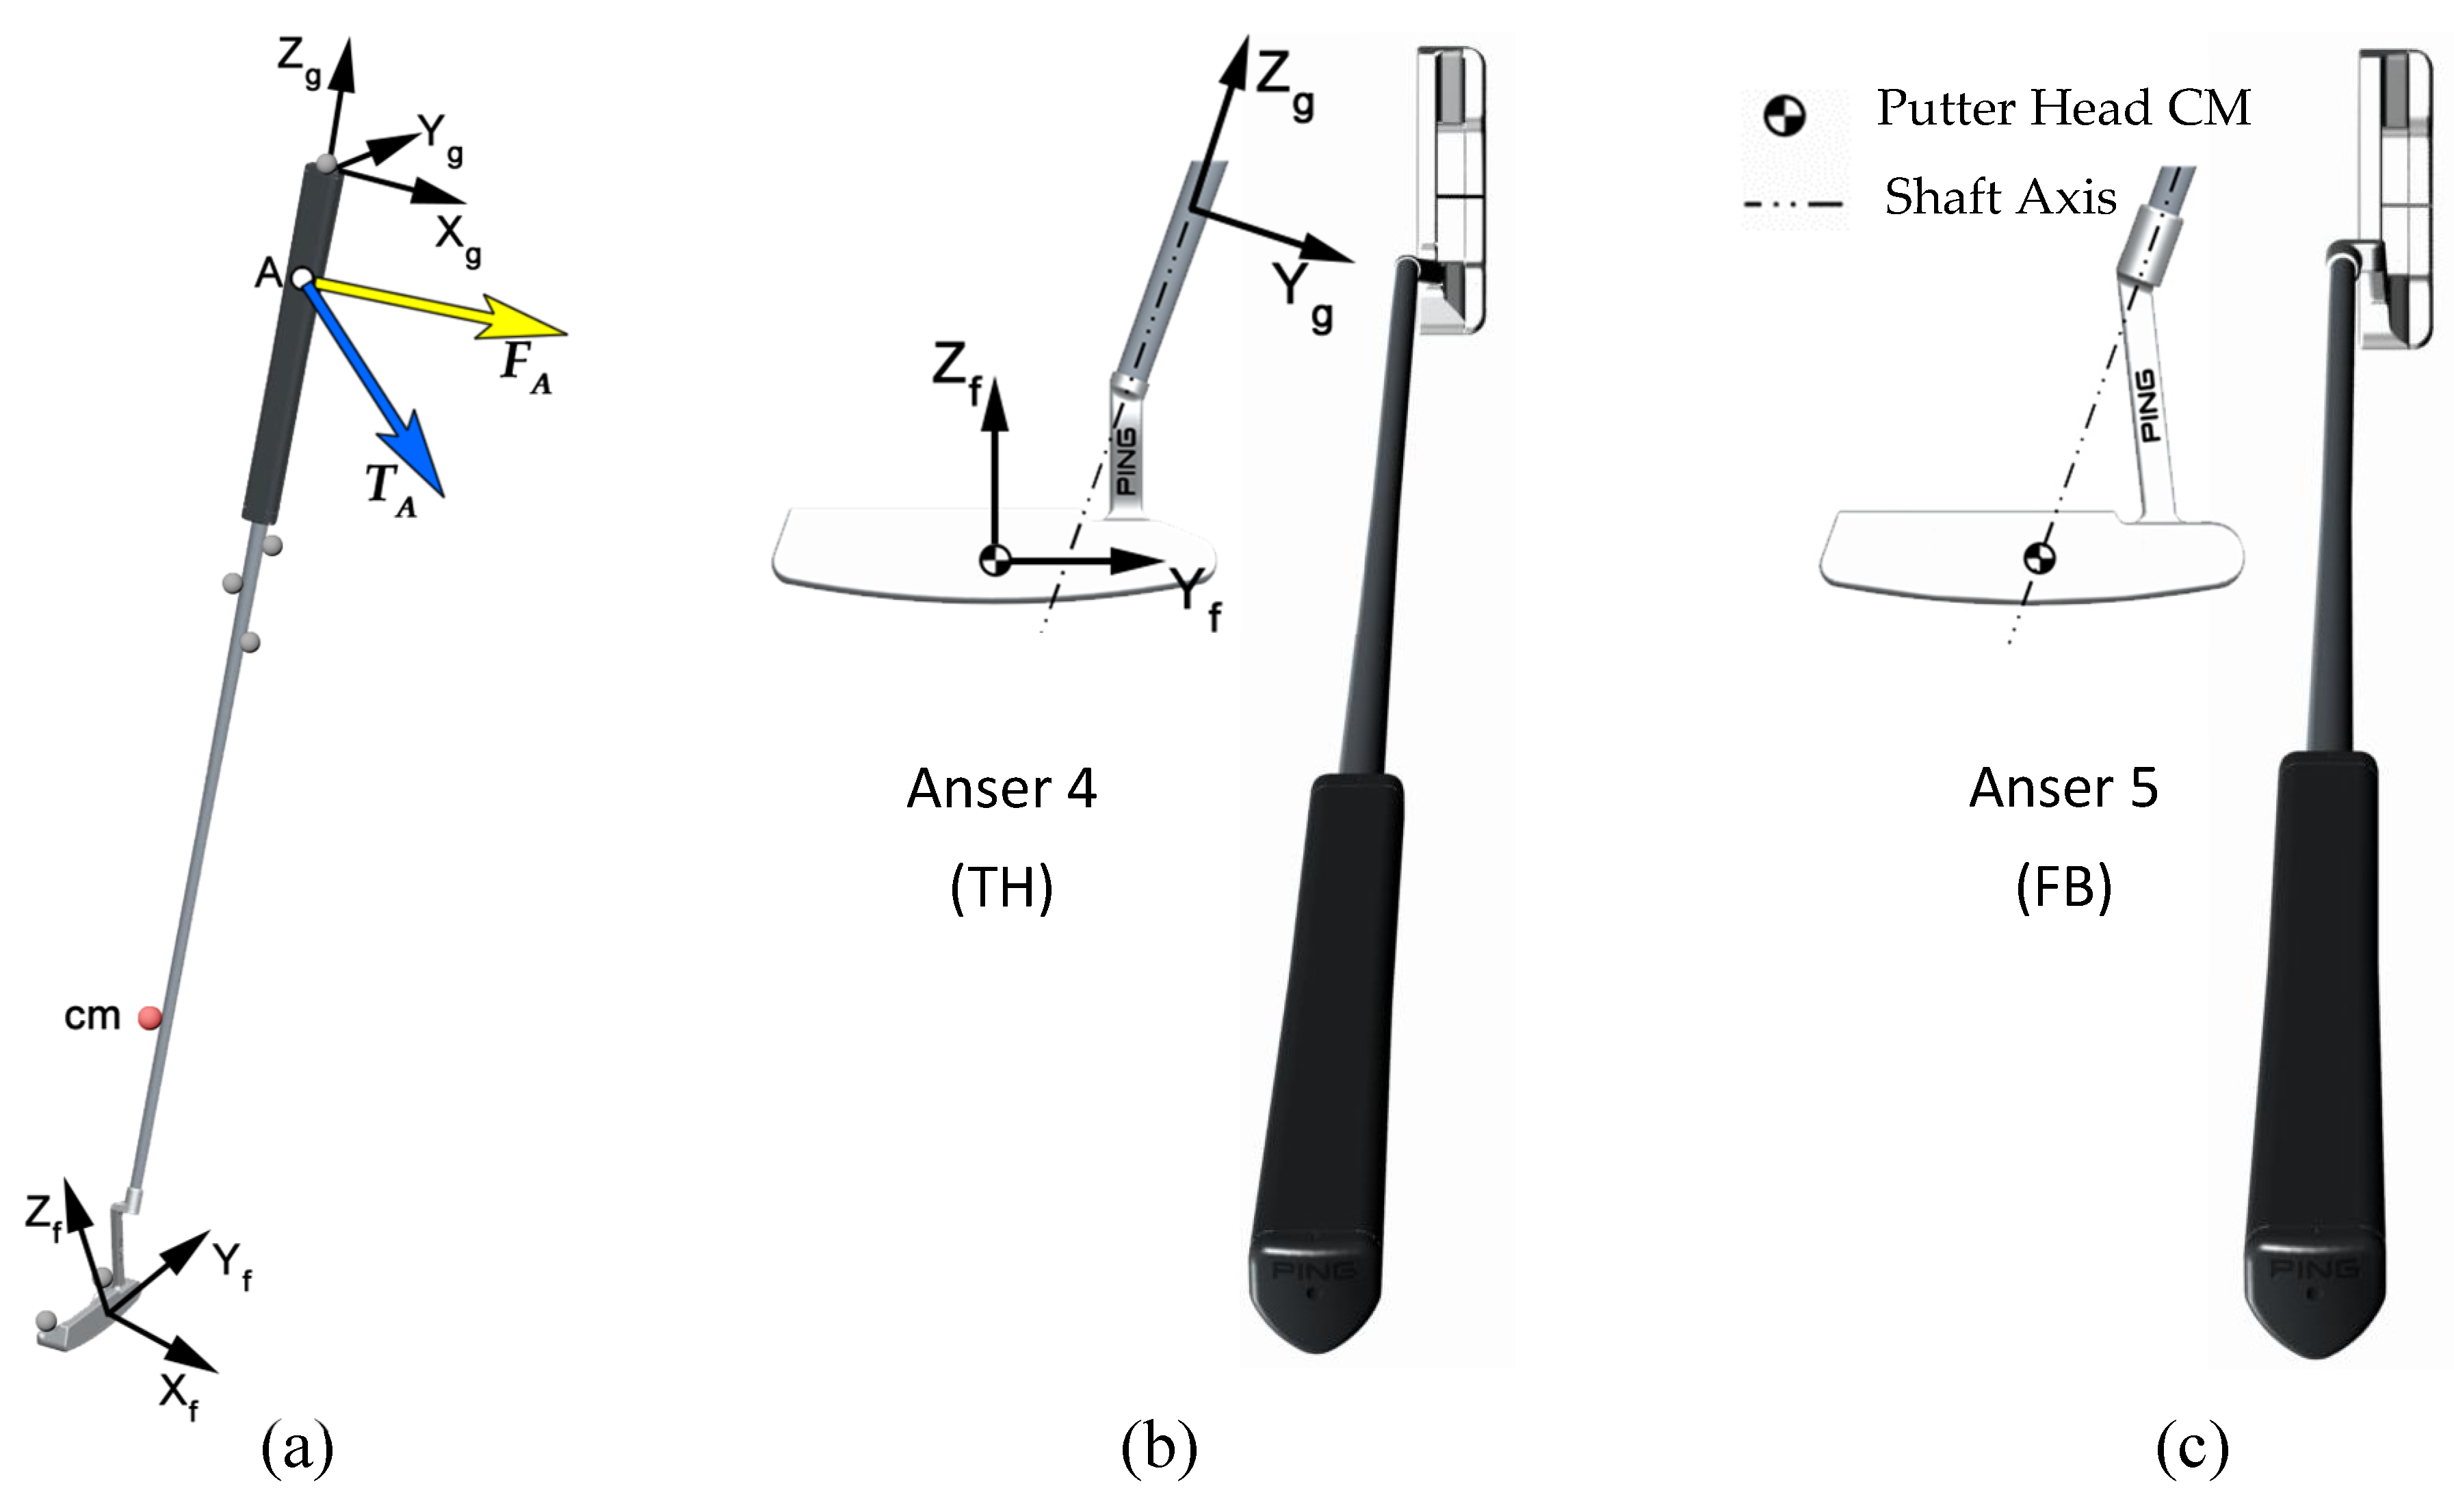
The study design consisted of two sessions; a fitting/practice session followed by a testing session on a separate day. During the first session, participants were fitted for putter length and one of three lie options (17°, 20°, or 23°). Participants then hit practice putts with both a Ping Anser 4 and a Ping Anser 5 putter (Figure 1). The Anser 4 is considered a toe-hang (TH) putter with the putter head cm meaningfully out-of-line with the shaft, while the Anser 5 is considered a face-balanced (FB) putter with the putter head cm being very close to the line of the shaft (Table 1). All putts were executed on an adjustable slope green that was 6.5 m long × 2.5 m wide (Pro Putt Systems, Huntersville, NC, USA) with an average stimp of 10.5 feet. On the test day, participants executed six putts with the TH putter and six putts with the FB putter. The test putt was 2.44 m long, straight up a 2.2° slope, and orientated diagonally across the green to minimize the sides of the green influencing the ability to aim. The odd numbered participants executed all putts with the FB putter fist, followed by the TH putter. Even numbered participants employed the reverse order. In between executing each test putt, participants moved to another section of the green and attempted to sink a 3.43 m putt to a different target hole. The 3.43 m putts were not analyzed for this paper.

2.3. Data Collection and Processing

Golf club kinematics were collected using an 8-camera optical system (Raptor-E, Motion Analysis Corporation, Santa Rosa, CA, USA). Six tracking markers were placed on the putter (Figure 1a). During a calibration procedure, additional markers were placed on club which allowed the creation of a grip reference frame and a clubface reference frame (Figure 1). If ball contact was made with the lie, loft, and face angle equal to 0°, then the clubface reference frame would be perfectly aligned with the global reference frame. The positive x-axis of the global reference frame originated at the bottom of the ball, when in the address position, and bisected the hole. The motion of the ball was also tracked by the camera system. Camera shutter speeds were set to 2000 Hz, and data were sampled at 250 Hz. The software application Cortex (version 5.3, Motion Analysis Corporation, Santa Rosa, CA, USA) was used to generate and export the 3D coordinate data for each marker. The residuals reported by the system were <1 mm and the accuracy (root mean square error when measuring a known distance) and precision (SD of the length of a rod) were approximately 0.3 mm. A bespoke software program was written in MatLab (version R2010a, MathWorks, Natick, MA, USA) to process the 3D coordinate data and generate dependent variables of interest. All variables reported at impact were calculated using the marker data up to and including the last frame prior to impact. A forward prediction procedure was then employed to determine the value of each variable at the anticipated moment of contact with the ball. The forward prediction procedure involved fitting a 2nd order polynomial to the 13 data points prior to impact as a function of time. The polynomial was then evaluated at the predicted time of impact.
A 3D inverse dynamics analysis was performed on the putter’s motion using a Newton-Euler formulation to determine the golfer applied kinetics at the grip. Calculations were completed with respect to the center of mass (cm) of the putter.
  • Symbols
  • FA  Net force applied to the grip by the golfer
  • m  Mass of the putter
  • acm  Linear acceleration of the putter’s cm
  • CA  Moment due to the couple applied to the grip by the golfer
  • MA  Moment due to the resultant net force applied to the grip by the golfer about the club cm
  • TA  Total moment (torque) exerted on the grip by the golfer
  • α  Angular acceleration of the putter
  • ω  Angular velocity of the putter
  • Icm  3 × 3 inertia matrix about the center of mass of the putter
  • rA_cm  Position vector from point A on the grip (10 cm from the butt) to the cm of the putter
F A + m g = m a c m
T A = C A + M A = I c m α + ω × ( I c m ω )
where,
M A = r A _ c m × F A
Components of TA expressed in the grip reference frame take the form
T A x = ( I c m x x α x ) ( I c m y y I c m z z ) ω y ω z + I c m x y ( α y ω z ω x ) + I c m y z ( ω y 2 ω z 2 ) + I c m z x ( α z + ω x ω y ) ,
T A y = ( I c m y y α y ) ( I c m z z I c m x x ) ω z ω x + I c m y z ( α z ω x ω y ) + I c m z x ( ω z 2 ω x 2 ) + I c m x y ( α x + ω y ω z ) ,
T A z = ( I c m z z α z ) ( I c m x x I c m y y ) ω x ω y + I c m z x ( α x ω y ω z ) + I c m x y ( ω x 2 ω y 2 ) + I c m y z ( α y + ω z ω x ) ,
Paired t-tests were used to compare the effects of the two levels of putter model on specific dependent variables. Statistical significance was set at α ≤ 0.05 for all tests. Statistical analyses were performed using SPSS V22.0 for Windows (IBM Co., New York, NY, USA).
Figure 1. (a) Marker set-up and reference frames (b) Anser 4, toe-hang model (c) Anser 5, face-balanced model.
Proceedings 02 00244 g001

3. Results

The pattern of TAx was similar for both putter models throughout the stroke, with the TH putter being associated with significantly higher values leading into impact (Figure 2a). The patterns of TAy were indistinguishable between putter models and follow an intuitive curve peaking near impact (Figure 2c). The patterns of TAz are very different between models with the FB putter being associated with near zero torque throughout the stroke (Figure 2b). While the patterns were similar, there are clear differences in terms of the peak magnitudes of the angular velocity about the z-axis of the grip between models (Figure 2d). A slightly higher percentage of putts were holed with the TH putter (56.1%) relative to the FB (52.5%), but this difference was not significant (p = 0.49) (Figure 2e). The angular velocity of the putter face about its z-axis, at impact, was significantly higher for the TH putter (31.7°/s) relative to the FB (28.5°/s) (p = 0.001).
On average, the ball launched significantly further to the right for the TH putter (0.36°) relative to the FB putter (0.18°), (p = 0.04) (Figure 3a). This was primarily the result of the face angle at impact being more open for the TH putter (0.69°) relative to the FB (0.04°), (p < 0.001) (Figure 3b). Participants demonstrated a leftward path for both putters (TH = −0.35°, FB = −0.30°) (Figure 3c). The putters were also significantly different in terms of horizontal impact spot on the face, with the TH putter being associated with an average contact spot 1.7 mm towards the heel and the FB putter having an average contact spot of 2.5 mm towards the toe (p < 0.001) (Figure 3d). As a practical estimate on the validity of the measurements, participant 20 holed all putts with the TH model. For these putts for participant 20, the average horizontal launch angle was −0.08°, path was 1.4°, and face angle was −0.32°.

4. Discussion

The primary objective of the study was to determine the influence of the location of the cm of the putter head, relative to the shaft, on golfer applied kinetics at the grip. The putter models employed (Anser 4 and Anser 5) were very similar in all regards with the exception of the head cm location relative to the shaft. The results demonstrate that the TAy golfer applied torque component, which is the golfer’s primary mechanism for developing clubhead speed, was virtually indistinguishable between putter models (Figure 2c). However, the golfer applied torque component TAz, which acts about the long axis of the shaft, was significantly different between models for the majority of the putting stroke (Figure 2b). Arguably, this component has most direct influence over the opening and closing of the putter face. This is important since the face angle of the putter at impact is responsible for at least 80% of the ball’s starting direction [9]. On average, participants applied practically zero net torque about the long axis of the FB putter throughout the entire stroke.
The kinematic differences reported were likely a function of both the varying inertial parameters between the putters as well as the kinetic differences due to the golfer applied forces and torques. Of note, was the finding that the TH putter was associated with a significantly more open face at impact despite also having a significantly higher rate of face angle closing at impact. It would seem that the higher inertia about the shaft, for the TH putter, results in a delay in the timing of the face closing. Despite an increased rate of closing late in the swing the face tends to remain open relative to the FB putter. Contacting the ball more towards the heel would tend to close the face during impact and perhaps dampen the influence of the delivered face angle on ball launch.

5. Conclusions

The results of this study provide insight into the kinematics and kinetics associated with the use of a face-balanced or a toe-hang putter. A common thought among golfers and fitters is that putters with different hosel designs can significantly influence a player’s stroke. Although there are some slight changes in the resulting kinematics of a player’s stroke, a player’s kinetics also significantly change when comparing the use of a toe-hang and face-balanced putter. Because of the changing kinetics, it appears as though a player’s kinematic stroke signature remains relatively distinct regardless of model, while subtle changes to kinematics also occur. The most practical of these changes to a golfer or club fitter would be the influence on impact location and face angle. To encourage a more heel-ward impact location or more open face angle at impact, a player would be best served by a TH style putter. Conversely, a FB model would promote a more toe-ward impact location and more closed face angle at impact.

Conflicts of Interest

The authors declare no conflict of interest.

References

  1. MacKenzie, S.J.; Ryan, B.; Rice, A. The influence of clubhead mass on clubhead and golf ball kinematics. Int. J. Golf Sci. 2016, 4, 136–146. [Google Scholar] [CrossRef]
  2. Osis, S.T.; Stefanyshyn, D.J. Golf players exhibit changes to grip speed parameters during club release in response to changes in club stiffness. Hum. Mov Sci. 2012, 31, 91–100. [Google Scholar] [CrossRef] [PubMed]
  3. MacKenzie, S.J.; Boucher, D.E. The influence of golf shaft stiffness on grip and clubhead kinematics. J. Sports Sci. 2017, 35, 105–111. [Google Scholar] [CrossRef] [PubMed]
  4. Budney, D.R.; Bellow, D.G. Kinetic analysis of a golf swing. Res Q. 1979, 50, 171–179. [Google Scholar] [CrossRef] [PubMed]
  5. Neal, R.J.; Wilson, B.D. 3D kinematics and kinetics of the golf swing. Int. J. Sports Biomech. 1985, 1, 221–232. [Google Scholar] [CrossRef]
  6. Nesbit, S.M. A three dimensional kinematic and kinetic study of the golf swing. J. Sports Sci. Med. 2005, 4, 499–519. [Google Scholar] [PubMed]
  7. Vaughan, C.L. A three-dimensional analysis of the forces and torques applied by a golfer during the downswing. In International Series of Biomechanics VII-B, 1st ed.; Morecki, A., Fidelus, K., Kedzior, K., Wit, A., Eds.; University Park Press: Warsaw, Poland, 1981; pp. 325–331. [Google Scholar]
  8. Shimizu, T.; Tsuchida, M.; Kawai, K.; Takahashi, K.; Arakawa, K.; Satoh, M. An analysis of the putter face control mechanism in golf putting. Sports Eng. 2009, 12, 21–30. [Google Scholar] [CrossRef]
  9. MacKenzie, S.J.; Foley, S.M.; Adamczyk, A.P. Visually focusing on the far versus the near target during the putting stroke. J. Sports Sci. 2011, 29, 1243–1251. [Google Scholar] [CrossRef] [PubMed]
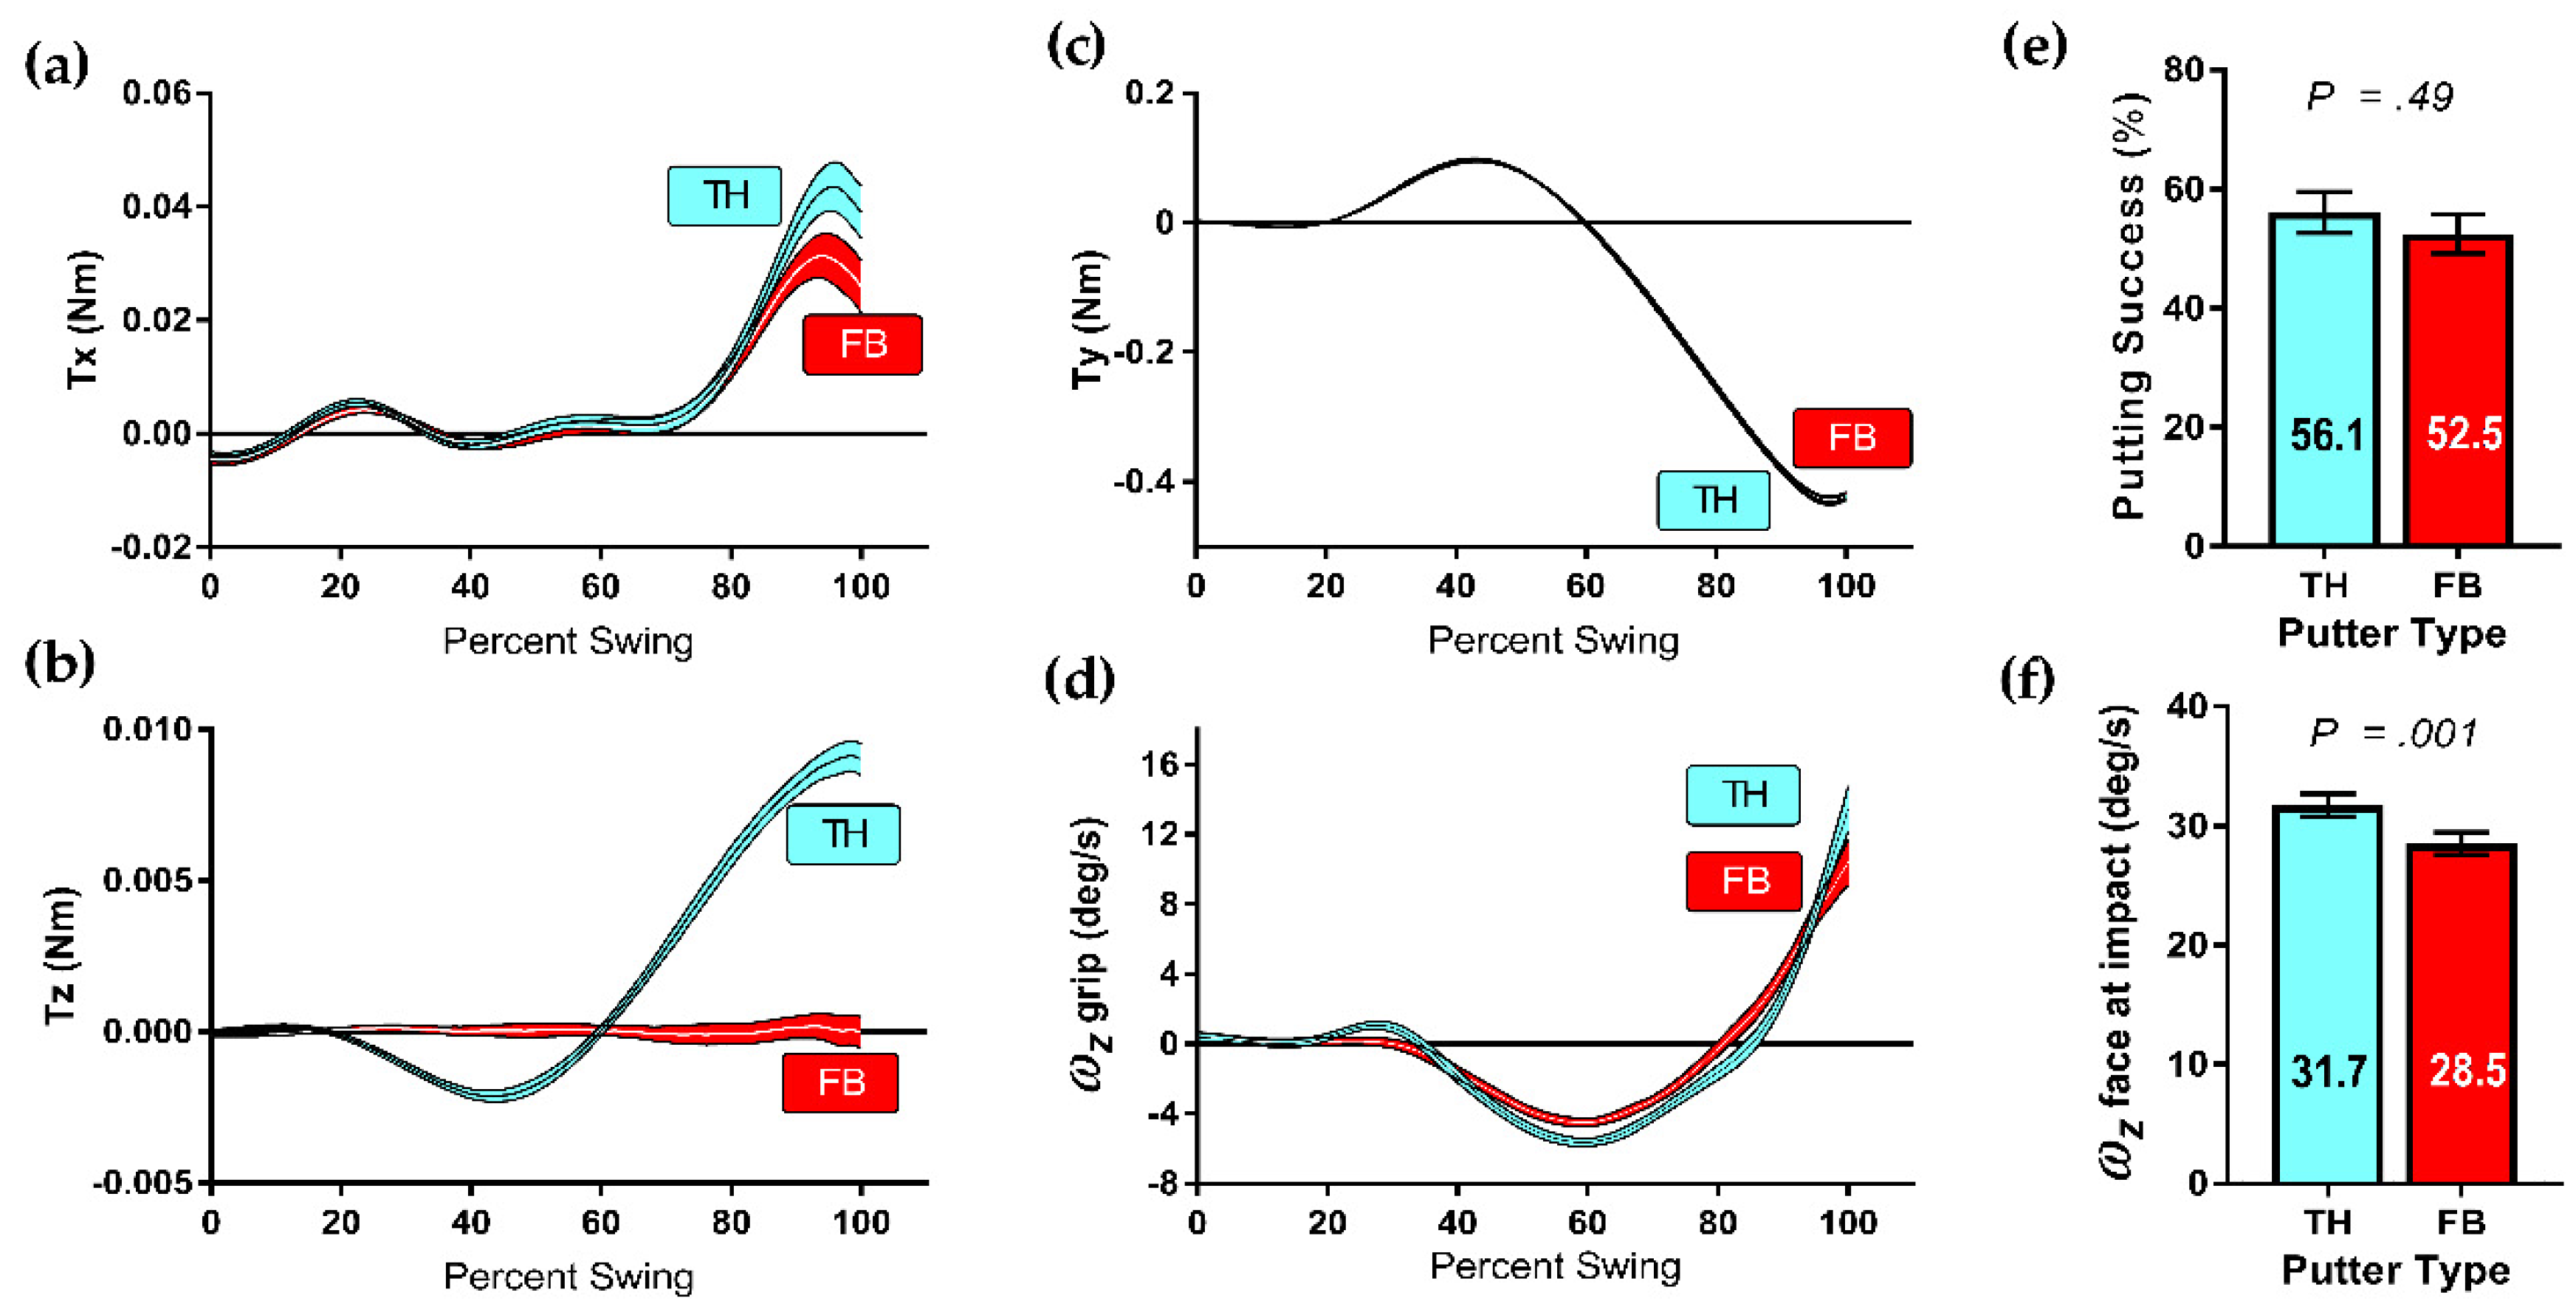
Figure 2. Total torque applied to the putter by the golfer expressed as components in the grip reference frame (a) TAx (b) TAz (c) TAy (d) Angular velocity of the club about the long axis of the shaft. Each curve is the ensemble average of all putts for all participants as a percentage of stroke duration. The forward stroke starts at approximately 80%. Shaded bands represent 95% within-subject confidence intervals (e) Percentage of successfully holed putts (f) Angular velocity of the face about its z-axis at impact.
Proceedings 02 00244 g002
Figure 3. (a) Initial horizontal launch direction of the ball (b) face angle at impact; positive is pointing to the right (c) putter path at impact; positive is to the right (d) impact spot location on the face. These are average values across all participants. Error bars represent 95% within-subject confidence intervals.
Proceedings 02 00244 g003
Table 1. Inertial properties and cm location of the Anser 4 (TH) and Anser 5 (FB) putters.
Mass
(kg)
CMxg
(m)
CMyg
(m)
CMzg
(m)
Icmxx
kg m2
Icmyy
kg m2
Icmzz
kg m2
Icmxy
kg m2
Icmyz
kg m2
Icmzx
kg m2
TH0.6082−0.0070−0.0093−0.6150.0681550.0678650.000447−0.000027−0.001612−0.001090
FB0.6034−0.0089−4 × 10⁻⁹−0.6230.0664940.0662230.0004018 × 10−7−0.000126−0.001316
Publisher’s Note: MDPI stays neutral with regard to jurisdictional claims in published maps and institutional affiliations.