Abstract
For an athlete to make an appropriate decision and successfully perform a skill, they need to perceive opportunities for action by visually exploring their environment. The head movements that support visual exploration can easily and accurately be recorded using Micro-Electro-Mechanical Systems (MEMS) Inertial Measurement Units (IMU) in research and applied settings. However, for IMU technology to be effective in applied settings, practitioners need to be able to communicate data to coaches and players. This paper presents methods of visualising and communicating exploratory head movement data, with the aim of giving a better understanding of (a) individual differences in exploratory action, and (b) how IMUs can be used in applied settings to assess and monitor visual exploratory action.
1. Introduction
Before an athlete is able to perform an action, such as a pass or interception, they must visually perceive the environment for the available opportunities to act. This is achieved through movement of the eyes, head and body, and is termed visual exploratory action [1,2,3]. Visual exploration is important for the effectiveness and efficiency of decision making. Without visual exploration, an athlete’s ability to perceive the environment is greatly limited. Consequently, the athlete is less aware of what actions—as determined by the relationship between the environment and the athlete’s action capabilities—are possible, and less able to make the best decision for a given situation.
The investigation of visual perception in sport has traditionally been interested in the eye movements of athletes, and has utilised eye-movement registration technology [4]. Typically, however, this method has various limitations that restrict the practical application of any research findings [1,5]. A small amount of research has investigated the exploratory head movements of footballers while playing in representative environments [6,7,8]. This research shows the importance of exploratory head movement for performance, and, as data was collected in situ, also gives an understanding of the actual behaviours players demonstrate while playing. Unfortunately, current methodologies for researching head movements in football are limited to a third party manually counting head turns captured by video [6,7,8]. Given the difficulty of manually counting such fast and complex movements, this method of data collection likely results in a degree of error which reduces the accuracy of head movement quantification in sporting environments [6,9].
To overcome the limitations of eye-movement and video-based technologies, inertial measurement units (IMU) may be used to quantify the exploratory head movements of athletes [9]. Exploratory head movements occur rapidly in fast-paced sporting environments. IMU’s are suitable for this application due to the removal of human error during data collection and analysis, high sampling rates and their sensitivity to small motion from the Micro-Electro-Mechanical Systems (MEMS) nature of the sensor [10]. Additionally, as these units are small, lightweight and inexpensive they afford a solution to quantify the exploratory head movement of athletes in situ.
Research findings can be used to inform training methods, develop player actions and ultimately improve performance. However, for this to be effective, IMU data collected within applied settings needs to be understood and communicated with players and coaches by presenting information in simple and informative ways [11].
With the above considerations in mind, the current paper aimed to demonstrate various ways of communicating visual exploratory data obtained from IMU’s. In doing so, a controlled perception-action football task which replicated a common match situation was used to obtain head movement IMU data. This data was analysed on an individual basis to demonstrate how head movement data, obtained from an IMU, could be presented to coaches and athletes in an applied situation.
2. Materials
A single 9DOF inertial sensor unit, SABELSense (Griffith University, Nathan, Australia) [12,13], which incorporates a ±7 Gauss 3DOF magnetometer, a ±2000°/s 3DOF gyroscope, and a ±16 g 3DOF accelerometer, was used to collect head movement data of the participants. The sensor unit encompasses a LED for synchronisation, SD card for storage, and a sampling rate of 250 Hz. Prior to data collection the IMU sensor was calibrated [14]. The IMU was secured to an elastic headband and worn by the participants such that the device was positioned at the external occipital protuberance.
Proceeding the completion of trials, IMU sensor data was downloaded to a PC with a custom MATLAB analytics script (Mathworks, Natick, MA, USA). This analysis utilised a gradient descent based orientation filter, Attitude and Heading Reference System (AHRS), to fuse the 9DOF IMU data [15]. This approach outputs orientation information (yaw, pitch, and roll), which is in a global reference frame with respect to gravity and the Earth’s magnetic field. The filter is accurate in dynamic situations, with a maximal RMS error of <1.7° when contrasted to retroreflective motion capture [15]. To weight the accelerometer signal adequately to obtain accurate measures of heading, the filter is tunable with the value, beta. In this case, the beta value was calculated [15] as 0.041 and represents the inherent errors in the sensor, for example non-orthogonality or sensor misalignment. Yaw movements were examined, with exploratory head movements being flagged using a dynamic threshold-based peak detection method. This was done by using a 10-frame moving window, and finding the rate of horizontal change above 0.5 or below −0.5. The frequency of head turns was calculated by dividing the number of head turns by the elapsed time, giving an exploration frequency in head turns per second.
3. Methods
Participants were 12 male football players aged 16 to 18 years (M = 17.25, SD = 0.75) with 9 to 14 years playing experience (M = 12.42, SD = 1.44). All participants played for the same semi-professional club, which participated in the Australian National Premier League competition. Participants were conveniently recruited and represented the playing ability and standard of competitive-elite youth players in Australia. Participants (and their parent/guardians where appropriate) gave informed consent/assent prior to taking part in the experiment. The research was approved by the lead institution’s Human Research Ethics Committee (Application ID: 2016-230E) and participants were free to withdraw at any stage.
The experimental task was designed to replicate a game situation in which a player would receive a pass from a teammate, then complete a pass to a different teammate. The experiment was designed in a controlled laboratory environment, but efforts were made to make the task representative of the actual game situation which was being replicated. The participant would begin each trial facing a 15-inch laptop (Apple Inc., Cupertino, CA, USA) which displayed a video of a teammate player passing a ball towards the participant. The laptop was connected to four external monitors (Dell 2209WA, Round Rock, TX, USA), which were positioned at 100 degrees and 150 degrees to the left and right of the participant, at a distance of 3 m away. Each of the four connected monitors would display videos of either an open field, an opponent player, an unmarked teammate player, or a teammate marked by an opponent player. Therefore, as in a real game, the participant was completely surrounded by potentially useful information. The participant’s task was always to pass to the unmarked teammate player.
Using a custom-made PsychoPy [16] script, each trial was programmed to display the videos at predetermined times following the initiation of the trial. A trial was initiated when the participant pressed the spacebar on the laptop. Upon initiating a trial, an audible beep was followed by black screens on the laptop and four external monitors. The custom script randomly selected a time between one and four seconds, after which the videos began playing on the laptop and each of the four external monitors. The passing video, displayed on the laptop, was timed such that the ball would exit the screen after one, two or three seconds from the start of the video. Once the ball left the laptop screen, the participant was then in possession of the ball, and could make a pass to the unmarked teammate by kicking a sports cone which corresponded to the monitor displaying the unmarked teammate. Once a cone had been kicked, the trial was finished and the participant could initiate the next trial by pressing the spacebar. Each participant completed four blocks of 24 trials, resulting in a total of 96 trials per participant. The time between the participant gaining possession of the ball and kicking the cone was defined as being in possession. The duration of time in possession was also recorded as their response time.
4. Results
To gain an initial understanding of the data, each participant’s average head turn frequency before receiving the ball was plotted against their average response time (Figure 1). Further, the six participants with the fastest average response times have been coloured green, and the six participants with the slowest average response times coloured with red. Displaying the data in this way gives an understanding of individual differences in exploration frequency and response time between players. Pearson correlation indicates a moderate negative correlation between head turn frequency and response time, r = −0.499, 95% BCa CI [−0.802, −0.138], p = 0.05.
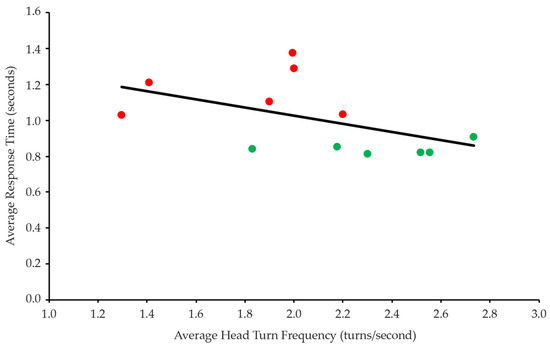
Figure 1.
Average head turn frequency and average response time for each participant. Green markers indicate fast participants, red markers indicate slow participants. Trend line indicates moderate correlation, R2 = 0.249.
As can be seen from Figure 1, while generally a higher exploration frequency is related to a faster response time, this may not always be true. It appears players may not all display the same relationship between head turn frequency and response time, therefore, it is important for practitioners to take an individualised approach to the data [17].
Figure 2 shows exemplar data from two participants. In each graph, an individual’s data is represented as a histogram of the number of trials in which each head turn frequency was used during the trial. Data were grouped into 80 bins between zero and four head turns per second, resulting in bin widths of 0.05 Hz. Additionally, the mean response time and mean head turn frequency are given, as well as a marker to show where the average head turn frequency falls in the data.
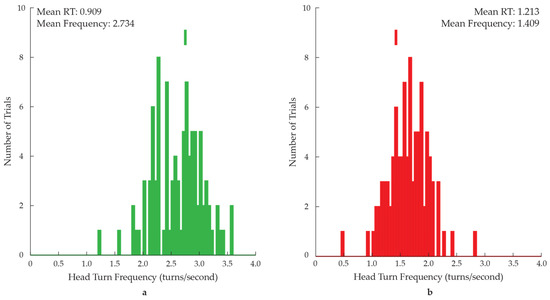
Figure 2.
Histogram of head turn frequency across all trials for a fast participant (a) and a slow participant (b). Vertical marker indicates location of mean head turn frequency.
Given that there appears to be individual differences in the frequency of exploratory head movements between players, an understanding of where individual players explore is important. Knowing how often a player changes their head orientation is informative (as in the case with head turn frequency), but knowing where a player orients their exploration may give additional information about how they discover information in the environment to achieve the task. The orientation of the IMU in the horizontal plane was used to plot a polar histogram to show the percentage of time the participant’s head was oriented relative to the laptop and external monitors (Figure 3). Data were binned in 10 degree increments, and labels were added to indicate the location of the laptop and four external monitors. With this representation of the data, it is easy to see where players predominantly explored while completing the passing task. For example, it can be seen that the slow participant spent much more time facing display number one than display number three.
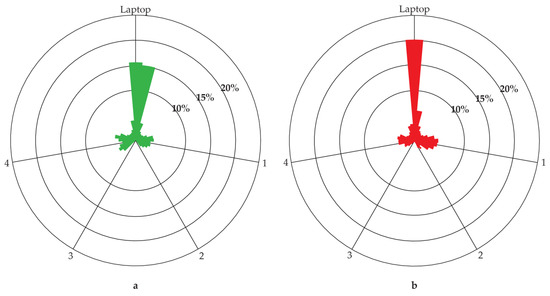
Figure 3.
Distribution of head orientation across all trials for a fast participant (a) and a slow participant (b). Numbers indicate location of external computer monitors. Concentric circles indicate the percentage of time the head was oriented in that direction over all trials.
5. Discussion
The current paper has demonstrated a number of ways of visualising head movement data obtained from an IMU while footballers completed a football passing task. The head movement data represents a method of quantifying visual exploratory action, which is used by players to perceive their environment to aid prospective control of movement. Applied practitioners could use these methods to help coaches gain a better understanding of a players’ exploratory actions, allowing more informed training methods and communication with players.
Figure 1 shows that players with a higher head turn frequency before receiving the ball are able to respond with a subsequent pass more quickly. In fast-paced environments such as football, frequent exploratory action before receiving the ball appears to be important for performance with the ball. As can be seen in Figure 2, while players display inter-trial variability in the frequency of their exploratory head movements, the participant that responded more quickly on average would more often use a higher frequency of head movements than the slow responding participant.
By plotting head orientation data (Figure 3), we are able to gain a deeper understanding of the exploratory head movement of a player. Visualising head turn frequency gives an understanding of how much a player is exploring, whereas visualising the distribution of head orientation gives an understanding of where a player is predominantly exploring. In the above example, data is given context by labelling the data relative to the experimental environment. In more applied settings, data could be given context by showing data relative to important information in the playing environmental (i.e., potential affordances), such as teammates, opponents, the goals or the ball.
6. Conclusions
Technology has advanced to allow researchers to overcome the limitations of video-based technologies when collecting head movement data in representative environments [9]. Given the importance of head movements for visual perception and prospective control of movements [6,8], access to this data could be very important for player learning and development. However, unless the data is able to be communicated to coaches and players, the data is not able to be used to its full potential. A combination of plots can be used to give context to the head movement data obtained from IMUs. The plots presented here show the relationship between exploratory head movement and the time taken to complete a pass (Figure 1), the variation in exploratory head movements within and between players (Figure 2), and the distribution of head orientation while completing the passing task (Figure 3). Presenting exploratory head movement data in various ways may aid in communicating the data to coaches and players [11], ensuring that the data can be used to improve performance.
Acknowledgments
While completing this research, Thomas B. McGuckian was supported by an Australian Government Research Training Program Scholarship.
Conflicts of Interest
The authors declare no conflict of interest. The funding sponsor had no role in the design of the study; in the collection, analyses, or interpretation of data; in the writing of the manuscript; or in the decision to publish the results.
References
- McGuckian, T.B.; Cole, M.H.; Pepping, G.-J. A systematic review of the technology-based assessment of visual perception and exploration behaviour in association football. J. Sports Sci. 2017, 1–20. [Google Scholar] [CrossRef] [PubMed]
- Gibson, J.J. An Ecological Approach to Visual Perception; Houghton-Mifflin: Boston, MA, USA, 1979. [Google Scholar]
- Reed, E.S. Encountering the World: Toward an Ecological Psychology; Oxford University Press: New York, NY, USA, 1996. [Google Scholar]
- Mann, D.L.; Williams, M.; Ward, P.; Janelle, C. Perceptual-cognitive expertise in sport: A meta-analysis. J. Sport Exerc. Psychol. 2007, 29, 457–478. [Google Scholar] [CrossRef] [PubMed]
- Travassos, B.; Araujo, D.; Davids, K.; O’hara, K.; Leitão, J.; Cortinhas, A. Expertise effects on decision-making in sport are constrained by requisite response behaviours—A meta-analysis. Psychol. Sport Exerc. 2013, 14, 211–219. [Google Scholar] [CrossRef]
- Jordet, G.; Bloomfield, J.; Heijmerikx, J. The hidden foundation of field vision in English Premier League (EPL) soccer players. In Proceedings of the MIT Sloan Sports Analytics Conference, Boston, MA, USA, 1–2 March 2013. [Google Scholar]
- McGuckian, T.B.; Askew, G.; Greenwood, D.; Chalkley, D.; Cole, M.; Pepping, G.J. The impact of constraints on visual exploratory behaviour in football. In Studies in Perception & Action XIV: Nineteenth International Conference on Perception and Action; Weast-Knapp, J.A., Pepping, G.-J., Eds.; Taylor & Francis: Abingdon, UK, 2017; pp. 85–87. [Google Scholar]
- Eldridge, D.; Pulling, C.; Robins, M.T. Visual exploratory activity and resultant behavioural analysis of youth midfield soccer players. J. Hum. Sport Exerc. 2013, 8, 560–577. [Google Scholar] [CrossRef]
- McGuckian, T.B.; Pepping, G.J. A wearable inertial sensor for improved measurement of exploration behaviour in sport compared to notational analysis. J. Fit. Res. 2016, 5, 40–42. [Google Scholar]
- Shepherd, J.B.; Thiel, D.V.; Espinosa, H.G. Evaluating the Use of Inertial-Magnetic Sensors to Assess Fatigue in Boxing during Intensive Training. IEEE Sens. Lett. 2017, 1, 1–4. [Google Scholar] [CrossRef]
- Buchheit, M. Want to see my report, coach? Sport science reporting in the real world. ASPETAR Sports Med. J. 2017, 6, 36–43. [Google Scholar]
- James, D.A.; Leadbetter, R.I.; Neeli, M.R.; Burkett, B.J.; Thiel, D.V.; Lee, J.B. An integrated swimming monitoring system for the biomechanical analysis of swimming strokes. Sports Technol. 2011, 4, 141–150. [Google Scholar] [CrossRef]
- Shepherd, J.B.; Wada, T.; Rowlands, D.; James, D.A. A Novel AHRS Inertial Sensor-Based Algorithm for Wheelchair Propulsion Performance Analysis. Algorithms 2016, 9, 55. [Google Scholar] [CrossRef]
- Lai, A.; James, D.A.; Hayes, J.P.; Harvey, E.C. Semi-automatic calibration technique using six inertial frames of reference. In Proceedings of the Microelectronics, Mems, and Nanotechnology, Perth, Australia, 10–12 December 2003; International Society for Optics and Photonics: Bellingham, WA, USA, 2004. [Google Scholar]
- Madgwick, S.O.H.; Harrison, A.J.L.; Vaidyanathan, R. Estimation of IMU and MARG orientation using a gradient descent algorithm. In Proceedings of the 2011 IEEE International Conference on Rehabilitation Robotics (ICORR), Zurich, Switzerland, 27 June–1 July 2011. [Google Scholar]
- Peirce, J.W. Generating stimuli for neuroscience using PsychoPy. Front. Neuroinform. 2009, 2. [Google Scholar] [CrossRef] [PubMed]
- Dicks, M.; Button, C.; Davids, K.; Chow, J.Y.; Van der Kamp, J. Keeping an eye on noisy movements: On different approaches to perceptual-motor skill research and training. Sports Med. 2017, 47, 575–581. [Google Scholar] [CrossRef] [PubMed]
Publisher’s Note: MDPI stays neutral with regard to jurisdictional claims in published maps and institutional affiliations. |
© 2022 by the authors. Licensee MDPI, Basel, Switzerland. This article is an open access article distributed under the terms and conditions of the Creative Commons Attribution (CC BY) license (https://creativecommons.org/licenses/by/4.0/).