Abstract
Active fabrics providing better comfort of the garments and footwear rapidly become an essential part of our life. However, only limited information about the performance of such fabrics is commonly available for the garment and footwear designers, and tests are often done only with the final products. Thus development of the objective testing methods for the fabric assemblies containing microporous membranes and garments using them is one of the important topics. Garment tests in the climate chamber when exercising in windy and rainy conditions with a set of temperature and humidity sensors placed over the body allow comparing manufactured garments for thermal and humidity comfort. To allow for better material testing a new laboratory setup was developed for studying the dynamics of the humidity transport through different fabrics at realistic conditions in extension of the existing ISO test procedure. Present paper discusses the experimental procedures and first results acquired with new setup.
1. Introduction
Composite fabrics containing microporous membranes are becoming quite common in modern garments and footwear not only for sports and outdoor use but also for protective clothing and other applications. Corresponding fabric assemblies often incorporate multiple layers with different functionality. Popularity of membrane-containing fabrics is based on their ability to improve the thermal and humidity comfort of the garment assemblies. Designing with materials containing microporous membranes is commonly done basing on the results of the ISO [1,2] or corresponding ASTM tests of the fabrics, and own experiences. These tests are static and are essentially assessing the limitations for moisture transport. Next ‘opportunity window’ for testing opens only when the clothing ensemble is designed and manufactured. Objective testing of garment assemblies after manufacturing is a serious undertaking and often demands an access to complex equipment [3,4,5,6,7,8]. Also, many objective evaluation methods, including the standard ones [1,2,3] are performed in static conditions, representing the environment in which the clothing elements and assemblies will operate only to certain extent. In many cases subjective evaluation of clothing elements and assemblies is undertaken, separately or in combination with different elements of objective evaluation [8,9,10,11,12]. But subjective evaluation is significantly biased by the individual differences between test subjects, and inability to control ambient conditions at which the tests are performed. Thus significant efforts are undertaken to decrease the biasing coming from the subjective assessment performing tests in the controlled environment of climate chambers or wind tunnels [6,12], and through combining experimental studies with different predictive techniques. Sports Tech Research Centre is undertaking studies of sports and outdoor garment performance when exercising in a controlled environment of a ‘wind tunnel’ type climate chamber using a set of small temperature and humidity sensor nodes [11,12]. It was shown that nodes with two sensors having two opposing humidity sensing windows can not only measure the relative humidity levels, but also indicate the efficiency and direction of the moisture transport in key points under the garments [12]. Thus it was hypothesized that same sensors can be used to study the dynamics of moisture transport through different multilayer fabric composites membranes in the laboratory environment. Corresponding experimental setup was designed and constructed, and initial tests indicate that such systems can be used as dynamic extension for the static ISO test procedures.
2. Materials and Methods
Following reasons for making additional measurements beyond the ones performed under the ISO tests were formulated and used as rationale for designing new test setup. Firstly, ISO tests [1,2,3] are static, and essentially are testing water vapor transport across the fabrics at certain equilibrium. Also, ISO 15496 is carried out at a single temperature (23 °C, which is below the normal body temperatures) with no significant difference of the temperature across the tested membrane-containing fabric. At the same time it is known that main water vapor diffusion rate depends on the properties of the material, its thickness and partial water vapor pressure difference across the material layer. And partial water vapor pressure is strongly dependent on both temperature and relative humidity of the air. With ISO 11092 fabric is tested with the fixed temperature gradient and same humidity (thermal resistance measurement, 20 °C and 65 °C, and RH at 65%), and fixed humidity gradient and same temperature across it (water vapor resistance measurement, 35 °C, and RH at 100% and 40% correspondingly). Moreover, the fabrics containing membranes are commonly tested ‘stand-alone’, without additional layers of underwear or warm clothing. Thus such tests do not provide full picture how the membrane containing fabric would perform in garments at different temperature and humidity ambient environemnt.
New setup (Figure 1) is designed to allow better assessment of the moisture transport performance of the fabrics and fabric assemblies in changing ambient conditions (temperature, T, and relative humidity, RH). Sensors SHT21 by Sensirion AG, Switzerland are used in all sensor nodes. The sensors have a precision of ±3% in RH in the full range (0 to 100%) and ±0.3 °C in T in the range of interest (0 to 60 °C). Digital interfaces of the sensors are connected via home-made multiplexer to the digital serial interface module NI USB-485 (by National Instruments). Data acquisition and setup control is performed using LabVIEW hardware/software platform by National Instruments (see [10] for more details). Present setup is made as an add-on for the equipment used in ISO 15496 tests. During the tests fabric assembly is placed over the water bath without touching the water surface. A closed cup (volume 625 cm3) with temperature and humidity sensors is placed over the fabric (Figure 1b). Additional sensors monitor temperature and humidity just under the fabric (over the water-‘body side’), directly above the fabric (‘ambient side’) and, if needed, between the fabric layers. Thus, fabric surface facing the water corresponds to the inner (‘body’) side, and the one facing the temperature control box corresponds to the outer (‘ambient’) side. Temperature stabilization box together with the measurement and control software can stabilize the temperature in the cup between 8 and 35 °C. Before the measurements are performed, bottom of the fabric is closed by heat insulating foam cover, and control system is switched on for reaching desired ‘ambient’ temperature in the box (temperature preset stage). When the conditions are stabilized, bottom cover is removed and the system is placed over the water bath with water at 23 °C. Simultaneously, data acquisition is started, and temperature and humidity values for all sensors are measured each second.
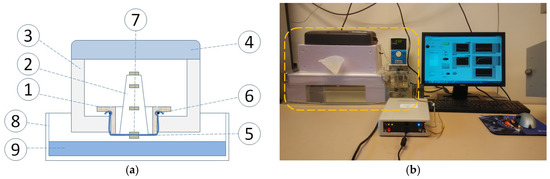
Figure 1.
Schematic representation of main functional elements of the temperature stabilizing box with its content in a water bath (a), and view of the full setup for studying the dynamics of moisture transport through the fabrics (b). Outlined-temperature stabilizing box in a water bath with temperature controller.
So during the measurement cycle ‘body’ side of the fabric is subjected to the air at 23 °C with relative humidity about 95–96%. And air in the cup, on the other (‘ambient’) side of fabric, is increasing its humidity until the saturation is reached, and the temperature and humidity values detected by the sensors are stabilized. Present setup is designed for testing individual fabrics and composite multilayered structures incorporating microporous membranes.
Schematic drawing explaining the basics of the setup is given in Figure 1. New fabric sample holder (1) is made by 3D printing in ABS polymer using exact dimensions of the ISO 15496 test one, and also same plastic cup (2) is used. Temperature stabilization box (3) is made of industrial thermal insulation foam, and a top of commercial heater/cooler box (4) is used for temperature stabilization in the box. Tested fabric (5) is mounted to the sample holder using rubber o-ring (6) same way as it is done in the ISO 15496 test setup. Plastic cup with the sensors (7) mounted along its symmetry line below and above the fabric, inside the cup and above it (main measurements), and inside the temperature control box (temperature control function) is placed over the fabric. Soft rubber seal is placed around its bottom rim providing tight fit into sample holder. Temperature control box with tested fabric exposed at its bottom is placed 1 cm above the water bath (8) with the water (9) at 23 °C. The same bath and temperature controller as in the ISO 15496 test setup is used. A small (ca 10 mL) amount of water absorbing potassium acetate gel (same as in ISO test) is placed into the cup in a cloth bag to decrease air humidity during initial temperature stabilization stage.
Tests with different fabric assemblies were performed for the assessment of new test setup functionality and performance. A fabric containing integrated microporous membrane used by one of the Swedish manufacturers as outer layer in the rain jackets and overalls was tested separately, and together with three different fabrics representing typical clothes worn as underwear. These “underwear” fabrics were taken from long-sleeve shirt (60% cotton, 40% polyester), T-shirt (80% cotton, 20% polyester) and thermal pants (70% wool, 30% polyamide). Air permeability tests of “underwear” fabrics were performed using the instrument AKUSTRON by Rycobel group. Corresponding values were 1400 for thermal pants (‘longjohns’, L), 1150 for the T-shirt (T), and 352 for the long sleeve shirt (S) fabrics correspondingly. The membrane containing fabric (F) is airtight. Tests were carried out for each of the fabrics separately, and for combinations of outer fabric and single underwear material (F + L, F + T, F + S). For the tests with single fabrics temperature and humidity sensor nodes were put on both sides of it. For the two-fabric combinations additional sensor node was placed between the fabrics. Two more sensor nodes are placed inside the cup at 50% and 70% of its height. Additional temperature sensor placed outside the cup on its top is used in temperature control loop. During the temperature stabilization stage air in the cup (‘ambient’ side) reaches preset temperature. When preset temperature is lower than starting one, air relative humidity starts to increase (opposite happens if the preset temperature increases). This happens because relative humidity value (RH) reflects the ratio of the amount of moisture present in the air to the amount the air can take at given temperature before water droplets start to form (dew point) [1,2]. Air at low temperatures keeps less moisture. Small amount of water absorbing gel placed into the cup compensates humidity increase with cooling and allows reaching low humidity values at the start of the measurement stage. When the tested fabric is placed over the water bath it causes the water vapor diffusion into the cup. Air humidity in the cup starts to increase, and after some time it reaches steady state value. So air humidity and temperature on both sides of the fabric will be dynamically changing, forming a data set that allows for calculating the partial water vapor pressure difference across the fabric, and corresponding water vapor diffusion efficiency and water vapor permeability of the fabric for preset ‘ambient’ and ‘body’ temperatures.
3. Results and Discussion
Tests with different fabric assemblies were performed for the assessment of new test setup. Fabric containing microporous membrane was tested ‘stand-alone’ and together with a single underwear layer. The underwear fabric was also tested in ‘stand-alone’ mode. Figure 2 presents the humidity dynamics in the cup (‘ambient side’) just above the fabric (Figure 2a) and in the middle of the cup volume (Figure 2b) after the fabric is placed facing the air at 23 °C and RH = 96%.
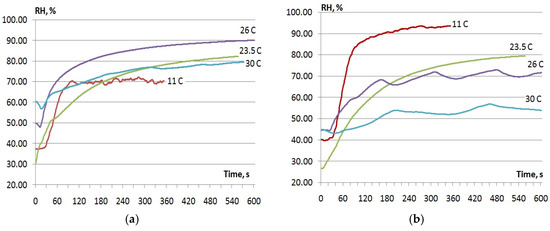
Figure 2.
Dynamics of the humidity at the ‘ambient side’ of the membrane-containing fabric just above the fabric (a), and in the air above it (b). Wave-type changes in relative humidity happening after 2 min in 26 and 30 °C case are due to rather small changes in the air temperature caused by the inefficiency of temperature regulation system.
These tests illustrate how the efficiency of humidity transfer through the membrane-containing ‘stand-alone’ fabric changes when the body side temperature’ is constant, (23 °C) and the ambient air temperature varies from 11 to 30 °C. In this case humidity transport is governed only by diffusion without additional wind effect. Because air volume in the cup (‘ambient side’) is relatively small, humidity inside the cup shows clear saturation. Thus, initial part of the curve reflects limiting ability for the moisture transport at starting humidity difference and varied temperature difference. Stable humidity value at saturation determines the condition when partial water vapor pressure at both sides of the fabric becomes equal. As expected, both limiting moisture transfer efficiency (inclination of the RH dependence during first minute), and steady state humidity in the cup are decreasing with increasing ambient temperature. Tests were also performed with both inner and outer fabric side testing the water showing very similar dependencies for the moisture transport dynamics.
Figure 3a presents the comparison of humidity dynamics on ‘ambient side’ of the fabric assembly (in the cup) for the membrane-containing fabric alone (F), together with wool-based underwear (F + L), and for the underwear fabric separately (L). Figure 3b presents similar comparison for the fabric alone (F), and together with three different underwear options (shirt fabric, F + S; T-shirt one, F + T, and wool-based underwear fabric, F + L). Similar tests to the one shown in Figure 2a were done for all three chosen ‘underwear’ fabrics. In all tests with membrane-based fabric together with another layer, ‘underwear fabric’ was facing the water side (‘body side’).
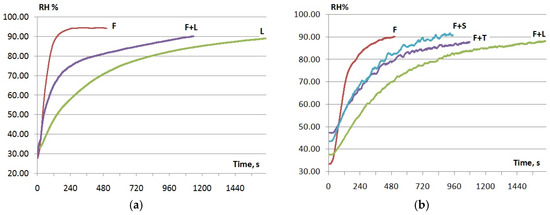
Figure 3.
Dynamics of the humidity at the ‘ambient side’ of the different fabric combinations for fixed initial conditions (23 °C and 96% on the ‘body side’ and low humidity air at 11 °C at the ‘ambient side’ for: (a)-singe membrane-containing fabric, single underwear fabrics and for their combination; (b)-singe membrane-containing fabric and its combination with three different ‘underwear’ ones.
As expected, underwear layer placed between the body and membrane-containing fabric changes the efficiency of the moisture transport. But it is rather unexpected that moisture transport in the assembly fabric + underwear is more effective than in the underwear fabric itself (Figure 3a), which was the case for all three tested underwear fabrics. Also, though the wool-based underwear (longjohns, L) has higher air permeability as compared to two other underwear fabrics, moisture transport through its assembly with membrane-containing fabric F, which is airtight, is rather ineffective. Probable explanations of these effects are laying in the differences of temperature and humidity distribution across the different fabric assemblies. It is known that moisture transport efficiency across the diffusion layer is dependent on the partial water pressure difference on two sides [3,4]. In turn, partial water pressure is strongly dependent on both humidity and temperature of the air. Also, relative humidity itself depends not only on the amount of moisture in the air, but on its temperature and, to certain extent, pressure. From the acquired data it is clear, that in the situation without the wind, on ‘ambient’ side of the fabric or fabric composite higher humidity warmer air layer is formed (clear difference in the temperature and humidity levels recorded by the sensors just above the fabric and 65 and 100 mm above it in the cup). Also in case of fabric composites temperature difference across the membrane containing fabric is rather small, because underwear is in particular used to provide good heat insulation. And measurements are showing that when the outer membrane-containing fabric is tested alone, air temperature and humidity difference across it is significantly larger as compared to the cases with fabric assemblies (outer fabric + underwear).
There are certain limitations of presently developed setup allowing for further improvements. It is essential, that temperature and humidity is monitored not only in the cup, over the water, and on both sides of the fabric composite, but between the major fabric layers as well. It will help to identify which layer of the fabric composite is defining the heat loss and moisture transport. Also, there is an uncertainty in the starting humidity of the air inside the cup (‘ambient’ side-see Figure 2 and Figure 3). And it is not yet clear how does it impact the precision of measurements. It is also feasible that entirely diffusion-controlled measurements available with present version of the system should be complemented with the ones, allowing for the active air exchange (“wind”) at the ‘ambient’ fabric side. Further development of the system is also targeting better data processing allowing automatic extracting of the parameters such as water vapor resistance and water vapor permeability.
4. Some Conclusions
Compact nodes with two temperature/humidity sensors can be effectively used for studying humidity and temperature under the garments in exercising. Same sensor nodes are effectively used for assessing the efficiency and direction of moisture transport across individual fabrics and fabric assemblies. New laboratory setup using such sensors designed as a dynamic extension for existing static ISO tests allows selection of optimal combinations of outer garment and underwear fabrics designed to provide optimum comfort at different ambient conditions. Though existing system has limitations, when developed further it can become a valuable tool for studies of fabric assemblies.
Acknowledgments
Research is conducted with financial support from the EU Regional Development Fund and Swedish Agency for Economic and Regional Growth, Tillväxtverket, Grant No. 20201018.
Conflicts of Interest
The authors declare no conflict of interest. The funding sponsors had no role in the design of the study; in the collection, analyses, or interpretation of data; in the writing of the manuscript, and in the decision to publish the results.
References
- International Organization for Standartization. Textiles-Measurement of Water Vapour Permeability of Textiles for the Purpose of Quality Control; Standard ISO 15496:2004/Cor.1:2006; International Organization for Standartization: Geneva, Switzerland, 2006. [Google Scholar]
- International Organization for Standartization. Textiles-Physiological Effects-Measurement of Thermal and Water-Vapour Resistance under Steady-State Conditions (Sweating Guarded-Hotplate Test); Standard ISO 11092:2014; International Organization for Standartization: Geneva, Switzerland, 2014. [Google Scholar]
- International Organization for Standartization. Clothing-Physiological Effects-Measurement of Thermal Insulation by Means of a Thermal Manikin; Standard ISO ISO 15831:2004; International Organization for Standartization: Geneva, Switzerland, 2004. [Google Scholar]
- Watson, C.; Nawaz, N.; Troynikov, O. Design and evaluation of sport garments for cold conditions using human thermoregulation modeling paradigm. Procedia Eng. 2013, 60, 151–156. [Google Scholar] [CrossRef][Green Version]
- Fukazawa, T.; Lee, G.; Matsuoka, T.; Kano, K.; Tochihara, Y. Heat and water vapour transfer of protective clothing systems in a cold environment, measured with a newly developed sweating thermal manikin. Eur. J. Appl. Physiol. 2004, 92, 645–648. [Google Scholar] [CrossRef] [PubMed]
- Bogerd, C.; Brühwiler, P.; Rossi, R. Heat loss and moisture retention variations of boot membranes and sock fabrics: A foot manikin study. Int. J. Ind. Ergon. 2012, 42, 212–218. [Google Scholar] [CrossRef]
- Arezes, P.; Neves, M.; Teixeira, S.; Leão, C.; Cunha, J. Testing thermal comfort of trekking boots: An objective and subjective evaluation. Appl. Ergon. 2013, 44, 557–65. [Google Scholar] [CrossRef] [PubMed]
- Rugh, J.; Farrington, R.; Bharathan, D.; Vlahinos, A.; Burke, R.; Huizenga, C.; Zhang, H. Predicting human thermal comfort in a transient nonuniform thermal environment. Eur. J. Appl. Physiol. 2004, 92, 721–727. [Google Scholar] [CrossRef] [PubMed]
- Bäckström, M.; Carlsson, P.; Danvind, J.; Koptyug, A.; Sundström, D.; Tinnsten, M. A new wind tunnel facility dedicated to sports technology research and development. Procedia Eng. 2016, 147, 62–67. [Google Scholar] [CrossRef]
- Koptyug, A.; Ainegren, M.; Bäckström, M.; Schieber, E.; Persson, J. Possibility of modern humidity sensor application in the studies of moisture transport through the sports and outdoor garments. In Proceedings of the 4th International Congress on Sport Sciences Research and Technology Support, icSPORTS, Porto, Portugal, 7–9 November 2016; Cabri, J., Correia, P.P., Eds.; SCITEPRESS: Setúbal, Portugal, 2016. ISBN 978-989-758-205-9. [Google Scholar]
- Metz, S. Water Vapour and Gas Transport through Polymeric Membranes. Ph.D. Thesis, University of Twente, Enschede, The Netherlands, 2003. [Google Scholar]
- Buck, A. New equations for computing vapor pressure and enhancement factor. J. Appl. Meteorol. 1981, 20, 1527–1532. [Google Scholar] [CrossRef]
Publisher’s Note: MDPI stays neutral with regard to jurisdictional claims in published maps and institutional affiliations. |
© 2022 by the authors. Licensee MDPI, Basel, Switzerland. This article is an open access article distributed under the terms and conditions of the Creative Commons Attribution (CC BY) license (https://creativecommons.org/licenses/by/4.0/).