Proceeding Paper

Applying SPOT Images to Study the Colorado River Effects on the Upper Gulf of California †

by
Jesús A. Aguilar-Maldonado
1,2,*,
Eduardo Santamaría-del-Ángel
1,* and
María-Teresa Sebastiá-Frasquet
3,*
1
Facultad de Ciencias Marinas, Universidad Autónoma de Baja California, Ensenada 22860, Mexico
2
Alumni PhD posgraduated program in Coastal Oceanography FCM-UABC, Ensenada 22860, Mexico
3
Institut d´Investigació per a la Gestió Integrada de Zones Costaneres, Universitat Politècnica de València, 46730 Gandía, Spain
*
Authors to whom correspondence should be addressed.
Presented at the 2nd International Electronic Conference on Water Sciences, 16–30 November 2017; Available online: http://sciforum.net/conference/ecws-2.
Proceedings 2018, 2(5), 182; https://doi.org/10.3390/ecws-2-04951
Published: 16 November 2017
(This article belongs to the Proceedings of The 2nd International Electronic Conference on Water Sciences)

Abstract

:
Sediment discharges from rivers play a key role in downstream ecosystems, both for ecosystem morphology (e.g., deltas) and productivity. However, the construction of dams and river regulation dramatically alter sediment transport. Currently, the Colorado River delta is one of the most transformed deltas in the world and, most years, no flow reaches the Gulf of California. In this study, we used satellite images for the observation and measurement of coastal water turbidity in the Upper Gulf of California (UGC) and Colorado River Delta (CRD). Specifically, we used the Earth-observing Satellites (in French Satellites Pour l’Observation de la Terre, SPOT) high spatial resolution satellite. We processed images of the wavelength 2 ( S 2 610 680 ) from the period between 2008 and 2013 in the Biosphere Reserve area. Results showed that suspended material and high turbidity predominate in the CRD and intertidal zones of the UGC. High and very high turbidity values were due to two opposite coastal transport components along the Sonora and Baja California coasts. The high spatial resolution of the SPOT sensor effectively allowed the sediment transport gradients and the accumulation zones to be located in a highly variable area. This information provided by SPOT images can be very valuable for management decisions such as the amount of ecological flow that needs to be released. This area is the habitat of endangered species, such as totoaba (Totoaba macdonaldi) and vaquita (Phocoena sinus), that are seriously affected by the loss of estuarine conditions. High resolution satellite images can help to quantify the true extent of corrective measures.

1. Introduction

Regulation of large rivers through dams and diversion projects has caused dramatic changes to many delta ecosystems and receiving waters [1]. The Colorado River (North America) is one of the most transformed rivers in the world. Intensive economic use of the Colorado River water was developed during the twentieth century [1,2]. Before any dam construction, during the period between 1905 and 1936, the average daily discharge into the Gulf of California was 600 m3/s [1]. Completion of large dams, such as the Hoover Dam in 1935 and Glenn Canyon in 1952, greatly reduced discharge [1,2]. Since 2000, more than 60% of the time, no flow is registered at the Southerly International Boundary (SIB) [1]. The Colorado River discharges into the Gulf of California only during extraordinary precipitation events (e.g., El Niño) and particularly high tides [2,3].
The Upper Gulf of California (UGC) is a highly productive marine area [4,5] that maintains its productivity despite the lack of river discharge. This marine area hosts important fisheries, for example, shrimp and gulf corvine fisheries [6,7]. Despite some disagreement on how the river discharge contributes to this high productivity [7,8], there are several studies that link Colorado River flow and UGC productivity [7,9].
Moreover, this area has several environmental protection figures, such as the Biosphere Reserve of the Upper Gulf of California and Colorado River Delta. It is the habitat of some endangered endemic species, such as the totoaba (Totoaba macdonaldi) and the vaquita marina (Phocoena sinus), which are estuarine-dependent [10]. The decrease in river discharges has converted the Colorado River Delta into a negative estuary with hypersaline water, thus altering the habitat of these species [10,11].
During spring 2014, a programmed pulse-flow was released under the implementation of Minute 319, which connected the river to the sea [6,12]. Minute 319 is a binational agreement (USA and Mexico), which seeks to study the ecological benefits of river flow [7]. Freshwater flows can bring nutrients, sediments and detritus which sustain fisheries [7], but another key factor in the UGC is sediment resuspension by strong tidal currents [2].
The authors of [3] used satellite images, Landsat 5-TM and Landsat 7, to reconstruct river–sea connectivity and geomorphic processes, and to analyzes the implications for habitat restoration. In our study, we used the high spatial resolution (10–20 m) of the Earth-observing Satellites (in French Satellites Pour l’Observation de la Terre, SPOT) to study the turbidity levels in the UGC. The objective was to locate sediment transport gradients and accumulation zones due to UGC dynamics. This can supply additional information to managers making decisions regarding water allocation.

2. Material and Methods
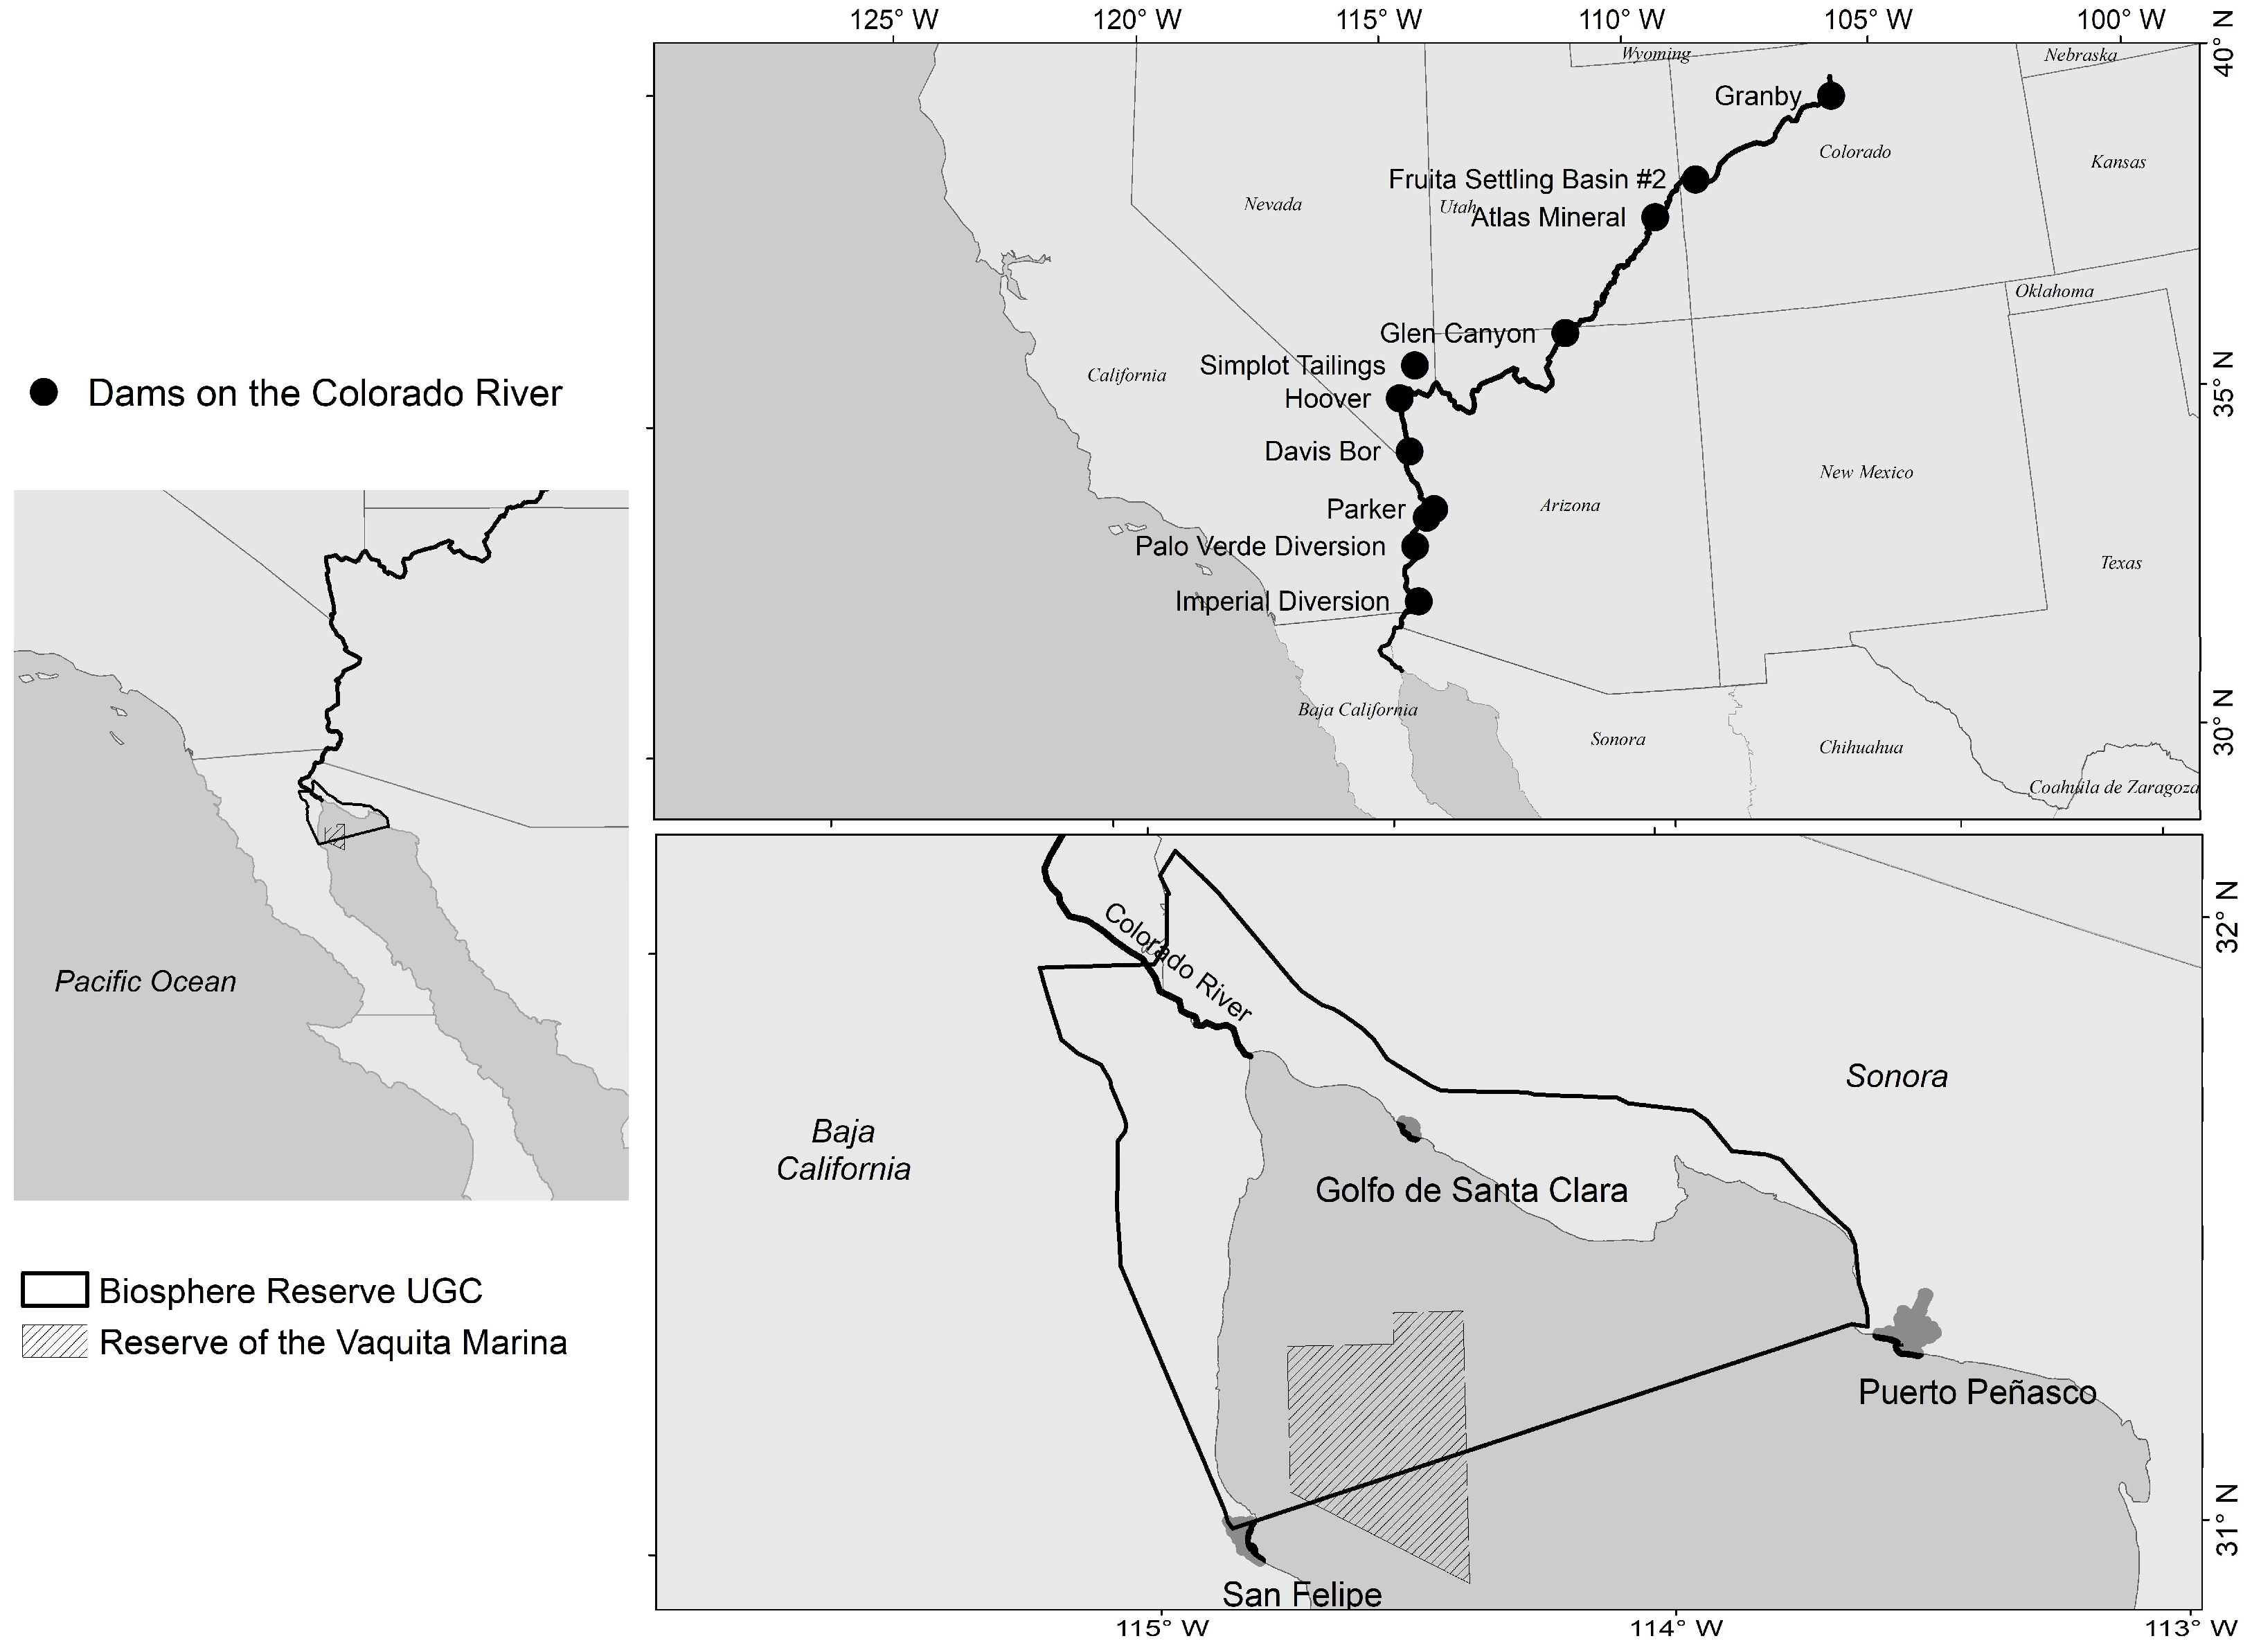
2.1. Study Area

The study area is represented in Figure 1. It is the Upper Gulf of California (UGC) and the estuary of the Colorado River. It hosts the Biosphere Reserve of the Upper Gulf of California and Colorado River Delta (CRD), and also the Vaquita Marina Refuge. In total, 80% of the refuge is part of the Biosphere Reserve. In this study, this area was covered with SPOT images from the year 2008 to 2013. The main transformations regarding water regulation in the Colorado River, dams and diversions, are indicated in Figure 1 (e.g., Glen Canyon dam, Hoover dam, NV, USA).

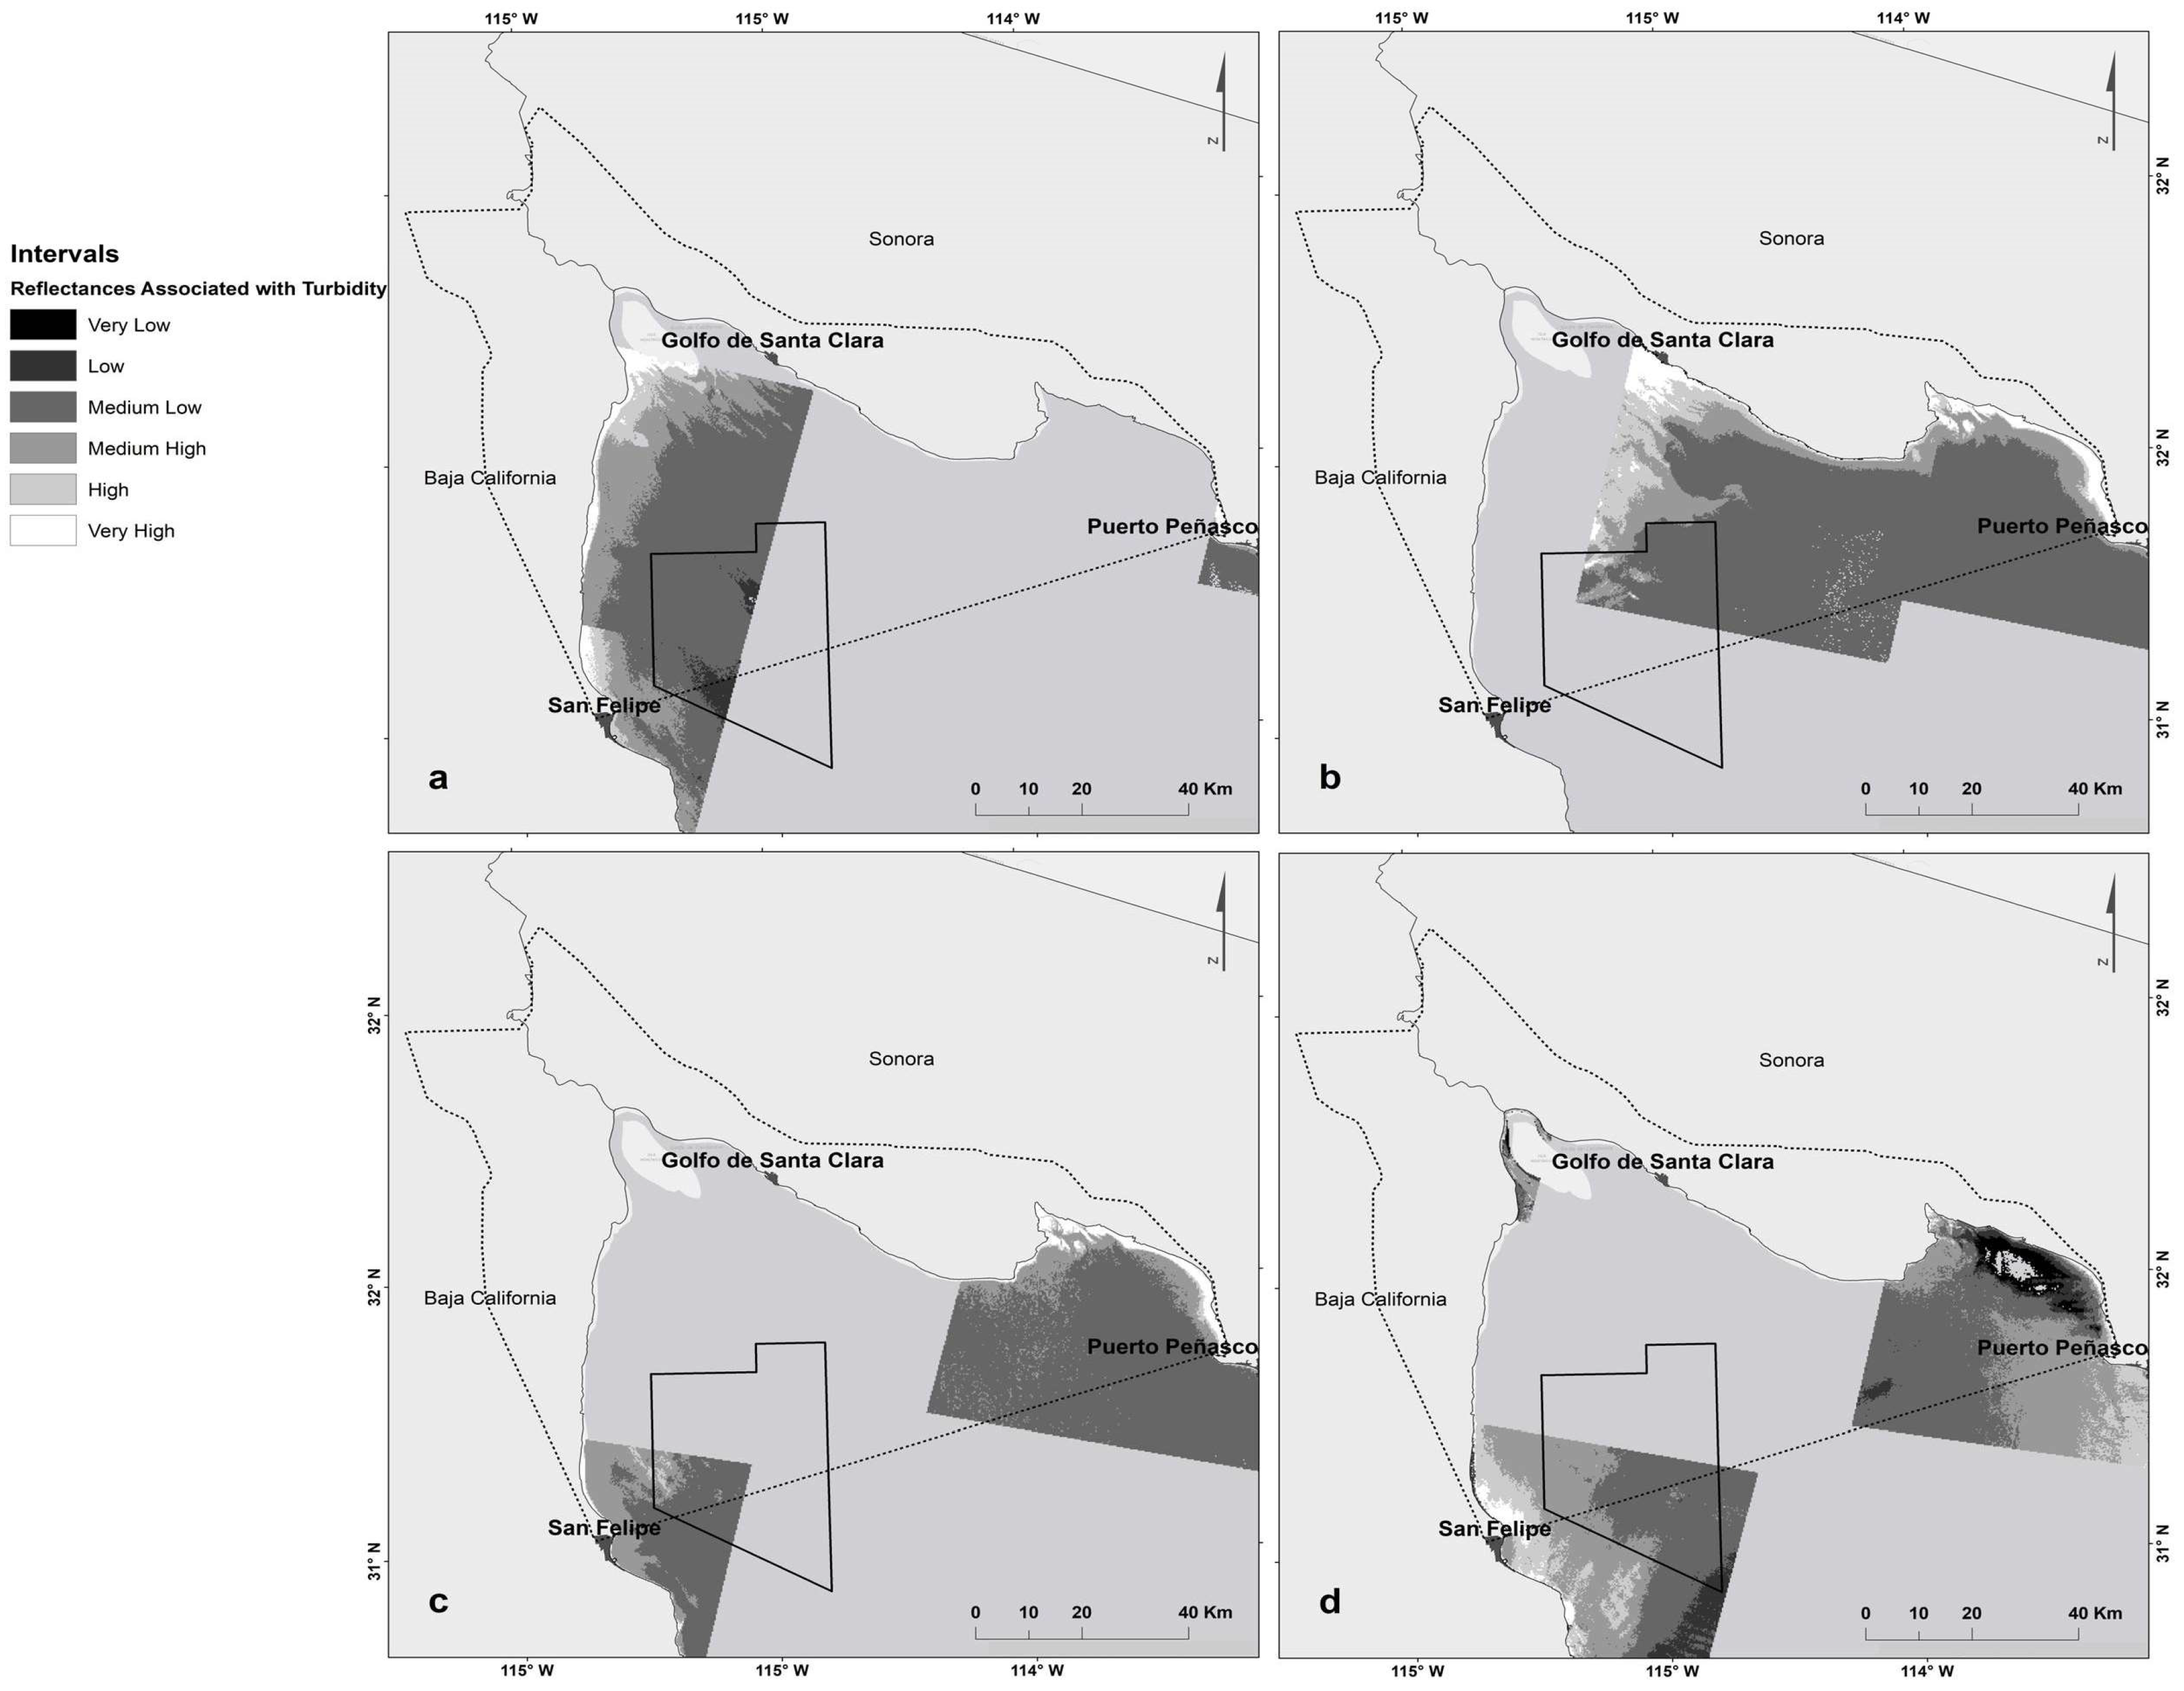
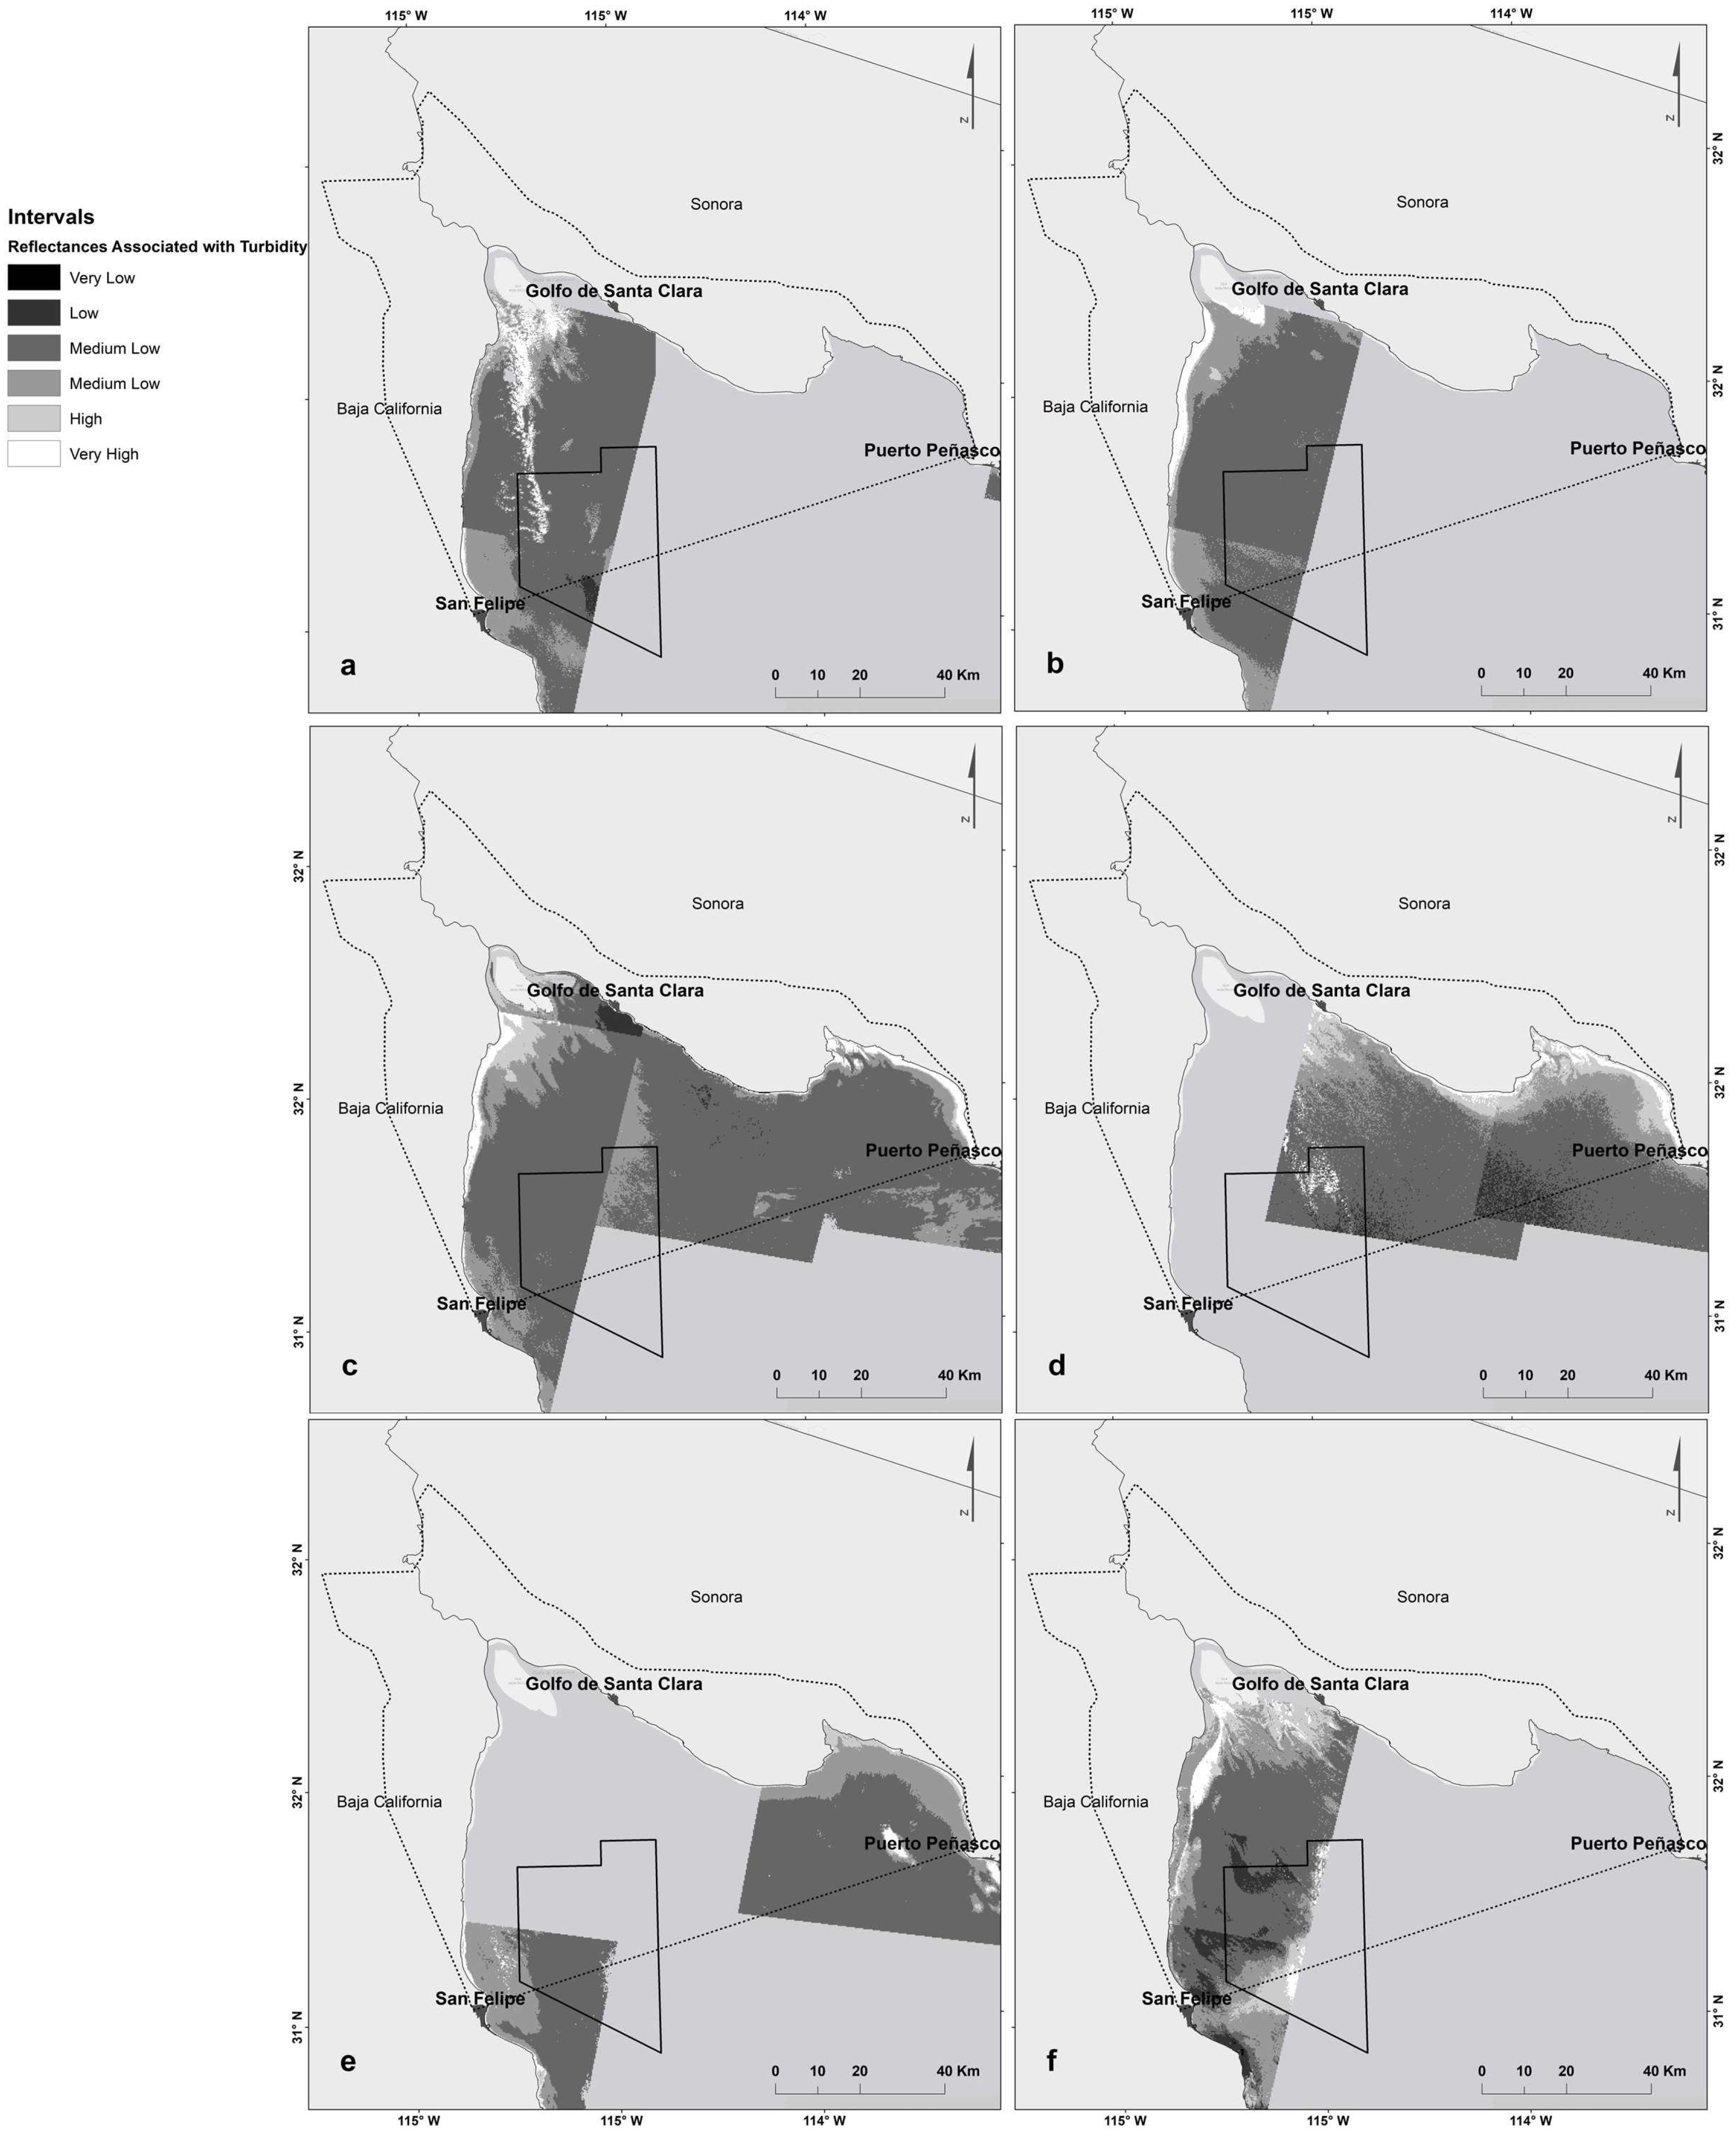
2.2. Image Processing

In this study, we used the SPOT sensor reflectance band 2, R rs ( S 2 610 680 ), to estimate water turbidity. The SPOT images were corrected radiometrically, atmospherically and geometrically as described in [13]. A total of 73 SPOT images of the period between 2008 and 2013 were processed. These images were classified according to oceanic conditions at the moment of the scene, in order to be able to study the turbidity in different conditions. Oceanic conditions were determined from the historical records of three tide stations of the UGC (Golfo de Santa Clara, Sonora, Mexico, Puerto Peñasco, Sonora, Mexico and San Felipe, Baja California, Mexico) (Figure 1). The images were grouped as follows [13]:
(1)
Neap tide (during the first and third quarter moon, when the moon appears “half full”, the sun and moon are at right angles to each other; the bulge of the ocean caused by the sun partially cancels out the bulge of the ocean caused by the moon) in flow (slow and continuous rise of the waters) or ebb flow (slow and continuous descent of the waters)
(2)
Spring tide (new and full moon; the moon and sun are aligned and their effects are added) in flow or ebb flow
(3)
Season, warm or cold season.

3. Results and Discussion

The following figures show maps of the turbidity in the area of the UGC and CRD for the years 2010, 2011 and 2012 (Figure 2, Figure 3 and Figure 4 respectively) both for cold and warm seasons, and different tide conditions. No SPOT images were available for spring tide in ebb flow, so specific conditions were not assessed. Reflectances obtained from SPOT images ranged from very high (white color) to very low (black color).
Higher reflectance values, and thus higher turbidity, were observed near the coast in the intertidal zone for all the conditions analyzed. More analysis is being conducted to study other variables such as precipitation, river flow and wind to better interpret the different scenarios. In 2011, a higher influence of the Colorado River was observed during the cold season, in spring tide and flow conditions (Figure 3a). Under other scenarios, the high reflectances area was parallel to the Baja California coast (Figure 3b,c), but under these conditions the high turbidity plume gets into the Vaquita marina refuge. Unfortunately, the refuge polygon was not covered by SPOT images in all the scenarios analyzed. However, the variability represented during the period from 2010 to 2012 is high and cannot be explained by tidal conditions alone.

Acknowledgments

The Consejo Nacional de Ciencia y Tecnología (CONACYT, Mexico) provided funding through a PhD scholarship to Jesús-Antonio Aguilar-Maldonado (grant 251025). The Generalitat Valenciana (Spain) provided funding through a scholarship for research staff to María-Teresa Sebastiá-Frasquet (BEST/2017/217).

Author Contributions

Jesús A. Aguilar-Maldonado carried out the tests and analyses developed in the article, and drafted the text of the article. Eduardo Santamaria-del-Ángel provided the data and resources of his research group. Maria-Teresa Sebastiá-Frasquet organized the text, compiled and wrote data, and formulated new ideas for this article; she was also fundamental in the writing and correction of the English.

Conflicts of Interest

The authors declare no conflict of interest. The founding sponsors had no role in the design of the study; in the collection, analyses, or interpretation of data; in the writing of the manuscript, and in the decision to publish the results.

References

  1. Mueller, E.R.; Schmidt, J.C.; Topping, D.J.; Shafroth, P.B.; Rodríguez-Burgueño, J.E.; Ramírez-Hernández, J.; Grams, P.E. Geomorphic change and sediment transport during a small artificial flood in a transformed post-dam delta: The Colorado River delta, United States and Mexico. Ecol. Eng. 2017, 106, 757–775. [Google Scholar] [CrossRef]
  2. Shumilin, E.N.; Carriquiry, J.D.; Camacho-Ibar, V.F.; Sapozhnikov, D.; Kalmykov, S.; Sánchez, A.; Aguíñiga-García, S.; Sapozhnikov, Y.A. Spatial and vertical distributions of elements in sediments of the Colorado River delta and Upper Gulf of California. Mar. Chem. 2002, 79, 113–131. [Google Scholar] [CrossRef]
  3. Zamora, H.A.; Nelson, S.M.; Flessa, K.W.; Nomura, R. Post-dam sediment dynamics and processes in the Colorado River estuary: Implications for habitat restoration. Ecol. Eng. 2013, 59, 134–143. [Google Scholar] [CrossRef]
  4. Orozco-Durán, A.; Daesslé, L.W.; Camacho-Ibar, V.F.; Ortiz-Campos, E.; Barth, J.A.C. Turnover and release of P-, N-, Si-nutrients in the Mexicali Valley (Mexico): Interactions between the lower Colorado River and adjacent ground- and surface water systems. Sci. Total Environ. 2015, 512–513, 185–193. [Google Scholar] [CrossRef] [PubMed]
  5. Millán Núñez, R.; Santamaría-del-Ángel, E.; Cajal-Medrano, R.; Barocio-León, O.A. El delta del Río Colorado: Un ecosistema con alta productividad primaria. Cienc. Mar. 1999, 25, 509–540. [Google Scholar] [CrossRef]
  6. Daesslé, L.W.; Orozco, A.; Struck, U.; Camacho-Ibar, V.F.; van Geldern, R.; Santamaría-del-Angel, E.; Barth, J.A.C. Sources and sinks of nutrients and organic carbon during the 2014 pulse flow of the Colorado River into Mexico. Ecol. Eng. 2017, 106, 799–808. [Google Scholar] [CrossRef]
  7. Duval, D.; Colby, B. The influence of Colorado River flows on the upper Gulf of California fisheries economy. Ecol. Eng. 2017, 106, 791–798. [Google Scholar] [CrossRef]
  8. Ramirez-Leon, M.R.; Álvarez-Borrego, S.; Turrent Thompson, C.; Gaxiola Castro, G.; Heckel Dziendzielewski, G. Nutrient input from the Colorado River to the northern Gulf of California is not required to maintain a productive pelagic ecosystem. Cienc. Mar. 2015, 41, 169–188. [Google Scholar] [CrossRef]
  9. Santamaría-del-Ángel, E.; Millán-Núñez, R.; González-Silvera, A.; Callejas-Jiménez, M.; Cajal-Medrano, R.; Galindo-Bect, M. The response of shrimp fisheries to climate variability of Baja California, México. ICES J. Mar. Sci. 2011, 68, 766–772. [Google Scholar] [CrossRef]
  10. Santamaría-del-Ángel, E.; Aguilar-Maldonado, J.A.; Galindo-Bect, M.S.; Sebastiá-Frasquet, M.T. Marine Spatial Planning: Protected Species and Social Conflict in the Upper Gulf of California. In Marine Spatial Planning: Methodologies, Environmental Issues and Current Trends, 1st ed.; Kitsiou, D., Karydis, M., Eds.; Nova Science Publishers: Hauppauge, NY, USA, 2017; ISBN 978-1-53612-183-4. [Google Scholar]
  11. Lavín, M.; Castro, R.; Beier, E.; Cabrera, C.; Godínez, V.; Amador-Buenrostro, A. Surface circulation in the Gulf of California in summer from Surface drifters and satellite images (2004–2006). J. Geophys. Res. Oceans 2014, 119, 4278–4290. [Google Scholar] [CrossRef]
  12. Nelson, S.M.; Ramírez-Hernández, J.; Rodríguez-Burgueño, J.E.; Milliken, J.; Kennedy, J.R.; Zamora-Arroyo, F.; Schlatter, K.; Santiago-Serrano, E.; Carrera-Villa, E. A history of the 2014 Minute 319 environmental pulse flow as documented by field measurements and satellite imagery. Ecol. Eng. 2017, 106, 733–748. [Google Scholar] [CrossRef]
  13. Aguilar-Maldonado, J.A.; Santamaría-del-Ángel, E.; Sebastiá-Frasquet, M.T. Reflectances of SPOT multispectral images associated with the turbidity of the Upper Gulf of California. Rev. Teledetec. 2017. (under review). [Google Scholar] [CrossRef]
Figure 1. Study area location, Upper Gulf of California and Colorado River Delta (Baja California, Mexico). Tide stations used in this study were located in Golfo de Santa Clara, San Felipe and Puerto Peñasco coastal towns. The Biosphere Reserve and the Vaquita marina refuge polygons are depicted.
Proceedings 02 00182 g001
Figure 2. Upper Gulf of California (UGC) maps of turbidity for the year 2010 in (a) cold season, spring tide in flow; (b) cold season, neap tide in ebb flow; (c) cold season, neap tide in flow and (d) warm season, spring tide in flow. The Biosphere Reserve area and the Vaquita marina refuge polygons are depicted.
Proceedings 02 00182 g002
Figure 3. UGC maps of turbidity for the year 2011 in (a) cold season, spring tide in flow; (b) cold season, neap tide in ebb flow; (c) cold season, neap tide in flow; (d) warm season, neap tide in flow; (e) warm season, neap tide in ebb flow and (f) warm season, spring tide in flow. The Biosphere Reserve area and the Vaquita marina refuge polygons are depicted.
Proceedings 02 00182 g003
Figure 4. UGC maps of turbidity for the year 2012 in (a) cold season, spring tide in flow; (b) cold season, neap tide in flow; (c) cold season, neap tide in ebb flow and (d) warm season, spring tide in flow. The Biosphere Reserve area and the Vaquita marina refuge polygons are depicted.
Proceedings 02 00182 g004
Publisher’s Note: MDPI stays neutral with regard to jurisdictional claims in published maps and institutional affiliations.

