1. Introduction
Exploring the use of conventional tools and materials in the laboratories for sensor studies is desirable for its benefits such as the ease, accessibility, and short-term productivity [
1]. Driven by this motivation, we have recently initiated the dry sample spot measurements by using dialysis membrane as the sample scaffold medium and UV spectrophotometer, as the instrument for optical detection [
2]. The sample of interest was the BSA protein, and the effect of sample spot size and selection of the wavelength to be inspected for correlation with the protein concentration were studied then. Accordingly, varying sample spot sizes were prepared by changing the volume of the sample to be dried on the surface, and 201 nm and 280 nm wavelengths were analyzed for the goodness of correlation with the changing concentrations of the protein sample solutions [
2]. As a result, higher volume of sample did not improve the outcome and 280 nm was related better to the protein concentration of the sample solution of interest. Overall, the results proved to be supportive but the standard deviation was too high. Therefore, it was concluded that the proof of the concept was attained but the technique required further development [
2]. For improving these earlier outcomes, here we applied the sample solutions directly on the surface of the quartz cuvette of the spectrophotometer and measurement results of the dried samples ended up having significantly lower standard deviations.
2. Materials and Methods
2.1. Sample Preparation
Spectrophotometric measurements were performed with the Agilent 8453 UV-visible Spectroscopy System. Different concentrations of BSA protein (Sigma-Aldrich) sample solutions, ranging between 0 µM to 50 µM final concentrations (0 µM, 0.5 µM, 5 µM, 50 µM), were obtained by dissolving the required amount of protein in distilled water, to end up in a 500 µM stock solution, and preparing the specified concentrations by making serial dilutions from the stock solution.
2.2. Measurements
Measurements were performed within the 190–1100 nm range, after pipetting 0.5 µL of sample solution at the center of the UV-beam interacting region on the cuvette. Measurements were initiated immediately after pipetting the sample on the cuvette and continued until no significant changes that could be attributed to the removal of water in the sample by evaporation was revealed in the spectra. Before continuing to the next measurement, a new blank spectrum was measured.
2.3. Analysis
The spectra that were collected at the end of each measurement were used for the analysis of absorbance at 280 nm. The analysis of the measured spectrum were performed by reading the specific absorbance, after performing a correction for the baseline shift, in order to minimize the absorption at 307–340 nm region. This correction was not performed in the previous work with the utilization of dialysis membrane [
2]. Finally, graphics were generated by the optical spectroscopy software, Spekwin32 (version 1.71.6.1), and the Microsoft Office Excel program, after exporting the spectrum of interest as a file with the csv extension, by using the UV-Visible ChemStation Software of the Agilent Technologies.
3. Results and Discussion
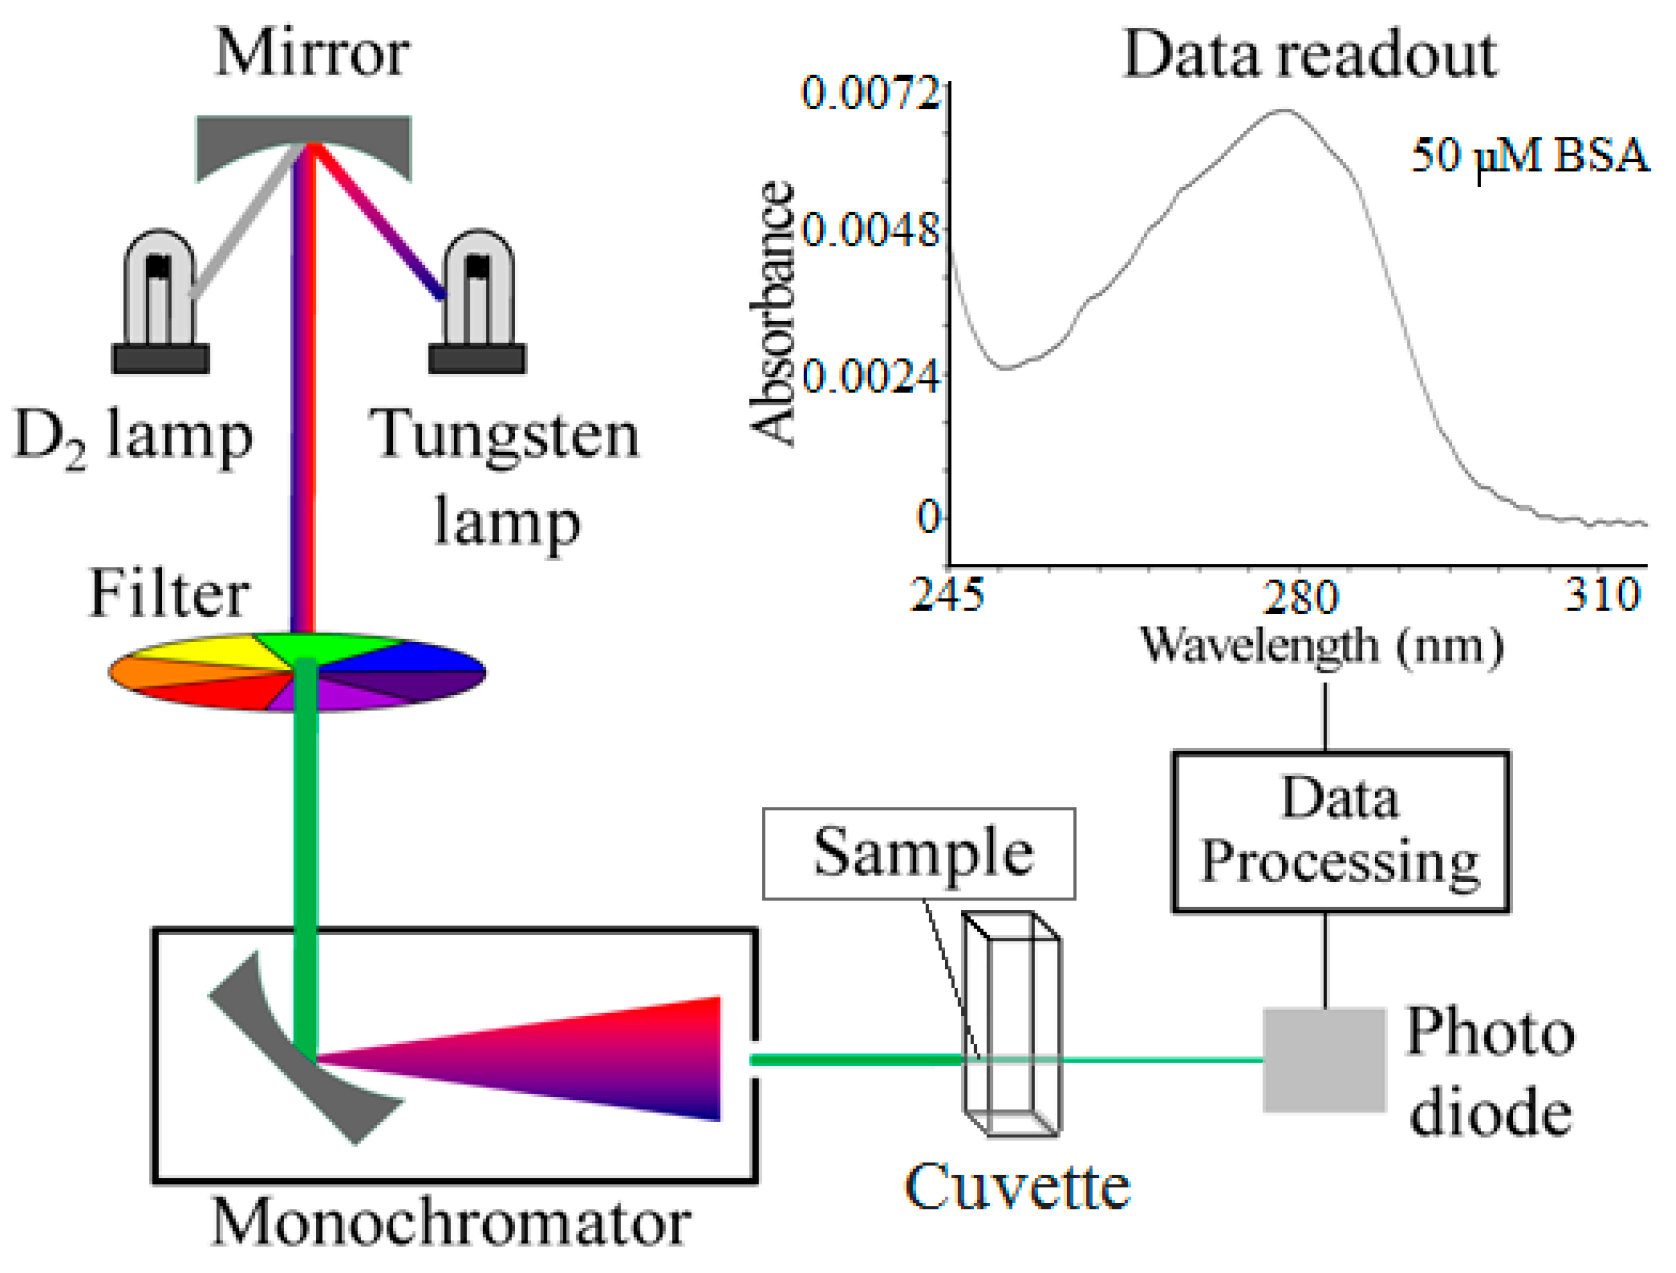
The measurement scheme depiction is shown in
Figure 1, along with a sample spectrum, as the inset. Sample spectrum belongs to the 245–310 nm range of a dried spot of 0.5 µL, 50 µM BSA in solution.
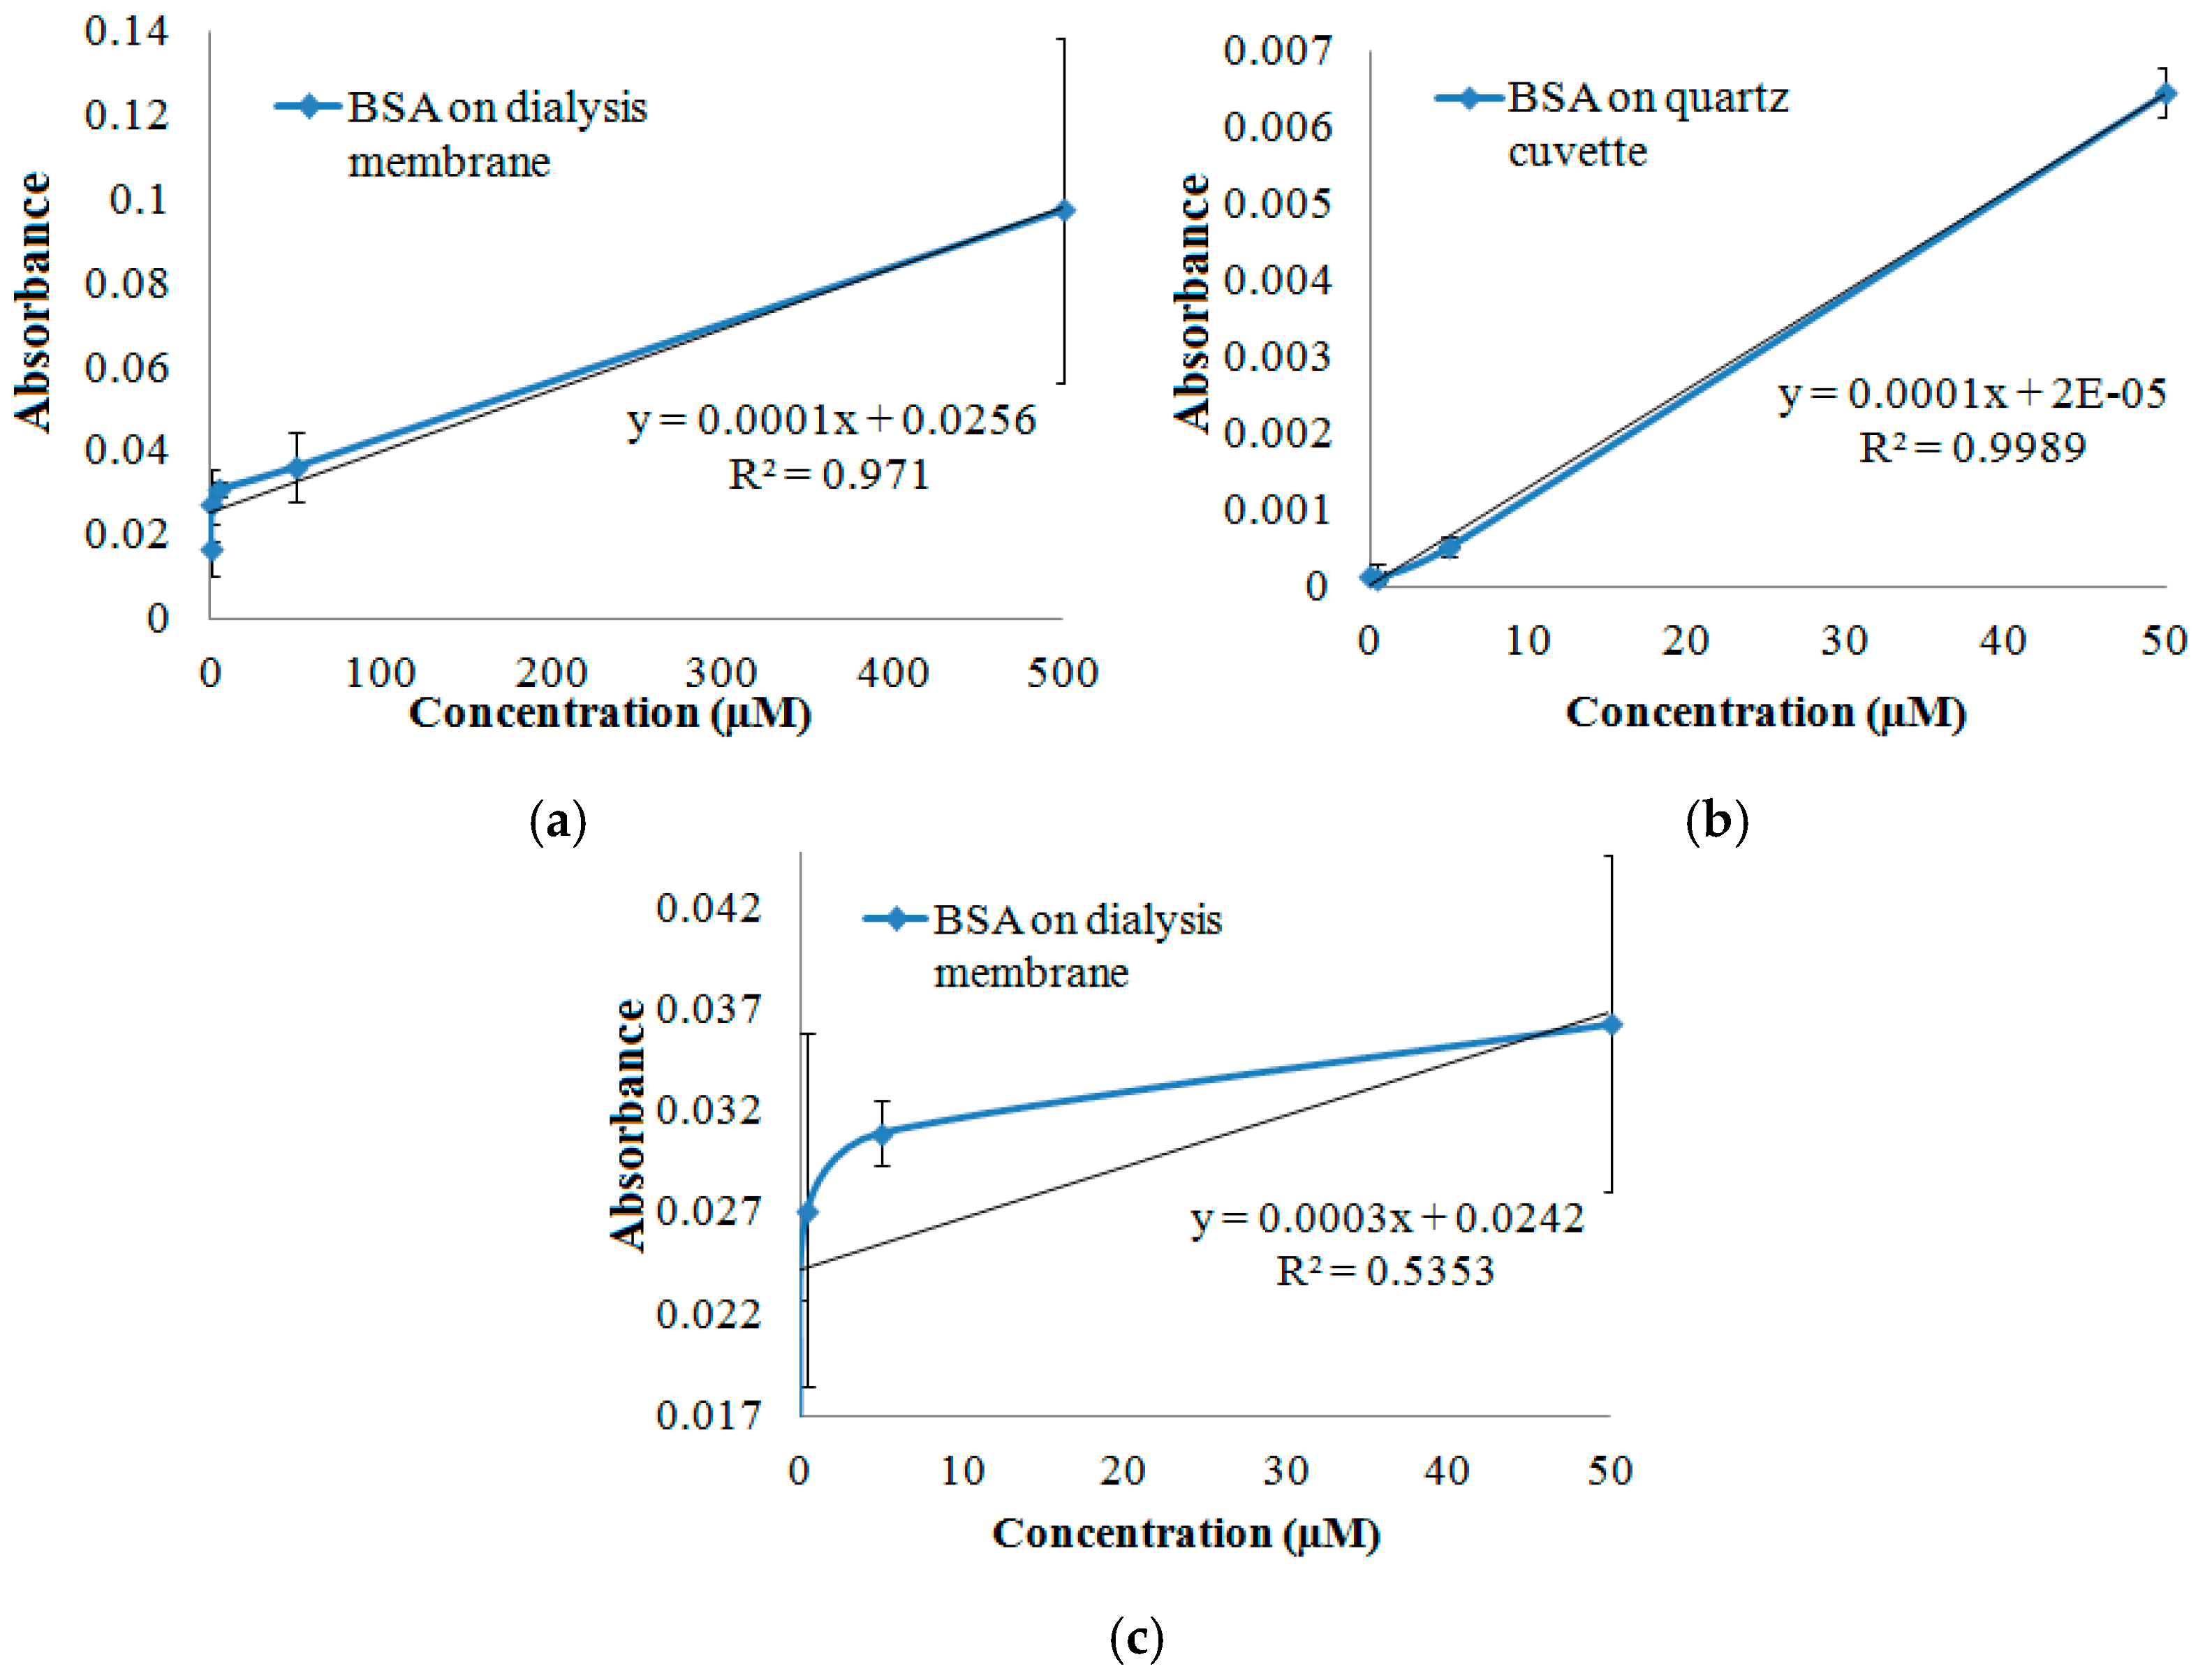
Figure 2 shows the 280 nm absorbance values of the spectra that were obtained by measuring dried spots of varying concentrations of samples on the dialysis membrane, in comparison to that of the quartz cuvette, as the improved approach. The detection limit with this improved approach was found to be ~5 µM, corresponding to 165 ng BSA protein, based on the consumption of 0.5 µL sample.
It is observed that standard deviations diminished significantly, when dialysis membrane was eliminated, sample dried directly on the quartz cuvette of the spectrophotometer, and analysis was performed with baseline correction of the data (
Figure 2). This positive effect on the outcome was much more remarkable at lower BSA concentrations since the linearity of the relation of the protein amount, which is given as concentration of the sample that was applied on the surface, with the absorbance at 280 nm was lost in case of the measurements with the dialysis membrane. It can be seen in
Figure 2c, by comparing it with
Figure 2a. This observation is probably due to the adverse effects like light scattering, which was sourced by the additional presence of the dialysis membrane on the pathway of the light beam. Further, dialysis membrane was changing in shape due to wetting by the sample solution, followed by drying. This was leading to deviation of the results at each sample application. Yet, dialysis membrane would still be a good material for such single-uses for its low cost and wide availability as a consumable material.
4. Conclusions and Outlook
Quartz surface of the UV spectrophotometer cuvette is used for the first time, to prepare dried sample spots of protein solution on it. The sample was detected by the UV spectrophotometer, throughout the drying process. Utilizing quartz cuvettes and a slightly varied analysis significantly improved the previous results that utilized dialysis membrane for sample preparation. Those former results were revealing high standard deviation and diminished concentration dependency, according to the analysis of the results that were obtained through the measurements of dry sample spots, prepared by 0–50 µM BSA solutions. The detection limit with this improved approach was found to be ~5 µM, corresponding to 165 ng BSA protein, based on the consumption of 0.5 µL sample.
Decrease in the standard deviation with the current measurement scheme was likely to be due to several factors. First of all, former measurements were performed on the dialysis membrane, which was not drying as a smooth surface after being wetted by the sample solution. This increased not only scattering but also brought inconsistency among different sets of experiments, due to distinct drying-patterns of different membrane filter patches. On the other hand, pipetting-sourced volume changes might have caused changes in the amounts of sample that were dried on the surface, especially considering the small sample volumes that were dealt with. Another source of variation was possible changes in the sizes and shapes of the dried sample spots since samples were dispensed manually by micropipetting. So, these were the sources of deviation that were due to the lack of standardization of the technique and the tools but it should also be kept in mind that these are also the features that make the technique readily available and applicable by any person and any facility who has the instrument.
In the future, drawbacks of using dialysis membrane will be tackled, along with exploring the possibility of using alternative materials, in order to have low-cost, wetting-resistant, and UV-transparent disposable medium as a sample scaffold, onto which one could apply permanent modifications. Also, colorimetric assays can be implemented, for improving signal qualities and quantities. Eventually, the proposed technique could be adapted as a mobile phone utility, by virtue of its optical measurement scheme. Last but not the least, applicability of the technique is aimed to be tested also for DNA detection, to see the possibility of obtaining results with trace amounts of DNA, without using any sample enrichment procedures such as the polymerase chain reaction.
