Abstract
Erosion is one of the major problems in Nigeria and Lagos State in particular. The objectives of this research are to identify land use/land cover changes in Eti-Osa LGA and estimate actual erosion risk using Revised Universal Soil Loss Equation (RUSLE) model. In addition, this research evaluates the perception of communities within the study area with the view of understanding the risk involved in erosion. The result showed that the sediment yield of the study was estimated to be between 0 to 48 ton/ha/yr. The estimated soil losses were higher at Eti-Osa West, parts of Iru/Victoria Island, and Ikoyi/Obalende areas recorded low losses. Land uses mostly affected by very high and severe erosion are the bare soils and the crop lands having about 3% to 4% respectively compared to the others. It was concluded that combination of rainfall, lack of cover for the surface soil, were the major causes of soil loss in the study area.
1. Introduction
Assessing the soil erosion rate is essential for the development of adequate erosion prevention measures for sustainable management of land and water resources. Geographic Information System (GIS) and Remote Sensing (RS) technologies has been used to provide the land use/cover information by using digital image processing techniques. There have been many studies on modeling soil erosion by utilizing Remote Sensing and Geographic Information System (GIS) technologies [1,2]. The capabilities of these technologies even increase when they are integrated with empirical erosion prediction models. While soil erosion models only calculate the amount of soil erosion based on the relationships between various erosion factors, Remote Sensing and Geographic Information System (GIS) integrated erosion prediction models do not only estimate soil loss but also provide the spatial distributions of the erosion. Especially, generating accurate erosion risk maps in Geographic Information System (GIS) environment is very important to locate the areas with high erosion risks and to develop adequate erosion prevention techniques [1,3]. This paper assessed the problem of erosion in Eti Osa Local Government Area, Lagos State, Nigeria, mapped out areas prone to erosion, and assessed the perceptive of occupants and their interplay in the study area. This research work applied RS and GIS techniques modeling erosion in the study area.
2. Study Area
Eti-Osa Local Government Area is located between 6°15′ and 6°17′ and longitude 3°3′ East and 3°3′ East (Figure 1). It is bounded in the south by Atlantic Ocean, in the east by Ojo Local government, north by Lagos lagoon and part of Mainland and Island local government and in the west by Ibeju-Lekki Local Government.
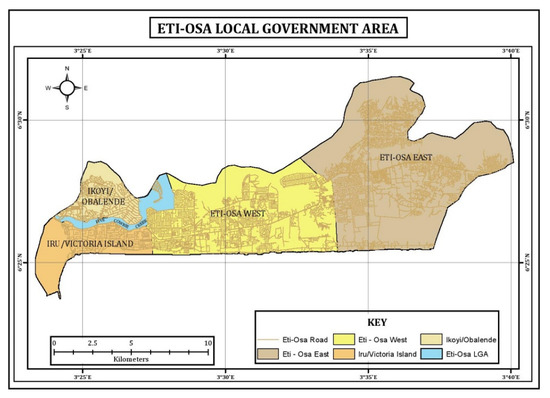
Figure 1.
Map of Study Area.
3. Methodology
3.1. Data and Preprocessing
The data used in executing this project are of three groups: satellite imageries, field data and questionnaires. The utilization of data include: soil data from soil test, hydrological data from NIMET, and Shuttle Radar Topographic Mission (SRTM) data for DEM and Landsat images. The soil data was obtained from soil test carried out at the Department of Civil Engineering, University of Lagos and the precipitation data from Nigerian Meteorological Agency. The Landsat images were obtained from Global land cover facilities (http://www.glovis.usgs.gov/). The soil test data was reprocessed into a rasterized soil map, delineating six different soil types in Eti-Osa Local Government.
3.2. Soil Erosion Risk Mapping Using RUSLE Model
The revised universal soil loss equation (RUSLE) [4] was used to assess the areas of erosion risk in the study area. The RUSLE equation is defined by the following parameters [4,5].
A = R × K × L × S × C × P
Where:
A = computed spatial average soil loss and temporal average soil loss per unit of area, expressed in the units selected for K and for the period selected for R. In practice, these are usually selected so that A is expressed in ton × acre−1 × yr−1, but other units can be selected (that is, ton × ha−1 × yr−1). R = rainfall-runoff erosivity factor—the rainfall erosion index plus a factor for any significant runoff from snowmelt (100ft × tonf × acre−1 × yr−1); this factor was obtained from the rainfall data of the study area. K = soil erodibility factor—the soil-loss rate per erosion index unit for specified soil as measured on a standard plot, which is defined as a 72.6-ft (22.1-m) length of uniform 9% slope in continuous clean-tilled fallow; L = slope length factor—the ratio of soil loss from the field slope length to soil loss from a 72.6-t length under identical conditions; S = slope steepness factor—the ratio of soil loss from the field slope gradient to soil loss from a 9% slope under otherwise identical conditions. C = cover management factor—the ratio of soil loss from an area with specified cover and management to soil loss from an identical area in tilled continuous fallow. P = support practice factor—the ratio of soil loss with a support practice like contouring, strip-cropping, or terracing to soil loss with straight-row farming up and down the slope. These factors were derived from the classified land use map of the study area. These factors as defined above are the inputs of the RUSLE model used in estimating the average amount of soil loss as modeled by [5,6,7,8].When all these factors as defined are obtained and then multiplied as shown in the equation above the estimated amount of soil loss were calculated.
3.3. Questionnaire Administration
Structured questionnaire were administered to elicit information on the communities’ perception of the causes and impact of erosion on the environment. Stratified random sampling and random sampling techniques were the sampling techniques used. The settlements were grouped into four strata based on the Local Council Development Area (LCDA/Ward) and then the questionnaires administered randomly in each stratum. Information obtained from the questionnaire administration were subjected to statistical analysis test using the Analysis of Variance (ANOVA) [8,9]. Also, focus group discussion was held with some of the occupants in the community with the view of acquiring information on the perceived causes and impact of erosion in the community.
4. Result and Discussion
4.1. Classified Images
The imagery analyses revealed that between 1986 and 2016, considerable changes had occurred in most parts of the area. Between 1986 and 2000 for instance, there was an expansion in the area cover by built-up from 21.65 to 41.03%. Between 2000 and 2002, the water body and the natural forest shrank from 17.8 to 17.19% and from 27.27 to 23.8% respectively. However, between 2002 and 2006, the built-up area increased from 42.9 to 45.28% reducing the water body and natural forest from 17.19 to 16.15% and 23.8 to 21.06% respectively. In the last three years of the study period (between 2013 and 2016), the built up area and light forest expanded from 46 to 55.96 and 18.69 to 21.78% respectively, while the barren land and swamp reduced from 7.12 to 4.72% and 13.08 to 1.87% respectively (Figure 2). This is a very clear indication of increase in the human population of Eti-Osa.
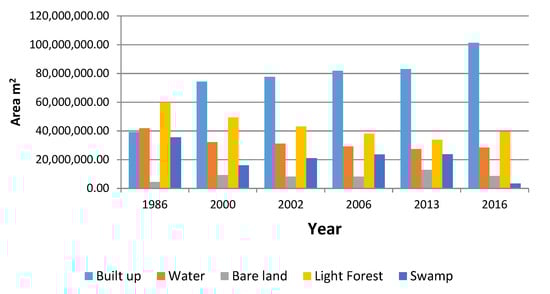
Figure 2.
Land use/Land Cover between 1986 and 2016.
4.2. Questionnaire Result
The results showed that the responses of the occupants were influenced by their occupation. The ANOVA result indicated a significant difference in the opinions of the respondents as regards what they understood by the term erosion (p = 3.898, p > 0.005). That is, their occupation affected the way they responded to some of the questions.
4.3. The Soil Loss Rate
The data layers (maps) obtained for K, LS, R, C, and P factors of the RUSLE model were integrated (Figure 3) in the raster calculator option of the spatial analyst function in ArcGIS 10.5 in order to quantify, evaluate, and generate the potential soil erosion risk map for Eti-Osa LGA.
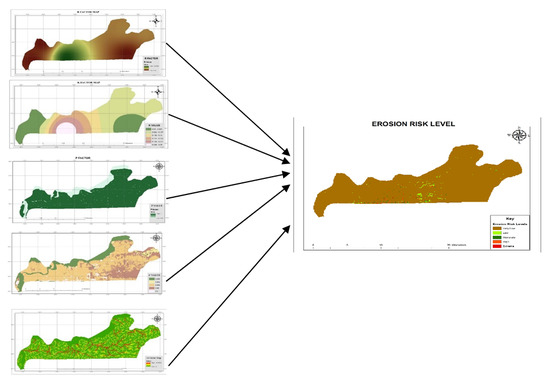
Figure 3.
The data layers (maps) obtained for K, LS, R, C, and P factors of the RUSLE model and integrated to produce the Erosion Risk Level Map.
The Soil erosion Map of Eti-Osa Local Government Area showed flashes of yellow, orange and red, which indicate moderate, high and extreme erosion sites. From Figure 3, it can be seen that the bare lands close to ocean and crop lands were mostly eroded. This can be attributed to the high rainfall and less vegetation cover to protect the soil. There are signs of erosion within the urban areas and sites close to the water body. The soil loss in the vegetated areas can be attributed to logging activities. When the area is deforested, leaving the land exposed and bare, the C and P value becomes high posing huge erosion risks.
According to [9] it was reported in the study carried out on land exposure and soil erosion in part of humid region of Southwest Nigeria that soil erosion appears to be an urban phenomenon and has been occurring at unprecedented rates, creating numerous problems and resulting in heavy economic, human and social losses in many cities in Nigeria and if it is allowed to continue unchecked it has the potential to impact on food security, water resources, biodiversity and climate change.
5. Conclusion
Highly erosive rainfall, poor cover management and support practices, sand filling and land clearing in Eti-Osa for urbanization and infrastructure development have resulted in widespread soil erosion over the land surface. The extent of soil erosion occurring in the area is still increasing and is now a major cause for concern. The RUSLE model was combined with RS and GIS techniques to analyze the annual average soil loss rates caused by the various factors which influence soil erosion: rainfall, soil erodibility, topographical factors and the cover and support practices within the study and to evaluate the spatial distribution of soil loss rates under different land uses. From the results of the study, it can be concluded that combination of rainfall, lack of cover for the surface soil, were the major causes of soil loss in the study area.
Author Contributions
E.O.M. and E.I.O. conceived and designed the experiments; E.O.M. designed this work, monitored and supervised its implementation. E.I.O. performed the experiments; E.O.M. and E.I.O. analyzed the data and wrote the manuscript.
Conflicts of Interest
There is no conflict of interest.
References
- Ganasri, B.P.; Ramesh, H. Assessment of soil erosion by RUSLE model using remote sensing and GIS—A case study of Nethravathi Basin. Geosci. Front. 2016, 7, 953–961. [Google Scholar] [CrossRef]
- Demirci, A.; Karaburun, A. Estimation of soil erosion using RUSLE in a GIS framework: A case study in the Buyukcekmece Lake watershed, northwest Turkey. Environ. Earth Sci. 2012, 66, 903–913. [Google Scholar] [CrossRef]
- Zhang, K.; Li, S.; Peng, W.; Yu, B. Erodibility of agricultural soils of the Losses Plateau of China. Soil Tillage Res. 2004, 76, 157–165. [Google Scholar] [CrossRef]
- Renard, K.G.; Foster, G.R.; Weesies, G.A.; McCool, D.K.; Yoder, D.C. Predicting Soil Erosion by Water: A Guide to Conservation Planning with the Revised Universal Soil Loss Equation (RUSLE); Agriculture Handbook No.82 703; U.S. Department of Agriculture, Agricultural Research Service: Washington, DC, USA, 1997. [Google Scholar]
- Wischmeier, W.H.; Smith, D.D. Predicting Rainfall Erosion Losses: A Guide to Conservation Planning; Agriculture Handbook No. 537; USDA: Washington, DC, USA, 1978. [Google Scholar]
- Lee, J.H.; Heo, J.-H. Evaluation of estimation methods for rainfall erosivity based on annual precipitation in Korea. J. Hydrol. 2011, 409, 30–48. [Google Scholar] [CrossRef]
- Makinde, E.O. The Perception of Communities Prone to Environmental Degradation. In 2nd Africa Regional Conference Technical Proceedings; Organization for Women in Science for the Developing World (OWSD): Sunyani, Ghana, 2014; pp. 756–766. [Google Scholar]
- Omodanisi, E.O.; Eludoyin, A.O.; Salami, A.T. A Multi-Perspective View of the Effects of a Pipeline Explosion in Nigeria. Int. J. Disaster Risk Reduct. 2013, 7, 68–77. [Google Scholar] [CrossRef]
- Xu, Y.Q.; Shao, X.M.; Peng, J. Assessment of soil erosion using RUSLE and GIS: A case study of the Maotiao River watershed, Guizhou Province, China. Environ. Geol. 2009, 56, 1643–1652. [Google Scholar]
Publisher’s Note: MDPI stays neutral with regard to jurisdictional claims in published maps and institutional affiliations. |
© 2018 by the authors. Licensee MDPI, Basel, Switzerland. This article is an open access article distributed under the terms and conditions of the Creative Commons Attribution (CC BY) license (https://creativecommons.org/licenses/by/4.0/).