Extended Abstract

Consequence Modelling for Estimating the Toxic Material Dispersion Using ALOHA: Case Studies at Two Different Chemical Plants †

by
Azizan Ramli
*,
Norfaridah Abdul Ghani
,
Norhaniza Abdul Hamid
and
Mohd Shaiful Zaidi Mat Desa
Faculty of Chemical and Natural Resources Engineering, Universiti Malaysia Pahang, Lebuhraya Tun Razak, Gambang, Kuantan 26300, Pahang, Malaysia
*
Author to whom correspondence should be addressed.
Presented at Environment, Green Technology and Engineering International Conference (EGTEIC 2018), Caceres, Spain, 18–20 June 2018.
Proceedings 2018, 2(20), 1268; https://doi.org/10.3390/proceedings2201268
Published: 18 October 2018

Abstract

:
Industrial disaster does not only result in enormous calamities and huge property damages but also deteriorate the environment especially when it involved hazardous materials. The occurrence of major accident at major hazard installation (MHI) is unpredictable. Therefore, both structural and non-structural measures should come in the forefront before it claims human life and tremendously destroy the assets and environment. Thus, the main objectives of this study is to simulate the consequence modelling due to toxic materials dispersion (sulfuric acid) and subsequently suggest the evacuation mapping. The Areal Location Hazardous Atmosphere (ALOHA Version 5.4.7) was used to determine the threat zone and estimates the radius of toxic material dispersion from the source point. Two petrochemical plants were selected in this study and both are located at different petrochemical industrial estates in East Coast Region of Peninsular Malaysia. Based on the findings, it can be concluded that the radius of toxic material affects the adjacent facilities and other chemical plants in proximity. The threat zones with the radius of 0.72 miles (red), 2.6 miles (orange) and 6.0 miles (yellow) respectively were determined for the first case study. As for the latter, the threat zones are greater than 6 miles for all zones. Based on both estimations, the evacuation mappings were proposed by sketching the map from Google satellite in the MARPLOT application.

1. Introduction

Process industries were haunted by the fear of unpredictable occurrence of major fire, explosion and accidental dispersion of hazardous chemical. Most of the industrial chemicals are flammable, explosive, toxic and corrosive. Unexpected release of these materials has a very high potential to cause deadly effects and damage the surrounding areas. Even though large release is rare to happen accept the once that occurred in Bhopal which claim huge loss of life [1] but, regardless of the type of industry, there is a possibility for major accident to occur if inadequate control and measures are not in place. Although there are safety systems installed on the platforms, the facility is never completely safe [2]. Once the hazardous chemical leakage occurred and any unexpected incident happen, it can easily cause a vicious disaster such as toxic dispersion, fire, explosion with casualties, property damage and environment pollution [3]. The use of toxic chemical substances in the chemical plant calls for careful handling. Wherever toxic or flammable chemicals are being manufactured, processed, stored or shipped, there will always be a chance of an accident and accidental release of the hazardous substance to occur. Even small releases of substance can cause harm to people, damage the environment or even destroy the property. As reported by Tseng et al. [4], chemical leakage poses a severe threat to the safety of workers and people who is living in close proximity and pollute the air quality. As such, the prevention and simulation of chemical leakage has become one of the most important topics in the fields of environmental protection and process safety.
The emergency response plan is a method that dealing emergency event such as fire and explosion [6]. Indeed, the failure to establish an appropriate response planning to confront with such disastrous event will result in huge losses. Thus, the main objective of this study is to simulate the consequence modelling due to toxic gas dispersion and estimate the radius of toxic gas dispersion. The purpose of this modelling is to quantify the negative impacts when hazardous event take place [5]. Result from this simulation will be used to propose the safest evacuation route as part of the emergency response planning for that particular areas.

2. Materials and Method

For the purpose of this study, two different chemical plants (MNC) located at two different states of Peninsular Malaysia have been selected—Gebeng Industrial Estate, Pahang and Teluk Kalong Industrial Estate, Terengganu. Due to unavoidable matter and issue on confidentiality, the name of both companies agreeably ought to be disclosed. Both of chemical plants in this research were characterized as a Major Hazard Installation (MHI) that dealing with the storage of hazardous materials (sulfuric acid) exceeding the threshold quantity as regulated in Control of Industrial Major Accident Hazard (CIMAH 1996) Reg. 1996 (Malaysia’s Occupational Safety and Health Act 1994). MHI poses a risk to people which include workers and the neighboring industries [7]. According to Baybutt [8], hazard study involves the process of identifying the hazards and determining hazardous scenarios. In order to determine the possible Major Accident Event (MAE), triangulation method has been introduced; a walkthrough observation, document analysis and expert judgement. The initial step will be a walkthrough observation and followed by document analysis. Both method will assist the evaluator to determine any potential hazards and to know the lay of the area as an overview of the facility in their “natural condition”. For estimating the radius of toxic gas dispersion towards the adjacent area next to the plant, the consequence modelling using Areal Location Hazardous Atmosphere (ALOHA) Version 5.4.7 was developed. In addition to the data from the chemical plants, meteorological data is also important. In order to assess to this information, an assistance from Malaysia Meteorological Department is needed. Finally, emergency evacuation mapping will be proposed based on the graphical results from ALOHA modelling and Mapping Application for Response, Planning, and Local Operational Tasks (MARPLOT). This mapping then will assist the organization to plan for an emergency preparedness. When developing an emergency action plan, some important and responsible person must be selected to lead and coordinate emergency plan and evacuation [9]. The proposed evacuation mapping will be reviewed by the person-in-charge who is an expert in the field of safety management and emergency response of that particular plants.

3. Result

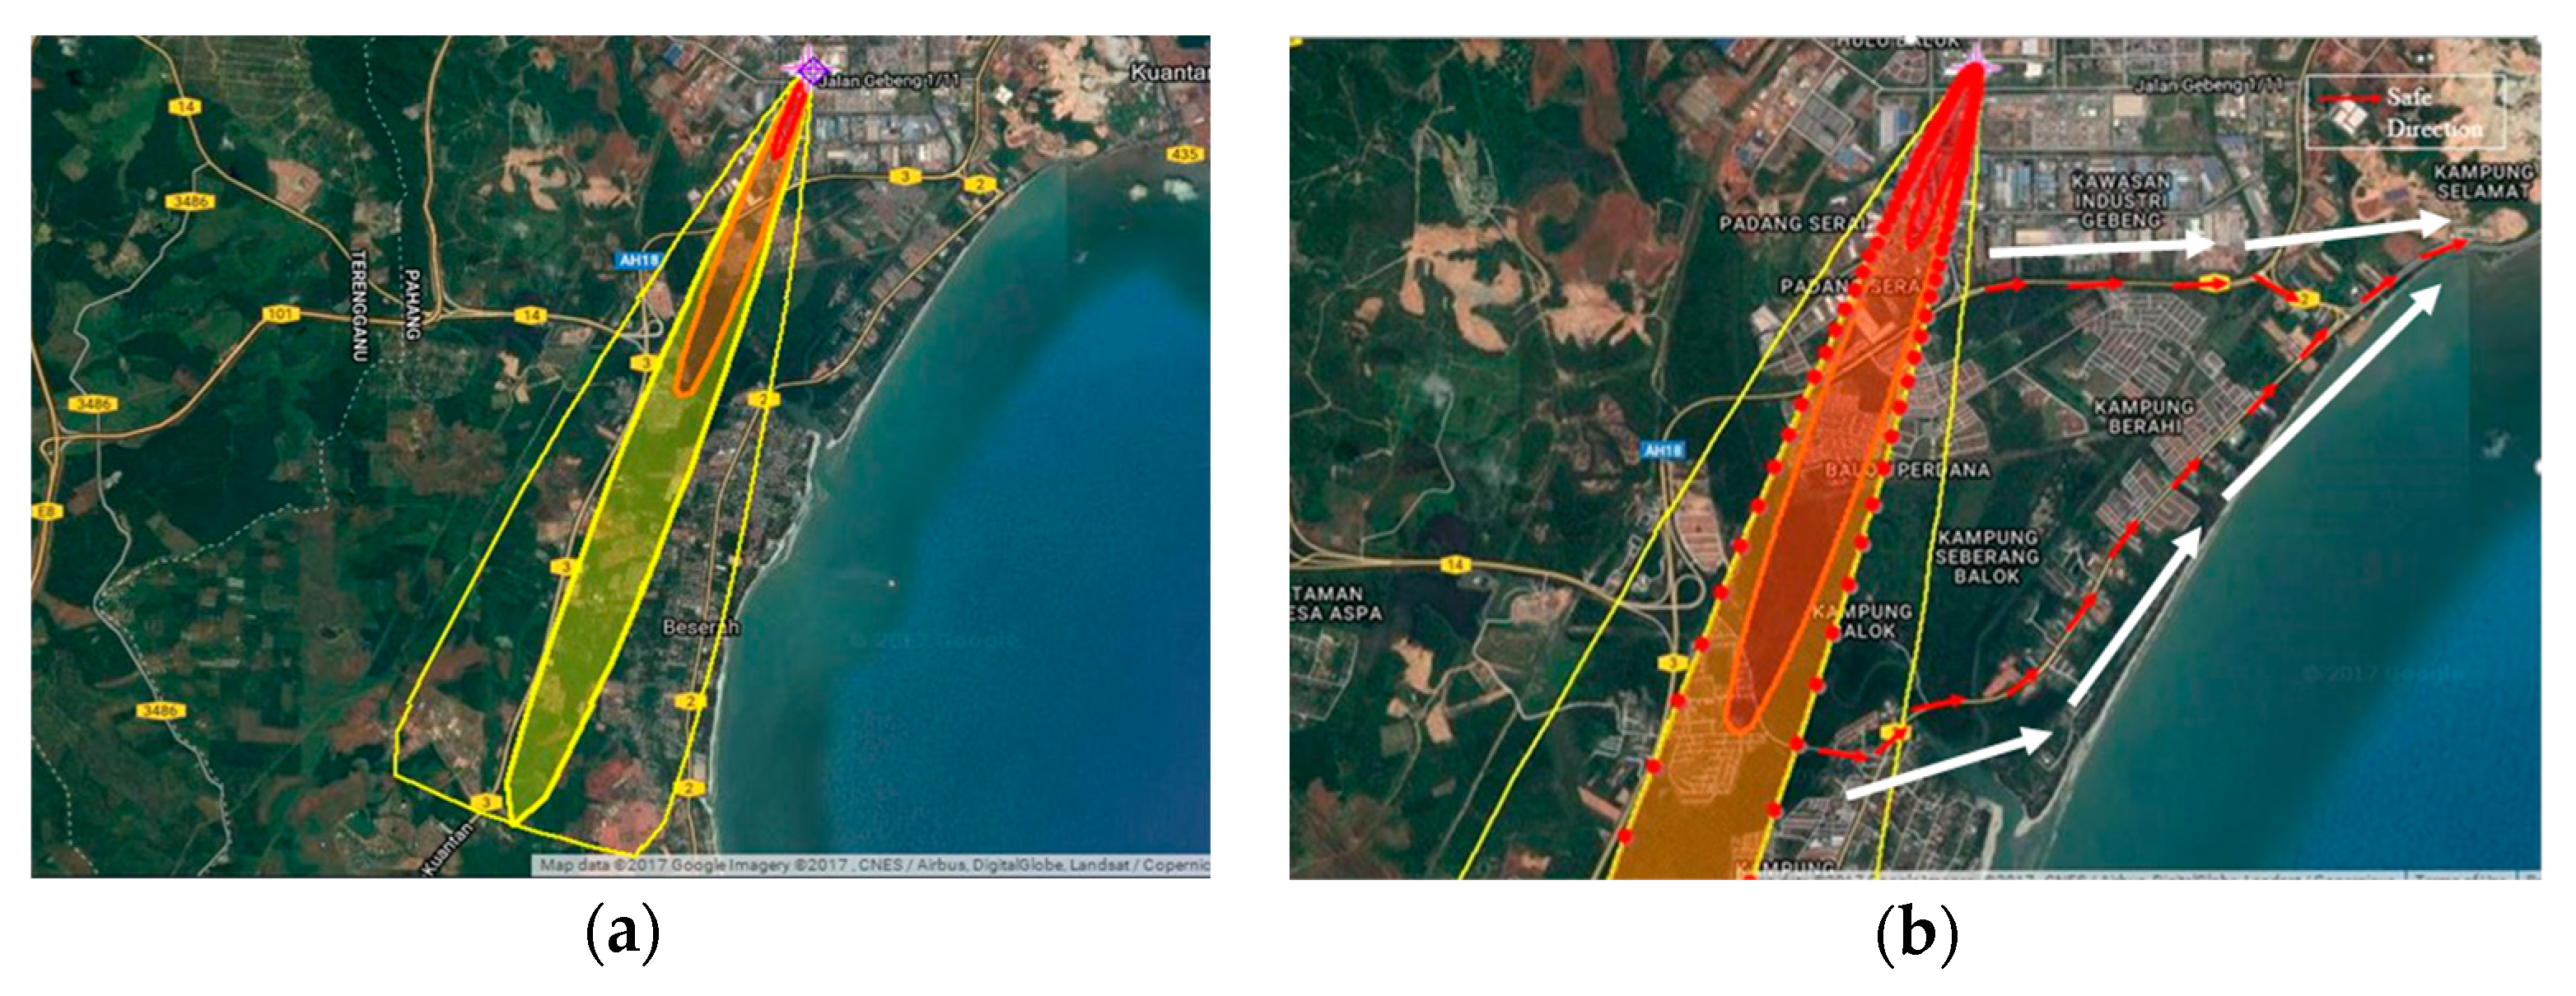
3.1. Case Study 1 (Chemical Plant A of Company X)

The first case study is at chemical plant located in Gebeng Industrial Estate, Pahang State of Peninsular Malaysia. The chemical under simulation is sulfuric acid in a 64 m3 tank. The possible MAEs were identified via walkthrough observation of their process flow and plant layout. Document reviewed in this study contained the details of the plant process flow, chemical inventory and tank specification. Moreover, an interview session also has been conducted at the study area. All data collected then were executed by the software (ALOHA) and appeared in the form of the graphical threat zone on Google Earth (MARPLOT). The toxic threat zone was divided into three layer—red, orange and yellow. Red zone represents ERPG-3 which expose concentration of 120 mg/m3 and was dispersed to 0.72 miles from the source point. Orange zone represents ERPG-2 which exposes concentration of 10 mg/m3 and was dispersed to 2.6 miles from the source point. While the yellow zone represents ERPG-1 which expose concentration of 2 mg/m3 and was dispersed to 6.0 miles from the source point. The radius of wind confidence line of the threat zone is 6.0 miles.
Figure 1a shows the toxic threat zone generated by ALOHA. With the wind speed of 7.5 m/s from 20 degrees at 15.2 m height above the ground and has D atmospheric stability class which is stable. The radius of wind confidence line from the source point is 6.0 miles which is equal to 9.7 km covered 360 degree of the radius of affected area. The radius of red zone from the source point is 0.72 miles which is equal to 1.1 km. The toxic gas disperses to the atmosphere 1.1 km with the wind prevalence at 20 degrees. The red zone affects the facilities and area nearby facilities: Plant 1, Plant 2 and adjacent roads including the one which are usually used by public to exit to the East Coast Highway and Gebeng Bypass. The radius of orange zone from the source point is 2.6 miles which is equal to 4.2 km. The toxic gas disperses to the atmosphere 4.2 km with the wind prevalence at 20 degrees. The radius of yellow zone from the source point is 6.0 miles which is equal to 9.7 km. The toxic gas disperses to the atmosphere 9.7 km with the wind prevailing at 20 degrees.
Figure 1b represents the proposed safest evacuation route at the affected area. The red and white arrows show the safest direction to exit the radius of wind confidence line.

3.2. Case Study 2 (Chemical Plant B of Company Y)

As for the second case study, Company Y which is located at Teluk Kalong Industrial Estate, Trengganu was selected. The chemical under simulation is also sulfuric acid in 11.84 m3 tank. Figure 2a shows the flammable threat zone generated by ALOHA. With the wind speed of 10.5 m/s from 220 degrees at 16 m height above the ground and has D atmospheric stability class (stable condition). The radius of wind confidence line from source point is 6.3 miles which is equal to 10.1 km covered by 360 degree of radius of the affected area.
The radius of red zone from source point is greater than 6 miles which is equal to 9.7 km. The flammable gas disperses to the atmosphere 9.7 km with wind prevalence at 220 degrees. The red zone affects the facility or area nearby because effect of near field make dispersion predictions more reliable for long distance. The radius of orange zone from source point is greater than 6 miles which is equal to 9.7 km. The flammable gas disperses to the atmosphere 9.7 km with the wind prevailing at 220 degrees. The radius of yellow zone from the source point is greater than 6 miles which is equal to 9.7 km. The flammable gas disperses to the atmosphere 9.7 km with the wind prevailing at 220 degree. The yellow zone affect several area of Company Y and others two companies in proximity. Figure 2b represents the proposed safest evacuation route. The white arrow shows the safest direction to exit the radius of wind confidence line.

4. Conclusions

The possibility of Major Accident Event (MAE) occurrence due to toxic release to occur is significantly high because of process complexity and the use of hazardous chemicals. The existence of huge storage of hazardous chemicals in both of chemicals plant will potentially trigger the disastrous accident. Based on ALOHA result, it can be concluded that the radius of toxic gas dispersion clearly affects the adjacent facilities used by the public and neighbouring companies. Thus, the proposed safest evacuation route will help the organization to plan for emergency preparedness. Even though, Malaysia has yet to experience gruesome and disastrous industrial accident but the proactive measures should not be taken for granted by all parties, especially industrial players and the government. Planning for evacuation mapping as well as preparedness for any uncertainties due to the release of toxic materials from MHI should be prioritised in industry’s corporate strategies.

Author Contributions

A.R. conceived and designed the experiments; N.A.G. and N.A.H. performed the experiments and analyzed the data; A.R., N.A.G. and N.A.H. wrote the paper; M.S.Z.M.D. contributed in reviewing the paper.

Acknowledgments

Many thanks to those who had graciously supported this work—Faculty of Chemical and Natural Resources Engineering, Universiti Malaysia Pahang and two Safety Managers/experts; Abdul Razak Sibok and Ridzuan Onn for their kindness and invaluable supports. This work was also funded by Universiti Malaysia Pahang through research grant RDU1703165.

Conflicts of Interest

The authors declare no conflict of interest.

References

  1. Khan, F.I.; Abbasi, S.A. Major accidents in process industries and an analysis of causes and consequences. J. Loss Prev. Process Ind. 1999, 12, 361–378. [Google Scholar] [CrossRef]
  2. Pula, R.; Khan, F.; Veitch, B.; Amyotte, P.R. A Grid Based Approach for Fire and Explosion Consequence Analysis. Process Saf. Environ. Prot. 2006, 84, 79–91. [Google Scholar] [CrossRef]
  3. Liu, X.; Li, J.; Li, X. Study of dynamic risk management system for flammable and explosive dangerous chemicals storage area. J. Loss Prev. Process Ind. 2017, 49 Pt B, 983–988. [Google Scholar] [CrossRef]
  4. Tseng, J.M.; Su, T.S.; Kuo, C.Y. Consequence evaluation of toxic chemical release by ALOHA. Procedia Eng. 2012, 45, 384–389. [Google Scholar] [CrossRef]
  5. Arunraj, N.S.; Maiti, J. A methodology for overall consequence modelling in chemical industry. J. Hazard. Mater. 2009, 169, 556–574. [Google Scholar] [CrossRef] [PubMed]
  6. Tseng, J.M.; Kuo, C.Y.; Liu, M.Y.; Shu, C.M. Emergency response plan for boiler explosion with toxic chemical releases at Na-Kung industrial park in the central Taiwan. Process Saf. Environ. Prot. 2008, 86, 415–420. [Google Scholar] [CrossRef]
  7. Ibrahim, M.S.; Fakharu’l-razi, A. Major hazard control: The Malaysian experience. Disaster Prev. Manag. Int. J. 2003, 12, 420–427. [Google Scholar]
  8. Baybutt, P. Requirements for improved process hazard analysis (PHA) method. J. Loss Prev. Process Ind. 2014, 32, 182–191. [Google Scholar] [CrossRef]
  9. Chao, E.L.; Henshaw, J.L. How to Plan for Workplace Emergencies and Evacuations. U.S. Department of Labor, Occupational Safety and Health Administration 2001, OSHA 3088. Available online: https://www.osha.gov/Publications/osha3088.pdf (accessed on 12 April 2018).
Figure 1. (a) Threat zone (Chemical Plant A); (b) Proposed evacuation route.
Proceedings 02 01268 g001
Figure 2. (a) Threat zone (Chemical Plant B); (b) Proposed evacuation route.
Proceedings 02 01268 g002
Publisher’s Note: MDPI stays neutral with regard to jurisdictional claims in published maps and institutional affiliations.

