Abstract
Heart disease is currently one of the leading causes of death in developed countries. The electrocardiogram is an important source of information for identifying these conditions, therefore, becomes necessary to seek an advanced system of diagnosis based on these signals. In this paper we used samples of electrocardiograms of MIT-related database with ten types of pathologies and a rate corresponding to normal (healthy patient), which are processed and used for extraction from its two branches of a wide range of features. Next, various techniques have been applied to feature selection based on genetic algorithms, principal component analysis and mutual information. To carry out the task of intelligent classification, 3 different scenarios have been considered. These techniques allow us to achieve greater efficiency in the classification methods used, namely support vector machines (SVM) and decision trees (DT) to perform a comparative analysis between them. Finally, during the development of this contribution, the use of very non-invasive devices (2 channel ECG) was analyzed, we could practically classify them as wearable, which would not need interaction by the user, and whose energy consumption is very small to extend the average life of the user been on it.
1. Introduction
Cardiovascular diseases are a serious public health problem in industrialized countries [1,2], since they occupy the first place as cause of death. Half of the deaths in developed countries were due to four chronic diseases: cancer, ischemic heart disease, cardiovascular disease and diabetes mellitus. Cardiovascular diseases are due to disorders of the heart and blood vessels, including coronary heart disease (heart attacks), cerebrovascular diseases (stroke), increased blood pressure (hypertension), peripheral vasculopathies, rheumatic heart diseases, congenital heart disease and heart failure. Cardiac diseases increase the demand for medical services causing severe socio-economic repercussions [3]. To this problem, must be added the possibility of suffering cardiovascular disease people who are considered healthy or who have not previously symptoms of cardiovascular problems, and perform a physical exercise that may have as a consequence a serious problem on our body or even the need to be treated urgently before a cardiovascular block (even there are cases of sudden death).
The main objective of the contribution is the development of an intelligent decision support system, with low energy capacity, able to inform, diagnose and detect cardiac abnormalities during the realization of physical activity of a patient (therefore working in real time) using sensors and advanced processing, as a wearable system. During this contribution, the foundations have been laid for the development of a device with low energy cost, which can work for long periods of time, being non-invasive and comfortable for the subject (this wearable system can be used both during sport or during our daily life, being comfortable).
2. Data Base of ECG Signal
In this type of problem it is necessary to clarify that the comparison, analysis and direct study of signals in the original domain is an unapproachable task and that, therefore, the inference of knowledge from them is impossible. Therefore, it is necessary to define a specific characterization of them in order to reduce the volume of information and simplify the computational resources required.
The first step was to provide a broad set of signals, both ECG and activity of an individual. For ECG signals it will be necessary to have a large number of records representing different pathologies. In addition to this, it was essential that the ECG signals had annotations made by specialists, who helped us to extract the samples that needed a long-term signal, being necessary to also know some parameters such as sampling frequency or amplitude.
As a source of ECG information, it has been used by the company Physionet [4,5], which in addition to possessing the so-called PhysioToolkit (which contains tools and software collection for the processing and analysis of signals of physiological origin and for the detection of physiologically significant events), contains also the PhysioBank database (contains a relevant set of digital records corresponding to signals of physiological origin, freely offered through the web to the international scientific community of researchers, existing biomedical signals that cover a wide spectrum of real cases from both healthy patients, as well as patients with deficiencies in their health). PhysioBank comprises more than thirty databases for ECG. The electrocardiogram databases that have been used in this contribution are:
- MIT-BIH Arrhythmia Database (mitdb): collection of 48 half-hour fragments obtained from two channels, with annotations. The sampling frequency is 360 Hz, with 11 bits of resolution and a range of 10 mV.
- MIT-BIH Malignant Ventricular Arrhythmia Database (mfdb): contains 22 half-hour records. The annotations are related to the change of pace. Signals from the two channels, sampled at 250 Hz.
- MIT-BIH Atrial Fibrillation Database (atr): collection of 25 records of 10 h. 23 records are available through Physionet. With rhythm notations. With sampling frequency of 250 Hz.
- AF Termination Challenge Database (aftdb): completed in 2004. It contains 30 learning recordings and two groups of 20 and 30 records. Coming from two channels and with 1 min of duration. Sampled at 128 Hz.
- MIT-BIH Normal Sinus Rhythm Database (nsrdb): contains 18 records with a duration between 20 and 24 h. Sampling frequency of 128 Hz.
- Sudden Cardiac Death Holter Database (sddb): collection of 23 records. Many of the recordings contained in the MIT-BIH Malignant Ventricular Arrhythmia Database are extracts from the records of this database. Sampling frequency of 250 Hz.
- BIDMC Congestive Heart Failure Database (chfdb): 15 records of 20 h duration. Use of two channels with frequency of 250 Hz.
It is important to note that for the original ECG signals obtained, it is necessary to perform an initial pre-processing (filtering, noise elimination, scaling, etc.) to be able to proceed in the next stages of characterization of them [6,7]. Once the signals were obtained, we proceeded to the construction of filters and pre-processing them (elimination of noise, etc. [8]) in order to subsequently carry out the characterization (extraction of the most relevant variables or characteristics of these temporary signals) [9]. This task will have two subtasks or phases: first, the development and implementation of the algorithms and methodologies for the extraction and characterization of the signals. Second, it will be the determination of the time window in which said variables will be measured.
3. Characterization and Feature Extraction
The characteristic extraction technique used during the realization of the present contribution consisted in both the morphological characterization of the different cardiac pathologies that are to be classified, as well as in the use of mathematical transformations (wavelet transform [10,11,12]).
3.1. ECG Characterization
An electrocardiogram (ECG) can be represented by a graph in which the variations of the heart voltage, captured by electrodes on the surface of our body, in relation to time are represented. Thus, the measured voltage is characterized on the vertical axis, and time on the horizontal axis. These voltage variations are the result of depolarization and repolarization of the heart muscle, which produce electrical changes that reach the surface of the body. The nomenclature used in the electrocardiogram will be determined by the diastolic phase, represented by the isoelectric line in which two positive potentials are shown on the top and two negative ones on the bottom. And on the other hand, the systolic phase, composed of two opposing processes, activation and myocardial recovery designated alphabetically with the letters P, Q, R, S, T and U (see Figure 1). We define each of them:
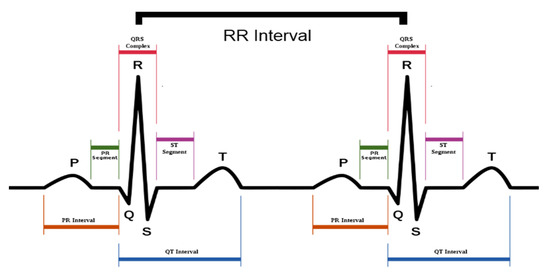
Figure 1.
ECG signal representation.
- Wave P: muscle activation wave, is the result of atrial depolarization. Small, of uniform ascent and descent, rounded cusp and amplitude and provided duration, not exceeding 2.5 mm.
- QRS complex: group of ventricular activation waves. Of shorter duration and greater amplitude. The R or S wave may predominate, but the Q wave is usually small with width greater than 1 mm (duration less than 0.04 s).
- Wave Q: negative wave that is not preceded by R wave. It represents the depolarization of the interventricular septum, the wall that divides the two ventricles.
- Wave R: any positive wave of the QRS complex. It is due to the depolarization of the tip of the left ventricle.
- Wave S: any negative wave preceded by a R wave. It represents the depolarization of the base of the left ventricle.
- Wave T: ventricular recovery wave. Amplitude and duration greater than the P wave, usually enclosing an area similar to that of the QRS complex.
- Wave U: wave of uncertain origin. Slow, small amplitude that follows wave T.
- Segment PQ: period of electrical inactivity that separates atrial from ventricular activation. It goes from the end of the P wave to the beginning of the QRS complex.
- ST segment: period of inactivity that separates the activation of the ventricular recovery. It goes from the end of the QRS complex to the beginning of the T wave.
- The PR interval, which includes the P wave plus the PQ segment, represents the time between the beginning of atrial depolarization and the beginning of the ventricular depolarization.
In general, the waves of the electrocardiogram have certain ranges of size, height, depth and duration which allows us to extract information such as the following:
- Arrhythmias (disturbances in heart rhythm), if they are atrial or ventricular, with or without alterations in heart rate: tachycardia (increased) or bradycardia (decreased).
- Locks in the electric conduction.
- Increase in size or dilatation of the atria and/or ventricles.
- Areas of ischemia, injury or myocardial infarction.
The ECG has the advantage of being a medical procedure with immediate, non-invasive and economic results.
3.2. Feature Extraction
Obtaining morphological characteristics of the signals (such QRS complex amplitude, RR peak distances, P wave amplitude, mean heart rate, etc.) can be a first approximation to obtain relevant information for the future classification of arrhythmias. However, this methodology does not take into account the non-stationary character of ECG signals, presenting high sensitivity in its estimation. For this reason, the Wavelet transform (WT) will be used, which allows the joint localization of time-frequency events, being suitable for non-stationary signals. The WT decomposes the signal in its different spectral components, so that each one of them has a resolution according to its scale.
Along with this Wavelet transform, other mathematical characteristics were also used, such as: Amplitude, autocorrelation, cepstrum, energy spectral density, FFT coefficients, asymmetry coefficient, zero crossings, kurtosis, standard deviation, total energy, entropy, etc. It should be noted that for the ECG problem, having two derivations, the total number of extracted characteristics is 142 (76 of the first derivation and 76 of the second).
3.3. Analysis of the Size of the Window for the Classification of ECG
The segmentation of the signal is a crucial step in the process of extracting characteristics. Although there is no clear consensus on the size of the window that should be used, for example in the recognition of human activity or in the ECG, in the present contributions various experiments have been carried out, with the aim of having a precise range of intervals of optimum time.
Finally, for the ECG of two derivations, it was estimated that the appropriate window should be of 24 s duration, not only based on some bibliographic references that appeared in the literature, but also due to the fact that it is a multiple value of 8 s, and that after the analysis of different time lengths, the best value was 8 s (the use of segments of this length is that, using the files sampled at 250 Hz, we obtain for the calculation of the characteristics based on the frequency spectrum the same number of points of the Fourier transform of the signals (1024), which implies an improvement in the accuracy of the analysis).
Therefore, most of the parameters are extracted in a segment of 8 s, and/or averaging in three consecutive (window of 24 s) which adds robustness to the system (for example, ensuring that it is not an isolated episode of the pathology, with certain pulses that can be classified as noisy).
4. Hybrid Methodologies for Feature Selection
The selection of variables is an essential step in solving any modeling/classification problem of a system. We can initially calculate and obtain a wide set of variables, but it is relevant to determine which variables are really influential in the behavior of the system.
In the work carried out in the present contribution, two different approaches have been used for the selection of characteristics: filter type approach (PCA, mRMR, MILCA) and Wrapper type approach, where the final classifier is also relevant, (in this sense they have carried out methodologies that hybridize Genetic Algorithms for selection of variables and intelligent classifiers type SVM, see Figure 2).
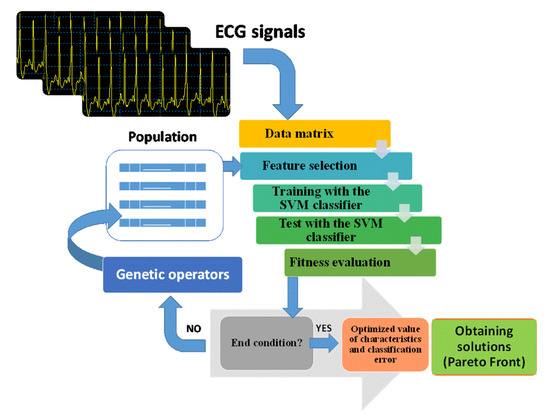
Figure 2.
Block diagram of the Multi-objective Genetic Algorithm for the determination of relevant characteristics together with the parameters used.
Schematically, the analysis of principal components (PCA) allows to synthesize quantitative data, with the minimum loss of information, for the reduction of the initial data set, obtaining what are called main components.
MILCA (Mutual Information Least-dependent Component Analysis) presents an algorithm that allows us to analyze data using a fairly accurate mutual information estimator (MI), to find the lowest dependency between components, based on the differential entropy estimator Kozachenko-Leonenko.
The criterion of maximum dependence, maximum relevance and minimum redundancy (mRMR), uses a methodology based on mutual information, of minimum redundancy, maximum relevance for obtaining the set of characteristics. Indicate that the three filtering methods have been used satisfactorily in this contribution (see Figure 3).
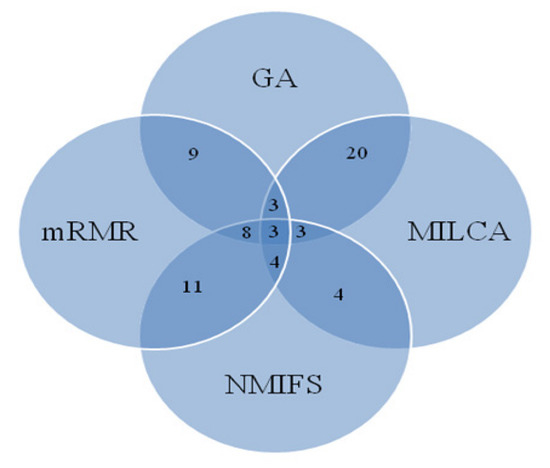
Figure 3.
Behavior of the different algorithms for the selection of characteristics and common characteristics that are selected by more than one methodology.
Briefly, indicate that for the Genetic Algorithm that hybridizes the selection of characteristics and classification, a multi-objective algorithm (NSGAII) was used, where the first objective is based on the system error and the second on the complexity of the system. (measured as the number of selected variables). Figure 2 shows the scheme used for the hybrid system of the Multi-objective Genetic Algorithm (NSGA-II) with SVM classifiers and the parameters used.
In summary, for the study of the ECG, Figure 3 shows the results obtained by the different methods of feature selection. As can be seen, the Multi-objective Genetic Algorithm is the methodology that contains a larger set (84 characteristics), while the MILCA method selects 31 and with the PCA technique we obtain 29 main components (however, these components do not correspond to the initial characteristics, being linear combination of the initial 142 characteristics and therefore, were not used in the present project in the process of classification of pathologies). The output of the NMIFS (normalized mutual information feature selection) and mRMR methods provide us with a set of characteristics of the same size as the initial set, but ordered by relevance or importance. The best 15 were selected, since with this threshold an adequate precision was obtained.
5. Intelligent System for the Diagnosis of Heart Diseases Using ECG
For this task, it has previously been necessary to carry out a rigorous analysis of databases containing information on cardiac pathologies, and these can be analyzed using a two-channels ECG, and in a second phase, the development of the intelligent system able to classify new ECG signals.
As indicated in Section 2 the PhysioBank database will be used. The pathologies that have been selected are: ventricular bigeminy; First degree AV block; Atrial fibrillation; Ventricular fibrillation; Atrial flutter; Heart failure; Pacemaker; Nodal rhythm; Normal sinus rhythm; Atrial tachycardia and finally ventricular tachycardia. Figure 4 shows an example of these original ECG signals (as can be seen from the original signals, it is necessary to correctly align, filter and process them, as indicated in Section 2).
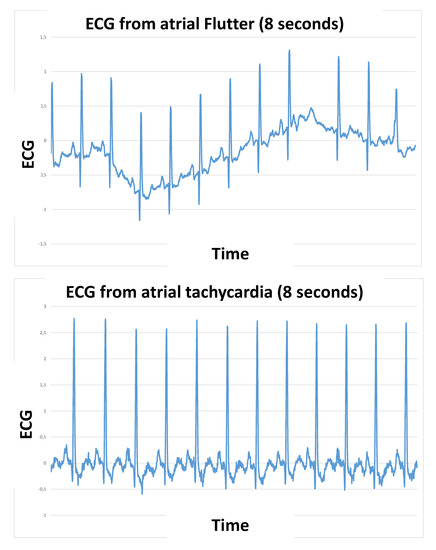
Figure 4.
Examples of ECG signals (a single derivation is included for brevity) for a time window of 8 s in the pathology of atrial flutter and atrial tachycardia.
To carry out the task of intelligent classification, 3 different scenarios have been considered:
- General classification: it is a question of classifying independently the 10 cardiac pathologies, together with patients who have a normal or healthy sinus rhythm.
- Classifier by groups: Analyzing the origin and similarity of the pathology and its corresponding derived ECG signals, 4 groups of pathologies are made:
- Subgroup A. Auricular Muscle (MA). Pathologies: Atrial tachycardia; Atrial fibrillation; Atrial flutter;
- Subgroup B. Ventricular Muscle (MV). Pathologies: Ventricular Bigeminy; Ventricular fibrillation; Ventricular tachycardia
- Subgroup C. Pacemaker.
- Subgroup D. Other pathologies: Nodal rhythm; Heart failure; First degree AV block.
- Subgroup E. Normal sinus rhythm
- Binary Classification: it is a classifier with two classes, where the class of healthy patients (nsr) that have a normal ECG and, on the other, are grouped in a single class (patients) those that have some type of condition (that is, the patients of the ten pathologies).
As methodologies for the realization of the intelligent classifier, three types were analyzed:
- I.
- Support vector machines (SVM): this is a static network based on kernels that performs linear classification on vectors transformed into a higher dimensional space. That is, it separates through an optimal hyperplane in the transformed space. SVM is an effective technique for classification applied to large data sets. It can also use RBF kernel, which generally, as in the case of this contribution, present a high accuracy.
- II.
- Decision Trees (DT), are presented as a supervised classification method that uses a structure composed of nodes and arcs or branches. The nodes can be of three types, on the one hand, we will have the root nodes, internal nodes (they have one or more test attributes) and the leaf or decision nodes, they constitute the final elements that determine the belonging of an object to a class, so they will not have branches of output.
- III.
- Random Forest. This technique combines the methodology of decision tree construction, but incorporating multiple trees or solutions, introducing a randomness component, to determine the training set and the variables with which the system is trained.
The initial classification results, for the different scenarios presented, using different sets of variables and the three classifiers, are summarized in Figure 5. Due to the good result and simplicity of the decision trees, and keeping in mind that in the present project the hardware implementation of the system developed in a system with low energy capacities was analyzed, it has been the decision tree solution that has been selected, bearing in mind the accuracy obtained and also the ease of being able to be implemented in a real device that works in real time.
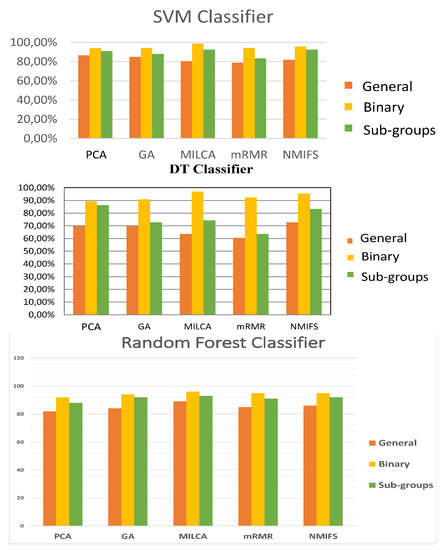
Figure 5.
Behavior of different classifiers, using different sets of input variables and different numbers of output classes.
6. Analysis of Low Energy Wearable Sensors
Wearable devices, is increasingly a reality in our society, with various applications in the field of health, sports and welfare, entertainment, military, etc. In this area, during the development of this contribution, the use of very non-invasive devices (2 channel ECG) was analyzed, we could practically classify them as wearable, which would not need interaction by the user, and whose energy consumption is very small to extend the average life of the user been on it. This field of energy saving or utilization, the capture of energy resources (whose term is Energy Harvesting) is very relevant today.
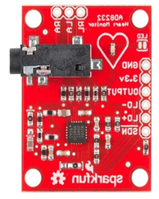
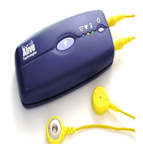
We have analyzed three devices (see Table 1), in which the intelligent system for the automatic diagnosis of cardiovascular diseases can be implemented (using DT for simplicity), which are detailed below:

Table 1.
Description of three devices for the implementation of the intelligent system.
In this contribution, it was decided that the best device was the AD8232 Heart Rate Monitor.
7. Conclusions
The main objective of the contribution is the development of an intelligent decision support system, with low energy capacity, able to inform, diagnose and detect cardiac abnormalities during the realization of physical activity of a patient (therefore working in real time) using sensors and advanced processing, as a wearable system. To carry out the study of five methods of feature selection, applied to the data extracted from various ECG signal registers and evaluated by means of different classifiers. All this, with the aim of obtaining more efficient systems for the detection of cardiovascular diseases, more specifically arrhythmias on electrocardiogram records.
Finally, during the development of this contribution, the use of very non-invasive devices (2 channel ECG) was analyzed, we could practically classify them as wearable, which would not need interaction by the user, and whose energy consumption is very small to extend the average life of the user been on it. Details of the analyzed ECG devices are presented in this contribution, where the DT based classification algorithm was implemented
Acknowledgments
The publication of this article was supported by projects TIN2015-71873-R and P12-TIC 2082.
References
- Tompkins, W.J. Biomedical Digital Signal Processing; Prentice-Hall: Englewood Cliffs, NJ, USA, 1993. [Google Scholar]
- Athif, M.; Yasawardene, P.C.; Daluwatte, C. Detecting atrial fibrillation from short single lead ECGs using statistical and morphological features. Physiol. Meas. 2018. [Google Scholar] [CrossRef] [PubMed]
- Venkatesan, C.; Karthigaikumar, P.; Varatharajan, R. A novel LMS algorithm for ECG signal preprocessing and KNN classifier based abnormality detection. Multimed. Tools Appl. 2018, 77, 10365–10374. [Google Scholar] [CrossRef]
- Goldberger, A.L.; Amaral, L.A.N.; Glass, L.; Hausdorff, J.M.; Ivanov, P.C.; Mark, R.G.; Mietus, J.E.; Moody, G.B.; Peng, C.K.; Stanley, H.E. Physiobank, physiotoolkit and physionet: Components of a new research resource for complex physiologic signals. Circulation 2000, 101, e215–e220. [Google Scholar] [CrossRef]
- Moody, G.B.; Koch, H.; Steinhoff, U. The PhysioNet/Computers in Cardiology Challenge 2006: QT Interval Measurement. Available online: https://www.physionet.org/challenge/2006/ (accessed on 10 April 2006).
- Gorbunov, B.B.; Gusev, A.N.; Kamenskii, S.A.; Selishchev, S.V. Comparison of the Efficacy and Noise Immunity of Algorithms for Recognition of Shockable Cardiac Rhythms. Biomed. Eng. 2004, 38, 133–139. [Google Scholar] [CrossRef]
- Chetan, A.; Tripathy, R.K.; Dandapat, S. A Diagnostic System for Detection of Atrial and Ventricular Arrhythmia Episodes from Electrocardiogram. J. Med. Biol. Eng. 2018, 38, 304–315. [Google Scholar] [CrossRef]
- Pawel, P. Novel methodology of cardiac health recognition based on ECG signals and evolutionary-neural system. Expert Syst. Appl. 2018, 92, 334–349. [Google Scholar]
- Rad, A.B.; Eftestøl, T.; Engan, K.; Irusta, U.; Kvaløy, J.T.; Kramer-Johansen, J.; Wik, L.; Katsaggelos, A.K. ECG-Based Classification of Resuscitation Cardiac Rhythms for Retrospective Data Analysis. IEEE Trans. Biomed. Eng. 2017, 64, 2411–2418. [Google Scholar] [CrossRef] [PubMed]
- Sahoo, S.; Kanungo, B.; Behera, S.; Sabut, S. Multiresolution wavelet transform based feature extraction and ECG classification to detect cardiac abnormalities. Measurement 2017, 108, 55–66. [Google Scholar] [CrossRef]
- Zhou, H.; Zhu, X.; Wang, S.; Zhou, K.; Ma, Z.; Li, J.; Hou, K.M.; De Vaulx, C. A Novel Cardiac Arrhythmias Detection Approach for Real-Time Ambulatory ECG Diagnosis. Int. J. Pattern Recogn. Artif. Intell. 2017, 31, 1758004. [Google Scholar] [CrossRef]
- Kumar, M.; Pachori, R.B.; Acharya, U.R. Automated Diagnosis of Myocardial Infarction ECG Signals Using Sample Entropy in Flexible Analytic Wavelet Transform Framework. Entropy 2017, 19, 488. [Google Scholar] [CrossRef]
Publisher’s Note: MDPI stays neutral with regard to jurisdictional claims in published maps and institutional affiliations. |
© 2018 by the authors. Licensee MDPI, Basel, Switzerland. This article is an open access article distributed under the terms and conditions of the Creative Commons Attribution (CC BY) license (https://creativecommons.org/licenses/by/4.0/).

