Abstract
Personal Health Records (PHR) are electronic tools managed by the patients themselves, allowing them to store and consult health data anywhere and at any time using an electronic device. Precisely because of the type of users they are aimed at, it is essential to guarantee that PHR are easy to use. However, having a PHR that is usable does not mean that it is the best in terms of energy efficiency. Taking into account the large number of users that this type of portal is aimed at, achieving savings in energy consumption when running the portal’s tasks can have a considerable impact. In this paper we present an initial approach that studies the interaction between usability and energy efficiency of PHRs, attempting to determine if a given PHR makes efficient use of the resources it needs for the execution of its tasks. To do this, we have used the EET device, which allows us to collect the consumption of different hardware components when running software (in our case the PHR), and the usability criteria defined by Dix.
1. Introduction
Personal health records (PHRs) are defined as health records related to patient care that are controlled by the patient [1,2]. PHRs can also be said to be a representation of the health information, wellness, and development of a person [3]. The main advantages of PHRs have to do with the ability of patients to maintain data on their health. However, many challenges need to be overcome if widespread PHR adoption is to be promoted [4].
The main challenges and issues regarding the use of PHRs are related to confidentiality, integrity, authorization, access control, portability, efficiency, scalability of solutions, and issues related to user experience [5].
As already mentioned, efficiency is an element within the challenges PHRs present. One aspect to be studied and controlled as part of the overall efficiency is energy efficiency. This issue is especially important in environments such as PHR, which has a large number of potential users; that means that a small saving in the energy needed by a given task translates into a large-scale saving when extrapolated to all the people who can use this portal.
This work is part of an initiative we are developing to provide a collection of PHRs that are usable, but also environmentally friendly. This study can be classified as belonging to what is known as “Green In software”, a new research line that attempts to develop software in the most efficient way from the resource utilization point of view (whatever those resources may be).
In this paper, therefore, we present the relationship between the usability and the energy efficiency of a specific PHR, the PHR NoMoreClipBoard. This study is just the beginning of the path towards a more ambitious goal, which is the production of a general list of PHRs, ordered according to the respective usability and energy efficiency of each.
Section 2 will present general information about PHRs. The main aspects about software sustainability, along with the framework we have developed to measure and assess the software sustainability, are explained in Section 3. Section 4 provides an in-depth look at the proof of concept developed with a PHR, and the last section presents our conclusions and the future work we plan to carry out.
2. Personal Health Records
The Internet is increasingly involved in our daily routine, both through websites and in applications, or by means of services that we employ for a wide variety of uses, ranging from consulting the weather to planning a trip. This technological dependence is growing steadily, and the use of ICT (Information and Communication Technology) in our daily lives has become the norm.
The medical field is no exception, with the emergence of computer applications, implemented as web solutions, to encourage patients and involve them in their health care. This is the case with Personal Health Records (PHRs), which are electronic tools managed by the patients themselves, allowing them to store and consult health data anywhere and at any time using an electronic device [6].
Over the years, these applications have become more popular. By way of example, Kaiser Permanente (https://healthy.kaiserpermanente.org/) is one of the most well-known PHR, with more than 11 million registered users by the end of 2017 [7].
PHRs, with their focus on the medical and IT industries, allow individuals to increase the quality of their lives by managing their own health information. This means that it is really important for researchers in the healthcare industry to consider development, implementation, and expansion of PHRs; there is a need for them to endeavour to accelerate the realization of their full potential for health consumers, especially those with chronic conditions [8].
The literature demonstrates positive outcomes for PHR users, related to experience of healthcare, partnership-working with care professionals, and health efficacy. There is an appetite among citizens to adopt a PHR, especially in those individuals who have long-term conditions and who experience tangible benefits from adopting a PHR [9].
Certification of PHRs is necessary for their future adoption and usage, and to guarantee their quality. The certification commission for health information technology has recommended certification of the following PHR attributes: privacy, security, interoperability, and functionality [10]. However, as remarked in [9], in order for people to trust these systems, they also need easy access and usability.
As can be observed, there is no mention of the amount of resources used by the PHR. We believe this is because sustainability of software is a new player in the game. Society is increasingly aware of the importance of preserving the environment. Sustainability is thus gaining relevance in almost every aspect of everyday life, and PHR, as part of this everyday reality, must take that issue into consideration.
3. Software Sustainability
Until relatively recently, the vast majority of advances in technology sustainability have focused on hardware. However, in recent years this trend has been changing, and research has already emerged in the area of software sustainability, focusing on the proper use of the resources required by the software [11].
In [11] three dimensions for software sustainability are identified, depending on the resources used (Figure 1):
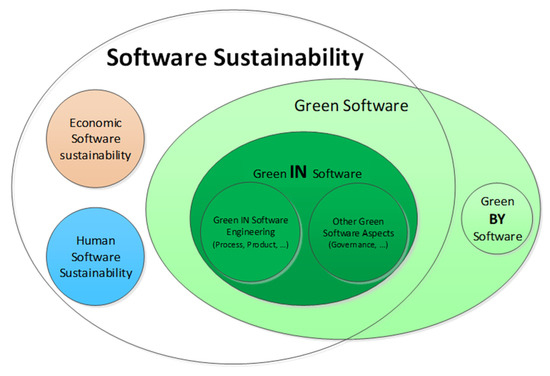
Figure 1.
Software Sustainability dimension.
- Human sustainability: how software development and maintenance affect the sociological and psychological aspects of the software development community and its individuals.
- Economic sustainability: how the software lifecycle processes protect stakeholders’ investments, ensure benefits, reduce risks, and maintain assets.
- Environmental sustainability: how software product development, maintenance and use affect energy consumption and the usage of other resources.
The environmental sustainability dimension, also known as Green Software, which is the focus of this work, promotes improvement in the energy efficiency of software, minimizing its environmental impact, and having a positive impact on the other two dimensions [12].
In addition, Green Software can be divided into Green BY software and Green IN software, depending on the particular role that the software plays [13], as follows:
- Green by software. Software that is developed for domains that work to preserve environmental sustainability, i.e., software which serves as a tool to support sustainability objectives.
- Green in software. How to make software more sustainable, resulting in a more environmentally-friendly software product.
This work is on Green IN software in general, and on Green IN PHR in particular. In other words, what we want is to evaluate whether the PHRs (as software applications) are developed in such a way that they are respectful of the environment and make appropriate use of the resources they need for their execution. In addition, we want to compare whether there is any relationship between the energy efficiency of a PHR and its usability. We decided to focus on this relationship because we believe that usability is crucial in this type of system, since PHRs are intended to be used by non-specialists, and probably of a certain age. The combination of these two characteristics (usability and energy efficiency) can give a very interesting added value to any PHR which, of course, meets the other properties already mentioned. These properties include those such as privacy, security, interoperability or functionality, which we believe these types of systems must accomplish in any given case.
Having this information for an individual PHR is interesting, obviously, because it provides us with additional data on the use it makes of the resources. But this information is even more interesting if we have it available for different PHRs; this would allow us to have a comparative table that would make it possible to choose the most efficient and, at the same time, the most usable PHR.
In order to assess whether a PHR is sustainable, we need to measure the use it makes of the resources. Such measurements can be used, for example, to identify those parts of the PHR that require most energy, so that software changes can be made to reduce the consumption.
To make the measurements and to interpret the measurement results we use FEETINGS (Framework for Energy Efficiency Testing to Improve eNviromental Goals of the Software), whose objective is: to measure the energy consumed by a software product (in our case a PHR) when it is executed in a PC; to collect this consumption data; and to provide an appropriate visualization of this information.
3.1. FEETINGS
As already mentioned, FEETINGS [14] allows the measurement and analysis of the energy consumed by a software application. The framework (Figure 2) is composed of two main components:
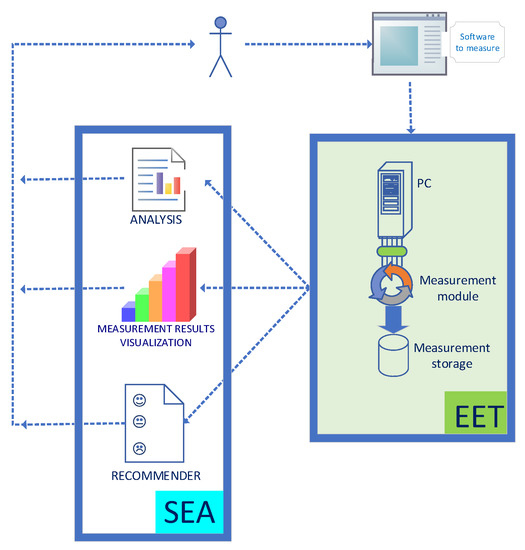
Figure 2.
FEETINGS overview.
- The core is EET (Energy Efficiency Tester), which is the hardware device that has been built to collect the consumption data of a software product.
- The software part, SEA (Software Energy Assessment), which is responsible for processing the data collected by EET, analyzing these and generating an appropriate visualization of the results (according to their nature). SEA is being developed right now, and we believe it will be available soon.
3.2. EET
As we have already introduced, EET is the hardware device that we have built [14] and which allows us to measure the energy consumption of a set of hardware components used by a software product during its execution.
EET supports the measurement of three different hardware components: processor, hard disk and graphics card, from any PC. It also includes two sensors that provide both the total power consumption of the PC and the power consumption of the monitor connected to the equipment on which the software being evaluated is running. Once the measurements are made, they are stored in a removable memory, so that they can be used for analysis.
EET is portable and easy to connect to the PC (DUT, device under test) where the software to be measured is executed. It is only necessary to replace the power supply of the DUT with the EET power supply (see Figure 3).
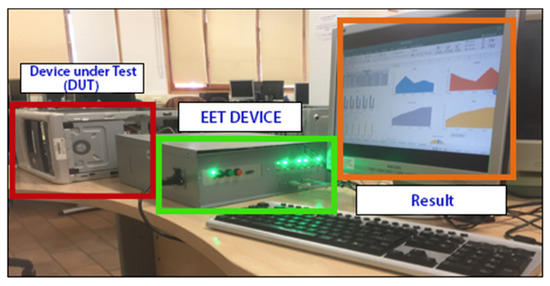
Figure 3.
EET device.
By way of example, in the following section we present the results of the energy consumption measurement of a PHR with the EET device, as well as its usability, aiming to determine if there is a relationship between the two (energy consumption and usability).
4. Proof of Concept
The objective of this section is to study the energy efficiency of a PHR, along with its usability, with the goal of determining whether there is any kind of relationship between them.
4.1. PHR Selection
The first step is the selection of the PHR that we are going to study. This section presents the process that has been carried out to choose the PHR that will be analyzed.
First of all, we searched for PHRs on Scopus and on the myPHR.com portal, limiting the results to free PHRs, with access on the web and in the standalone version. PHRs that were not operative were rejected.
After applying these criteria, the PHRs selected were: Doclopedia, Health Companion, Health Vault, Healthspek, Mi Via, My Chart Link, My Health Folders, My Health Vet, My Med Wall, No More Clipboard, Patient Power, Patients Like Me, Telemedical, WebMD, Zweena Health.
The popularity of web portals was then examined, in an effort to select the most popular PHRs. Amazon’s Alexa tool [15] was used for this purpose. PHRs that did not have any popularity scores were ruled out.
As a result of this process, the following PHRs were obtained: HealthCompanion, HeatlhSpek, MyHealthFolders, HealthVault, MyHealthVet, PatientsLikeMe, NoMoreClipBoard, and WebMD.
The last inclusion criterion adopted was task, based on the recommendations regarding basic tasks published on myPHR.com [16].
The final result was the selection of the PHR NoMoreClipBoard.
4.2. Energy Efficiency and Usability
From the basic tasks of a PHR published on myPHR.com, a list of 17 common tasks for a patient was proposed, in the quest to analyze the energy consumption and usability of the chosen web portal (Figure 4).

Figure 4.
Selected tasks.
EET was used for the measurement of the energy consumption, and 5 power consumption measurements were obtained for each of the main components of the PC: HDD, graphics card, processor, monitor and power supply, for each of the 17 tasks indicated.
In terms of usability, a model-based evaluation was conducted within the expert analysis methodology [17]. Usability was measured by just one researcher. According to [18], usability evaluations can be classified in two categories: usability inspections and usability tests. Usability inspections are examinations carried out by experts, without the participation of users. Usability tests are reviews performed by real users. We have adopted a usability evaluation method within the first category.
The usability of the PHR NoMoreClipBoard was evaluated using the usability criteria defined by the author Alan Dix, and evaluated on a 5-Likert scale for each of the 17 tasks and for the following 14 criteria:
- Easy to learn
- Flexibility
- Consistency
- Robustness
- Recoverability
- Response time
- Tasks Adequacy
- Decreased cognitive load
- Predictability
- Efficiency
- Aesthetic pleasure
- Clarity
- Compatibility
- Understandability
4.3. Results
Figure 5 shows the average consumption of the PC components: HDD, graphics card, processor, monitor and power supply, during the use of the PHR NoMoreClipBoard for the 17 tasks.
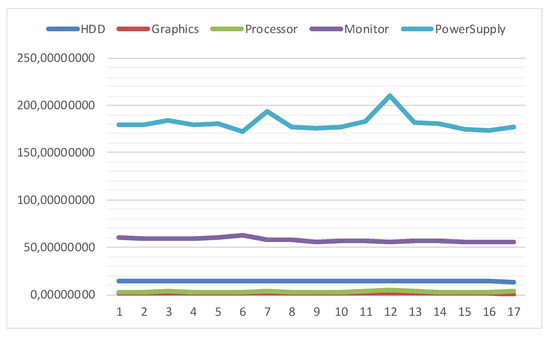
Figure 5.
Measurement results.
First of all, the correlation between the power consumption of the computer components was studied. The Shapiro-Wilk Test with a significance level α is 0.05 was used to study the normality of the distribution of the samples of the consumption of the 5 hardware components, as well as of the usability sample (DIX).
As shown in Figure 6, the monitor data (W = 0.106) have been extracted from a normally-distributed population, while the HDD (W = 0.004), graphics (W = 0.002), processor (W = 0.0) and powersupply (W = 0.0) have not. The correlation of the monitor data was therefore made with the Pearson correlation coefficient, while the correlation for HDD, Graphics, processor and power supply was made with the Spearman coefficient.
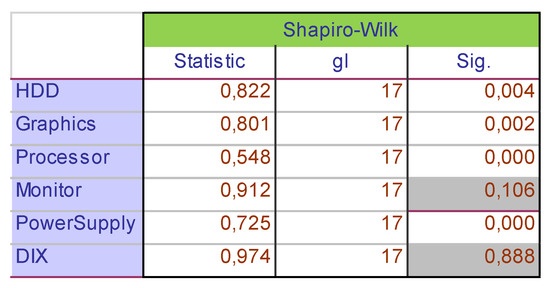
Figure 6.
Shapiro-Wilk results.
From the obtained results of both correlation coefficients (Figure 7), we observe 4 significative correlations (in grey): (1) HDD and graphics, (2) HDD and monitor, (3) monitor and graphics; and (4) power supply and processor.
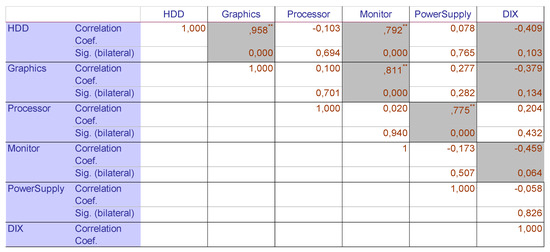
Figure 7.
Correlation results (Spearman and Pearson).
We have also analysed the relationship between the energy consumption of each hardware component (HDD, graphics, processor, monitor and power supply) and the usability measure (obtained from the 14 DIX criteria for each task). The data obtained for the usability evaluation were extracted from a population that is normally distributed (W = 0,888); see Figure 6.
In relation to the correlation between the usability evaluation and the consumption of the hardware components, no statistically significant correlation was observed. However, it is worth noting that there was a negative correlation between the consumption of various components and a usability that was close to being significant (see Figure 7):
- Monitor consumption (r = −0,459) and usability (p = 0.064).
- HDD consumption (r = −0,409) and usability (p = 0.103)
- To a lesser extent, Graphics (r = −0,379) and usability (p = 0.134)
This indicates that greater usability is associated with a lower power consumption of the monitor, of the HDD and, possibly, of graphics. Of course, we must take care with this interpretation because: (1) although coming very close to showing significative correlation, the results have not demonstrated complete and definitive correlation and (2) the DIX analysis for the usability measurement was done by just one researcher.
4.4. Comparing to Previous Results
As already mentioned, our final goal is to have a complete list of PHRs, where two main aspects will be used to rank them: usability and greenability. In this paper we have shown the results for a given PHR (NoMoreClipBoard). Previously, we did the same analysis for another PHR (HealthVault). Figure 8 shows the differences and similitude between both.
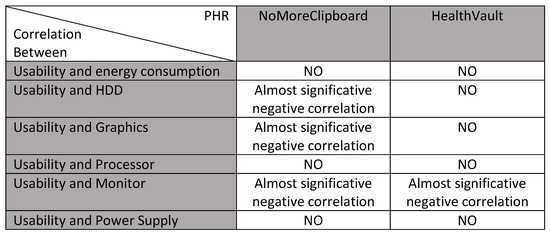
Figure 8.
Results comparison.
From both analyses it is not possible to extract definite conclusions, except for the fact that the bigger the usability, the lower the monitor energy consumption.
By way of example of what we want to obtain at the end of the analysis for all the PHRs we plan to study, if we consider the relationships shown in Figure 8 as conclusive, our recommendation would be to choose the NoMoreClipBoard PHR, because it is as usable as the other, and besides, it is better as far as resource utilization is concerned.
5. Conclusions and Future Work
PHRs are becoming a widely-used resource in controlling a person’s medical information. The main advantage of PHRs is the ability of patients to maintain data on their health. The main challenges and issues regarding the use of PHRs are related to confidentiality, integrity, authorization, access control, portability, efficiency, scalability of solutions, and issues related to user experience [5].
However, we consider it that it is also of prime importance to take the amount of resources used by the PHR into consideration. This concern is directly related to sustainability, an issue which has increasing relevance in our daily life, as society is becoming more and more conscious of the importance of preserving the environment. If we want PHRs to be part of people’s daily life, their sustainability (understood as the use they make of the resources) must be taken into consideration when choosing a specific PHR.
This work is part of a more ambitious one, where we plan to rank a list of PHRs according to their usability and their energy efficiency. We wanted to focus on this relationship because we believe that usability is crucial in this type of systems; after all, PHRs are designed to be used by non-specialized people, and probably relatively elderly people. The combination of these two characteristics (usability and energy efficiency) can give very interesting added value to any PHR which, of course, meets the other properties already mentioned (privacy, security, interoperability or functionality) that we believe must inescapably be present in this type of system, by definition.
In this paper we have shown the process followed to obtain the relationship between the usability of a PHR and its energy efficiency (through the utilization of hardware resources). Having this information for an individual PHR is of great interest, since it provides us with additional information on the use it makes of the resources.
We have conducted the study with the PHR NoMoreClipBoard and, although we have not found a clear correlation, we have discovered a negative correlation between the consumption of various components and usability that is close to being significant. That correlation is between Monitor, hard disk and graphics, specifically, leading us to conclude that that greater usability seems to be associated with lower power consumption of the monitor, of the HDD and, possibly, of the graphics.
As we have already said, however, the goal is to have this information for a set of PHRs, it then being possible to choose the most efficient, as well as most usable, PHR. In that sense, and in order to provide an example, we have compared the results obtained with another PHR analysed previously (HealthVault), finding that the greater the usability, the lower the monitor energy consumption. Using the combined results from both PHRs, we would recommend NoMoreClipBoard PHR, since it is as usable as the other one; besides, it is better as regards resource utilization.
Our future work will be focused on the completion of the study about the correlation between Usability and the energy consumed by the hardware components. We also plan to use a group of patients to measure the PHR usability, going on to then calculate its interrater reliability. The final result will be a ranked list of PHRs, where usability and energy efficiency will be the ordering factors.
Author Contributions
Fundamentals on software sustainability is part of the work of the University of Castilla-La Mancha team: Work related to measurement with EET is part of the University of Castilla-La Mancha team; Fundamentals on PHR is part of the work of the University de Murcia team; Work related to the usability of PHR is part of the University of Murcia team; Analysis of the results has been carried out by both teams.
Acknowledgments
This work is part of the GINSENG-UCLM (TIN2015-70259-C2-1-R) and GINSENG-UMU (TIN2015-70259-C2-2-R) projects, supported by the Spanish Ministry of Economy, Industry and Competitiveness and European FEDER funds, and is also part of the SOS project (SBPLY/17/180501/000364), funded by the Consejería de Educación, Cultura y Deportes de la Dirección General de Universidades, Investigación e Innovación de la JCCM (the Castlla-La Mancha regional government).
References
- Tang, P.C.; Ash, J.S.; Bates, D.W.; Overhage, J.M.; Sands, D.Z. Personal health records: Definitions, benefits, and strategies for overcoming barriers to adoption. J. Am. Med. Inform. Assoc. 2006, 13, 121–126. [Google Scholar] [CrossRef] [PubMed]
- Spil, T.; Klein, R. The personal health future. Health Policy Technol. 2015, 4, 131–136. [Google Scholar] [CrossRef]
- ISO. Health Informatics—Personal Health Records—Definition, Scope and Context; ISO: Geneva, Switzerland, 2012; Available online: https://www.iso.org/obp/ui/#iso:std:iso:tr:14292:ed-1:v1:en (accessed on 31 July 2018).
- Baird, A.; North, F.; Raghu, T. Personal Health Records (PHR) and the Future of the Physician-patient Relationship. In Proceedings of the 2011 iConference, Seattle, WA, USA, 8–11 February 2011; ACM: New York, NY, USA, 2011; pp. 281–288. [Google Scholar]
- Roehrs, A.; da Costa, C.A.; da Rosa Righi, R.; de Oliveira, K.S.F. Personal Health Records: A Systematic Literature Review. J. Med. Internet Res. 2017, 19, e13. [Google Scholar] [CrossRef] [PubMed]
- Fernández-Alemán, J.L.; Seva-Llor, C.L.; Toval, A.; Ouhbi, S.; Fernández-Luque, L. Free web-based personal health records: An analysis of functionality. J. Med. Syst. 2013, 37, 9990. [Google Scholar] [CrossRef] [PubMed]
- KaiserPermanente, Kaiser Permanente at a Glance. 2018. Available online: https://ataglance.kaiserpermanente.org/ (accessed on 31 July 2018).
- Kim, J.; Jung, H.; Bates, D.W. History and Trends of. Healthc. Inform. Res. 2011, 17, 3–17. [Google Scholar] [CrossRef] [PubMed]
- Wyatt, J.; Hoogewerf, J.; Quinn, N.; Williams, J.; Clement, C.; Thimbleby, H.; Sathanandam, S.; Rastall, P. Personal Health Record (PHR) User Insights: Final Report; Health Informatics Unit; Royal College of Physicians: London, UK, 2017; ISBN 978-1-86016-674-7. eISBN 978-1-86016-675-4. [Google Scholar]
- Readers’ Perspective. The government-initiated program to reach consensus on the definition and use of the terms EMR, EHR, PHR, RHIO and HIE is a waste of time and resources. Health Data Manag. 2008, 16, 12. [Google Scholar]
- Calero, C.; Piattini, M. Puzzling out Software Sustainability. Sustainable Computing: Inform. Syst. 2017, 16, 117–124. [Google Scholar] [CrossRef]
- Penzenstadler, B.; Raturi, A.; Richardson, D.; Calero, C.; Femmer, H.; Franch, X. Systematic mapping study on software engineering for sustainability (SE4S). In Proceedings of the 18th International Conference on Evaluation and Assessment in Software Engineering, London, UK, 13–14 May 2014. [Google Scholar]
- Calero, C.; Piattini, M. Introduction to green in software engineering. In Green in Software Engineering; Coral, C., Mario, P., Eds.; Springer: Berlin, Germany, 2015; pp. 3–27. ISBN 978-3-319-08581-4. [Google Scholar]
- Mancebo, J.; Arriaga, H.O.; García, F.; Moraga, M.A.; García-Rodríguez de Guzmán, I.; Calero, C. (2018) EET: A device to support the measurement of software consumption. In Proceedings of the 2018 ACM/IEEE 6th International Workshop on Green and Sustainable Software (GREENS’18), Gothenburg, Sweden, 26–27 May 2018. [Google Scholar]
- Amazon. Alexa. 2018. Available online: https://www.alexa.com/siteinfo (accessed on 31 July 2018).
- AHIMA. myPHR.com. 2018. Available online: http://www.myphr.com/StartaPHR/Create_a_PHR.aspx (accessed on 31 July 2018).
- Dix, A.; Finlay, J.; Abowd, G.D.; Beale, R. Human-Computer Interaction, 3rd ed.; Prentice-Hall, Inc.: Upper Saddle River, NJ, USA, 2003; ISBN 978-0130461094. [Google Scholar]
- Quiñones, D.; Rusu, C.; Rusu, V. A methodology to develop usability/user experience heuristics. Comput. Stand. Interfaces 2018, 59, 109–129. [Google Scholar] [CrossRef]
Publisher’s Note: MDPI stays neutral with regard to jurisdictional claims in published maps and institutional affiliations. |
© 2018 by the authors. Licensee MDPI, Basel, Switzerland. This article is an open access article distributed under the terms and conditions of the Creative Commons Attribution (CC BY) license (https://creativecommons.org/licenses/by/4.0/).