1. Introduction
Ubiquitous collaboration is a computing paradigm that allows mobile workers to perform collaborative activities in anytime and anywhere [
1]. This paradigm becomes a requirement to address several types of mobile collaborative processes, but particularly those known as people-driven [
2], where there is not a clear workflow to be followed by the participants. In this paradigm, the actors (typically, people and software agents) decide their next steps on-the-fly according to several variables; for instance, their to-do list, the priority of these activities, and the current and envisioned work contexts. In other words, the collaboration process becomes unpredictable in terms of the sequence of actions that will be followed by the participants to reach their individual and group goals. Examples of people-driven processes are agile software development [
3], disaster relief efforts [
4], hospital work [
5] and informal family caregiving [
6].
The design of ubiquitous systems to support these processes becomes a challenge, since it is not possible to envision the users’ behavior ahead of time, and thus determine the potential scenarios in which the collaboration will take place. That situation limits the capability of software designers to determine the services that will be required by the participants when they decide to collaborate with others. Therefore, the developers do not know, at the development time, what interaction services must be embedded in the supporting system in order to easy the collaboration among the participants.
During the last decade the business process modeling community has been doing an extensive and interesting work to represent flexibility in people-driven processes [
7]; and regardless its advances, the authors have not found a modeling language or notation that allows specifying properly the computer-mediated interactions scenarios used by the participants to perform people-driven collaborations.
If the interaction scenarios cannot be envisioned at development time, it is almost impossible to determine the collaboration supporting services that should be embedded in the system. Therefore, the resulting products tend to have low effectiveness, and their usability and usefulness depend almost exclusively on the expertise of the system designers.
Given the workflow of people-driven processes cannot be determined ahead of time, this paper proposes to specify the roles participating in the process and the interactions among them, and based on it, to determine the potential interaction scenarios that can be used by the participants. Thus, the participants keep the control on their own workflow, deciding on-the-fly their next steps according to their own criteria.
In order to make feasible this modeling approach in practice, the article proposes a user interaction visual notation, named CIMoN (Computer-mediated Interaction Modeling Notation), which allows to represent the roles played by the participants in the collaboration process, and also the computer-mediated interactions among them. An interaction graph is the result of this design activity. The analysis of this graph allows developers to determine a set of interaction services that should be embedded in the ubiquitous system that supports the process.
The expressiveness and usability of the proposed notation was evaluated through two different instances, and in both of them the proposal was compared to the closest modeling notation reported in the literature. The first instance was a case study that involved a modeling activity in which participated 16 software designers. The second instance was a comparative analysis of the expressiveness of CIMoN. The obtained results were highly encouraging, showing that is feasible to address the stated design challenge, using the proposed notation.
Next section reviews the related work on modeling of interactions among people in dynamic work scenarios.
Section 3 presents the main concepts and rationale behind the proposed notation.
Section 4 describes the CIMoN notation, and its modeling and analysis capabilities.
Section 5 describes the case study conducted to evaluate the perceived usability of the proposed notation and the evaluation results.
Section 6 compares the expressiveness of CIMoN and the closest proposal reported in the literature, named MCM (Mobile Collaboration Modeling) notation [
8].
Section 7 presents the conclusions and future work.
2. Related Work
Regardless the extensive research conducted on flexible and people-driven collaborative processes, the identification of the interactions scenarios in which these collaboration activities could take place, have been partially addressed. The main obstacle to determine these scenarios has been the fact that in these processes the workflow followed by the participants is usually unpredictable [
2]. Therefore, the identification of these scenarios depends mainly on the ability of the software designers to envision them. Moreover, the characterization of these scenarios are usually poor, due to the design languages and notation that can be used to represent these collaboration settings, use few context variables.
The literature reports various visual notations to represent user interaction and also identify the collaboration supporting services that are potentially required to implement the behavior of these systems [
8,
9]. Although useful, these languages fall short in terms of their capability to represent the features and participants in a ubiquitous collaboration process. For instance, they are able to represent a small number of context variables and types of participant (roles).
Most modeling notations capable to represent ubiquitous collaborative scenarios use the interactions among participants as the base to define the system behavior. In this sense, a comparison between iStar (i*) and its extension named Collaborative Systems Requirements Modeling Language (CSRML) was performed by Teruel et al. [
10] in order to determine the understandability of both notations. These languages allow to model interactions among actors and derive software requirements from them; i.e., support the analysis phase involved in the development of the supporting systems. However, both notations require to count on a known workflow to specify the potential interactions among the participants, which is not feasible in people-driven processes [
2].
Using a similar approach, the Mobile Collaboration Modeling (MCM) notation [
8] considers the high-level workflows that structure the mobile collaboration processes, as an input to generate a graph of interactions among the roles involved in that process. In more recent work, Monares et al. [
9] extended the MCM notation to model interactions in human-centric wireless sensor networks. Although useful, the representation they generate are limited by the expressiveness of these notations. For instance, they do not provide information about what type of actor plays a role (e.g., a person or an intelligent agent), limiting thus the capability of the system designer to envision the availability of the actors when a collaboration request is triggered; a software agent will be always available, while a person will be potentially available and only in certain time periods. Representing interaction aspects like availability and type of the involved actors is relevant to design suitable supporting systems.
Finally, Dorn et al. [
11] propose the use of two human-centric specification languages to model interaction-intensive processes. Particularly, they propose to joint use of Little-JIL [
12] that is a process-centric language, and hADL (human Architecture Description Language) [
13] that is a structure-centric human interaction language. Although this proposal is interesting, the joint use of these design languages increases the complexity of the modeling process. Moreover, this proposal requires the use of an integration tool to be functional.
Summarizing, the current notations to specify interaction scenarios in people-driven collaboration processes, fall short in usability or in expressiveness of their representations. Therefore, alternative notations that address these limitations are required. Next section presents the foundations of the modeling notation proposed to deal with these issues.
3. Foundations of the Proposed Modeling Notation
CIMoN is aligned with the proposals represented in MCM and its variants [
9,
14]. Therefore, it considers the actors and the relationships among them, as the most important elements of the model. Moreover, the modeling approach follows a bottom-up strategy to compose the interaction representations (i.e., the interaction graph). However, CIMoN makes some assumptions that are not formally expressed or considered in the previous works:
The participants are autonomous and multitasking units that self-manage their activities according to their own criteria, considering the general business process being performed and also the current status of their local and process work contexts.
The autonomous units manage a list of pending activities that are prioritized according to criteria defined by each participant (e.g., level of urgency, criticality or a mix of them). The priorities of the activities change over time due to both, external factors and also the actions of the own unit (local actions). In this sense, the work conducted by each unit is similar to the one conducted by a juggler, where the person takes action on the most priority task, but keeping an eye to the pending activities, since their priorities can change quickly.
The work context is not formally represented in the modelling process, since it is infinite [
15] and its structure is usually uncertain, complex, and dynamic [
16]. However, status of the context can be informed to the autonomous units (e.g., through awareness mechanisms). The actors eventually interpret such information, and decide their next action based on it.
The interactions scenarios of autonomous units are different to those that involve the computing devices these actor use. Particularly, attributes like the availability of the autonomous units to collaborate, the type of interaction that is required by them, and the stability of the communication channel between devices they use, are valuable context variables that must be specified as part of the interaction scenario.
Similar to MCM, CIMoN has a computable representation (based on XML), therefore two or more interaction graphs specified in this notation can be automatically combined by a software application. This capability makes these process specifications easy to integrate, allowing to conduct the process modeling in an incremental way, which reduces the complexity of such an activity. These computable representation also allows using software applications to analyze and validate these specifications, reducing thus the workload and responsibilities of the software designers.
In this notation, the autonomous units are who decide their workflows and the temporality of their actions according to their current context. It is important to remark that CIMoN only considers the representation of computer-mediated interactions.
4. Computer-Supported Interaction Modeling Notation
The proposed notation is based on a graph, where the nodes represent the roles played by the actors participating in the collaborative process (i.e., the autonomous units), and edges indicate the potential interactions among them. CIMoN allows designers to represent each relationship between two nodes as a point-to-point relationship, which reduces the complexity of designing ubiquitous collaborative systems. Following the proposal of Herskovic et al. [
14], we named these meshes as Roles Interaction (RI) graphs; however, the RI graphs specified with CIMoN only represent computer-mediated interactions.
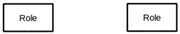
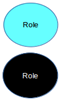
Table 1 shows the visual notation related to each type of node.
In collaborative systems design, the interactions among people has been characterized mainly using the Time-Space Matrix [
17]. However, CIMoN characterizes these interactions considering the
stability of the interaction channel between the participants. The stability represents the feasibility to count on a stable communication channel between the participants, at the time they decide to collaborate. This concept is close to the
reachability concept introduced by Herskovic et al. [
14] that is defined as the existence of a communication channel (physical or virtual) between two participants at the time they decide to collaborate.
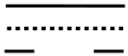
The edges linking nodes represent the interactions between these roles, and these links should be characterized. Particularly, the
stability of the communication link between roles must be represented, and it can assume the following values: stable, unstable, uncommunicated or no communication.
Table 2 shows the links representations and explains their meaning. The communication stability considered in this notation is only at devices level, no at the end-users level.
Regardless the specification of the stability of the link between nodes, the edges include one or more labels that represent the type of interaction that is required between the roles; i.e., these are interaction requirements that must be addressed by the supporting systems. The type of interactions can be synchronous, asynchronous or both of them, as indicated in
Table 3.
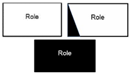
This notation also allows representing the
availability of participants (i.e., end-users: human actor, autonomous agent or intermediary) at the moment the interaction need to take place. Representing this aspect is particularly useful when synchronous interaction among nodes is required; i.e., when the edges are labeled with S or SA. In order to specify this feature, each node requiring synchronous interaction support is stereotyped with a rhombus, indicating its potential availability to interact with others:
always available,
sometimes available, or
never available.
Table 4 indicates how this attribute is visually represented in the RI graph, and also the corresponding meaning for each of them.
4.1. Enriched Notation
Each collaboration process is represented at interaction level as a RI graph, which can be integrated with other graphs when the actors are conducting several activities simultaneously. This integration allows creating more complete and complex interaction scenarios that help understand the collaboration capability of the participants and the ecosystem. In scenarios like in disaster relief efforts, where many activities are conducted in parallel and almost autonomously, and various of them involve the same subset of actors (e.g., the incident commander, logistics and security), this capability of compose and decompose RI graphs becomes highly valuable to identify bottlenecks, critical roles, interaction weaknesses and lack of support in the procedures and software systems used by the participants.
In this case, the representation of the nodes of the RI graphs is augmented with additional information that eases its analysis (and eventually the simulation of the mesh behavior). Particularly, mandatory and optional roles are visually labeled, and also the minimum number of participants per role required to perform the process is also specified.
Table 5 shows how the interaction notation is enriched, in order to provide more information for the analysis and evaluation of the interaction scenario. Although in the table this visual information is deployed over a human actor node, the same representation applies for the other types of nodes.
4.2. Generation of a RI Graph Using CIMoN
The generation of a RI graph involves the five steps shown in the
Table 6. First of all we have to specify the roles (nodes) involved in the collaboration process and their type. The second step involves to identify and represent both, the interactions between nodes (i.e., the relationships) and the stability of the communication link between them. Third, the types of interaction to be supported (i.e., synchronous, asynchronous, or both) are specified based on the interaction needs (user requirements). Fourth, the availability of nodes involved in synchronous interactions is identified based on user restrictions, if present. Finally, the mandatory roles and their minimal number of participants for these roles are specified.
Next section presents an application example that illustrates how to use the proposed notation, based on the model of a particular interaction scenario.
4.3. Application Example
In order to exemplify the use of the proposed notation, let us consider an interaction scenario of firefighters conducting search and rescue operations during an urban emergency, such as a fire or building collapse. The example is based in the emergency scenario described in [
14], where the corresponding RI graph is represented using the MCM notation.
Typically, in these urban emergency scenarios the response activities are led by firefighters, and according to the response protocol (due to backup reasons) it is required the participation of at least two different firefighting teams. These teams are usually coordinated through radio-based interactions by an
incident commander that is in charge of all operations. In the example shown in [
14] people playing key roles additionally use mobile devices, a mobile ad hoc communication network (MANET) and a collaborative system to support the interactions and coordinate activities among them. The use of such a collaborative system is required since firefighter usually have only two or three radio channels to coordinate the activities, which is clearly not enough [
18].
Every firefighting team is led by a team captain that coordinates the activities of its members through face-to-face communication. The captain interacts through radio messages with the incident commander and shares information with others key participants (roles) through an intermediary node. This latter component is a server located in the command post, that is where the incident commander in located.
The dispatch center, medical personnel, logistic and entry control are roles supporting the relief activities, but the response process itself is conducted by the teams leaded by the captains and coordinated by the incident commander. The dispatch center is represented by the operators working at the emergency center, who address some particular requests of the incident commander when required (e.g., to obtain extra resources or police support). Logistics is the team in charge of managing the shared resources used to respond to the emergency. This operation area is usually implemented only in medium-sized or large emergencies, and they work in the field, but out of the risk area, the same as the medical personnel and the entry control people. The medical personnel (typically paramedic) are in charge of providing first aids to victims and transporting them to health centers. When this role is not present, such an activity is performed by firefighters. The entry control role is played by one or two persons that are in charge of recording information about each firefighter entering or leaving the affected area. This role is usually present in recovery processes (i.e., the activities performed a week after a natural disaster) more than in emergency responses.
In this scenario there are two main decision makers: the incident commander and the team captains. The former makes the global decisions and the latter make the local ones (that concern their teams). In order to conduct such an activity, both roles are supported with information that they can retrieve from the local server (i.e., the intermediary node). However, and following the proposal of Suarez et al. [
19], it is possible to improve such a process providing recommendations and awareness information to the decision makers. In this example we consider the participation of a software agent named
awareness provider that uses the information stored in the intermediary node, and also a set of local rules, in order to deliver notifications, recommendations and awareness information to devices used by decision makers.
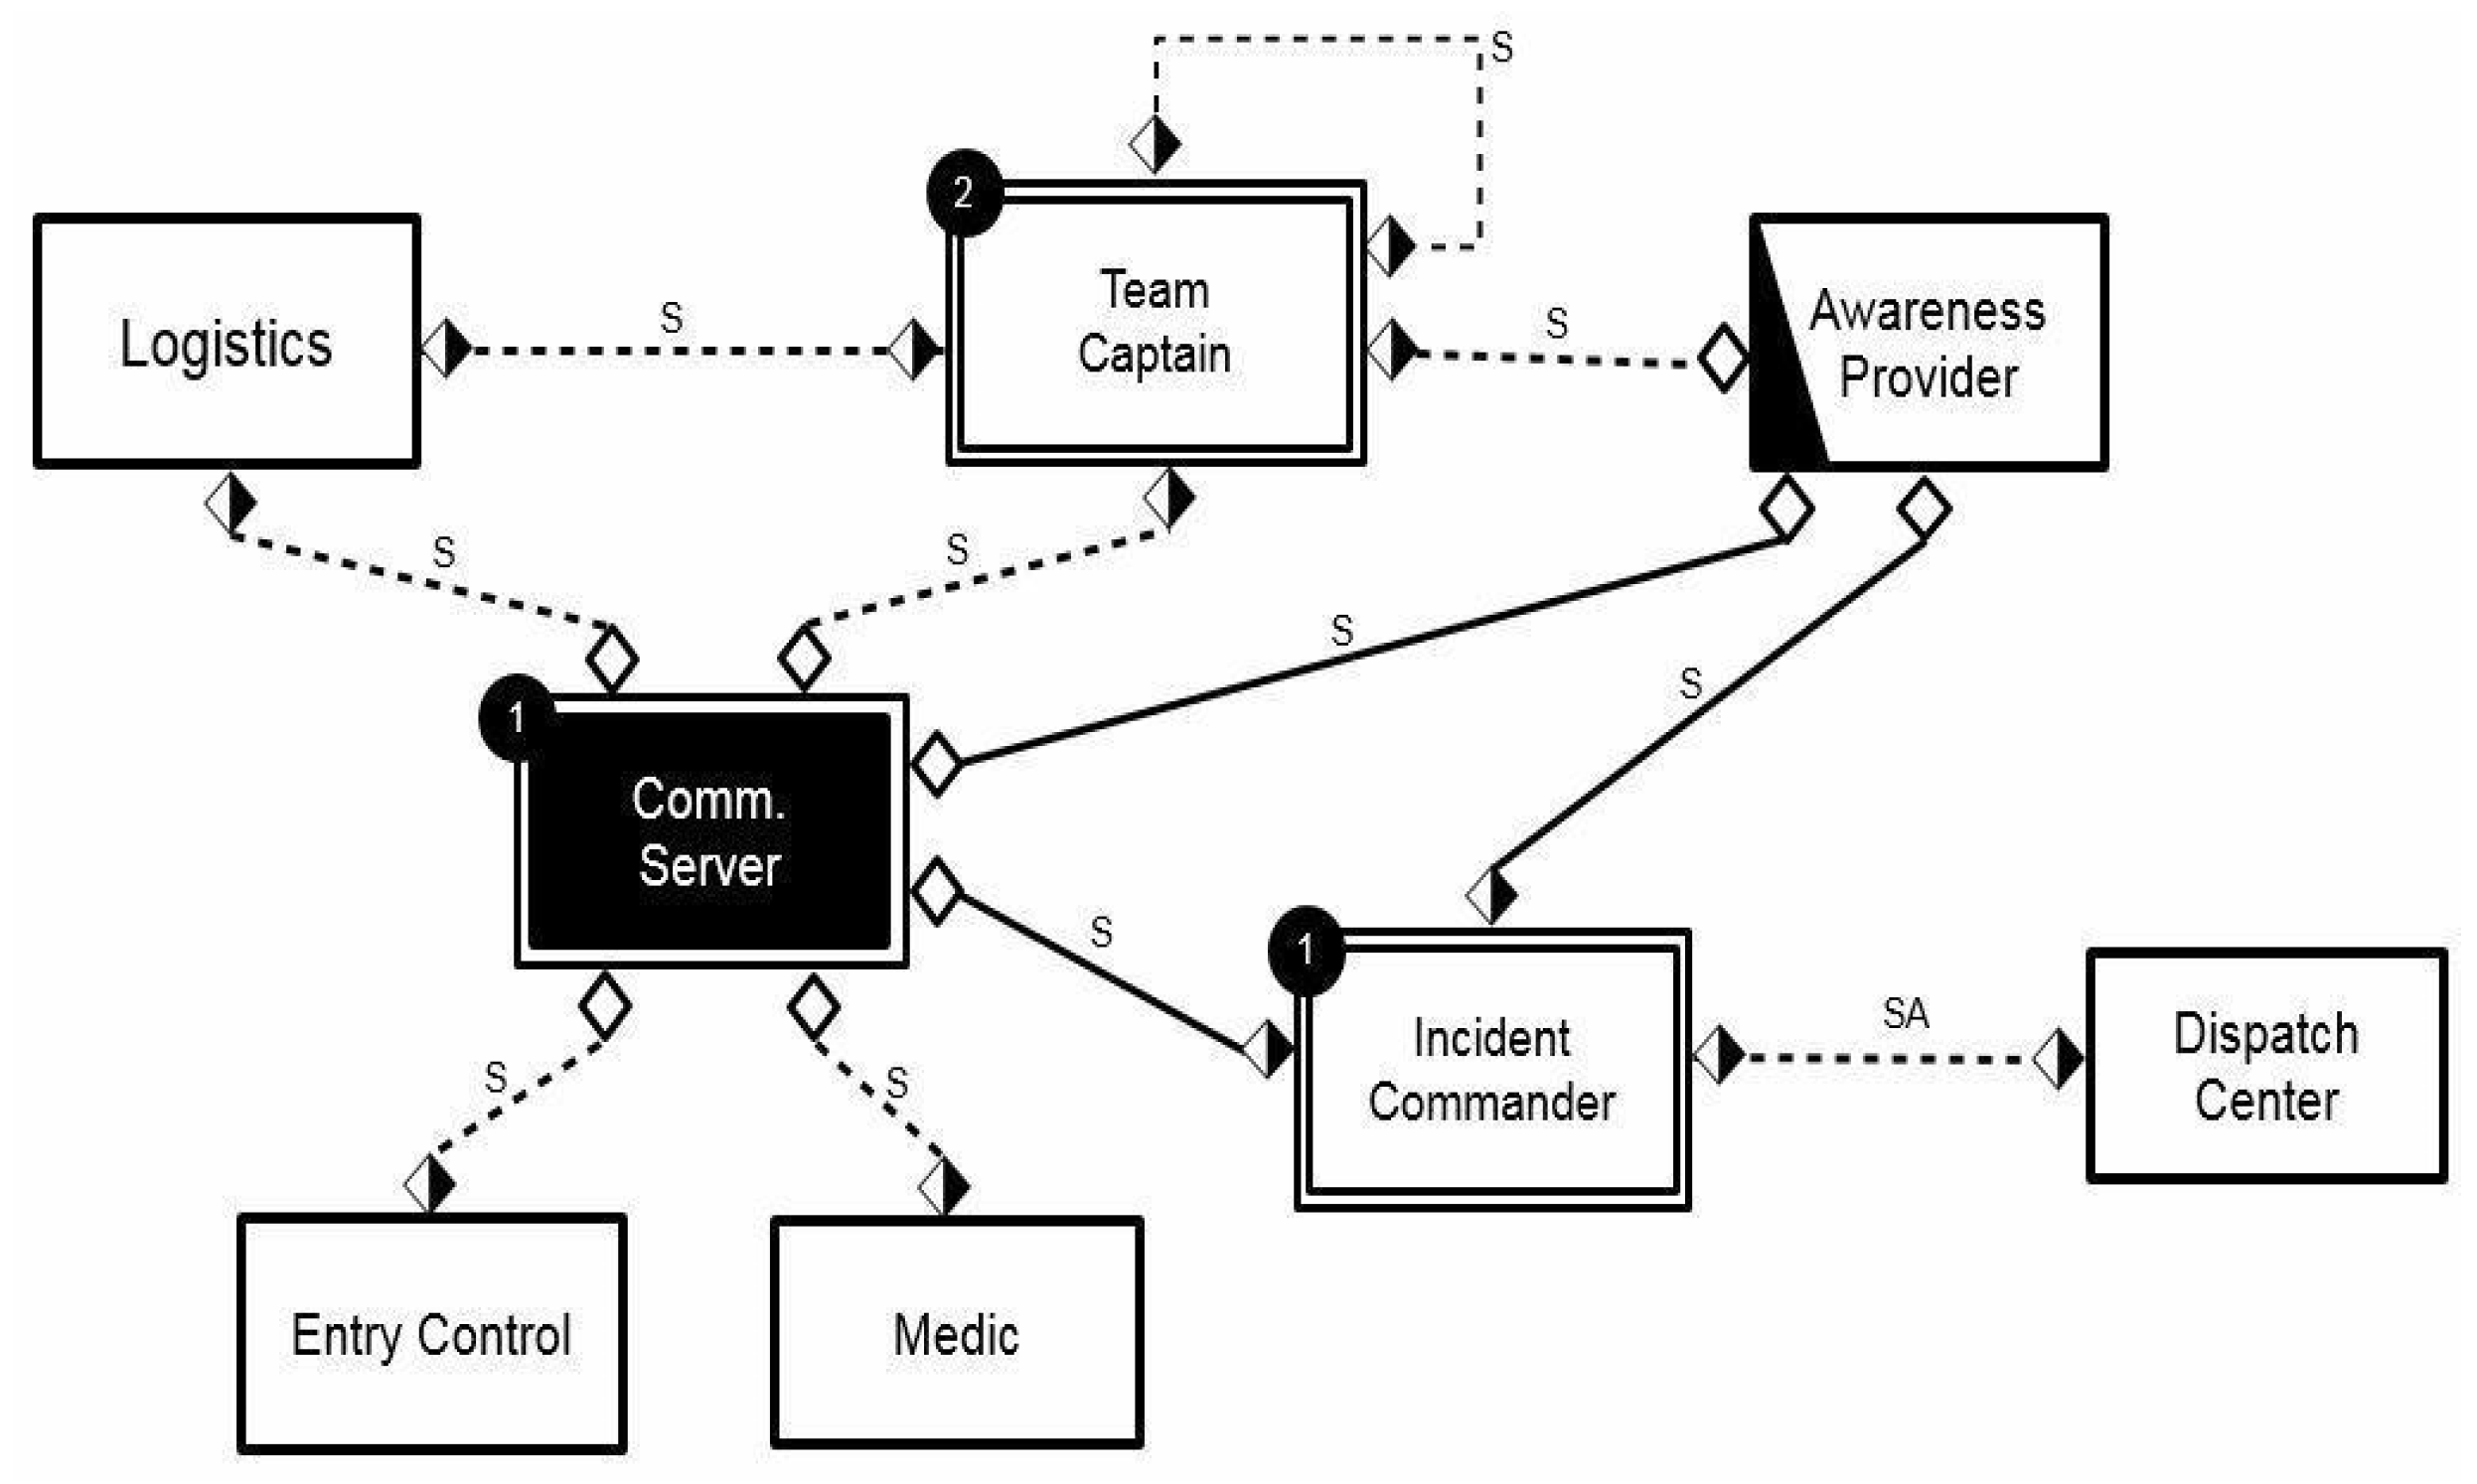
Figure 1 shows the RI graph representing the interaction scenarios among roles according to the above description.
The nodes in
Figure 1 corresponds to each participating role and the edges represent the type of link and interaction requirements between them. For instance, team captains are human actors that need to interact synchronously among them. All computer-mediated interactions among most human actors are synchronous and conducted through the intermediary node. The RI graph also shows that there are only three mandatory roles, i.e., incident commander, team captain and communication server, and the minimum number of actors that should play these roles.
Concerning the roles availability, the communication server (the intermediary) is always available for the requests of others participants in its interactions, while the remaining participants are sometimes available. These availability requirements should be translated into application features that alert each participant (in a synchronous interaction) whenever other participants are available. Moreover, the interaction model also indicates that team captains can deliver notifications to other captains only if they are simultaneously available, because the communication between them only can be synchronous. However, the communication link between them is unstable, therefore when one captain intends to interact with other, the second one could be unreachable.
The interaction between logistics and team captains represents a case similar to the previous one. These issues represent clear limitations for supporting the interactions considered in the model, and improvement opportunities for the supporting system. These limitations can be informed automatically by a software application that analyzes and evaluates the graph at design time, because as mentioned before, the interaction model representation is computable. Thus, the system design can be updated incrementally according to the results of the model evaluation process.
5. Evaluation of the CIMoN Notation
In order to identify the understandability and expressiveness of the proposed notation, we conducted a pilot study that was comparative, summative and test-oriented. Next sections present the participants, describe the experiment and report the obtained results.
5.1. Description of Participants
Sixteen people were involved in this study, twelve were students enrolled in the doctorate program in computer science delivered by the Computer Science Department of the University of Chile, two participants were undergraduate students and two professors of such a Department. All participants were knowledgeable in visual modeling and processes representations, and they were recruited through an invitation delivered by the authors of this work.
5.2. Experiment Description
At the beginning of the evaluation process the participants were instructed about the foundations and representations of interaction models in MCM and CIMoN notations. Then, the visual representation for storytelling proposed by Antunes et al. [
20] was used as an instrument to describe a simplified version of a collaborative process already known by the participants.
After introducing the process to be modeled, every participant received a form were he/she had to specify the process, through a RI graph, using the MCM and the CIMoN notations. In order to reduce the learning bias, half of the participants started using MCM and the other half started with CIMoN. All forms included a numeric ID that was unique for each participant, who also indicated the beginning and ending time of their modeling activity using each notation. The participants identified between eight and ten different interaction scenarios.
After modeling the process using both notations, the participants filled a questionnaire to gather information about the understandability and expressiveness of both notations. Finally, the models specified by the participants (i.e., the RI graphs) were compared to a rubric to determine their correctness, and based on it, a score was assigned to each model. These scores ranged from 1 to 5: (1) very poor, (2) poor, (3) acceptable, (4) good, and (5) very good. Such information was also used in the comparison of both notations. Next section presents the questionnaire filled by the participants and explains its evaluation scale.
5.3. Evaluation Questionnaire
The approach used to evaluate the usability of both notations was based on the use of attributes and associated to key measures derived from the goal-question-metric paradigm [
21]. The questionnaire considered six items to evaluate the usability of each language and compare both notations. It included items drawn from the identified key measures showed in
Table 7.
5.4. Evaluation Results
As shown in
Table 8, the models represented by the participants using both notations were at least acceptable and quite similar in term of quality. The average time spent to carry out the modeling with CIMoN was a little bit over the time required to represent the model using MCM. These numbers can be explained due to the participants required more time to represent additional information about availability of nodes when used the CIMoN notation. The results also shown that the mistakes made by the participants were almost recurrent in both representations, i.e., if the participant was wrong in representing an issue using the first notation, then he/she was wrong in representing the same issue using the second notation.
Concerning the answers gathered from the item 1 (regarding to the “
effectiveness” of the notation,
Table 7), five designers (four participants that used MCM, and one that used CIMoN) indicated that the notations were not expressive enough to represent their intention. Such a perception was confirmed by the participants after concluding the test. Despite this answer, the correctness of the models specified by the participants was evaluated from “acceptable” to “very good”. Three participants acknowledged the expressiveness of CIMoN.
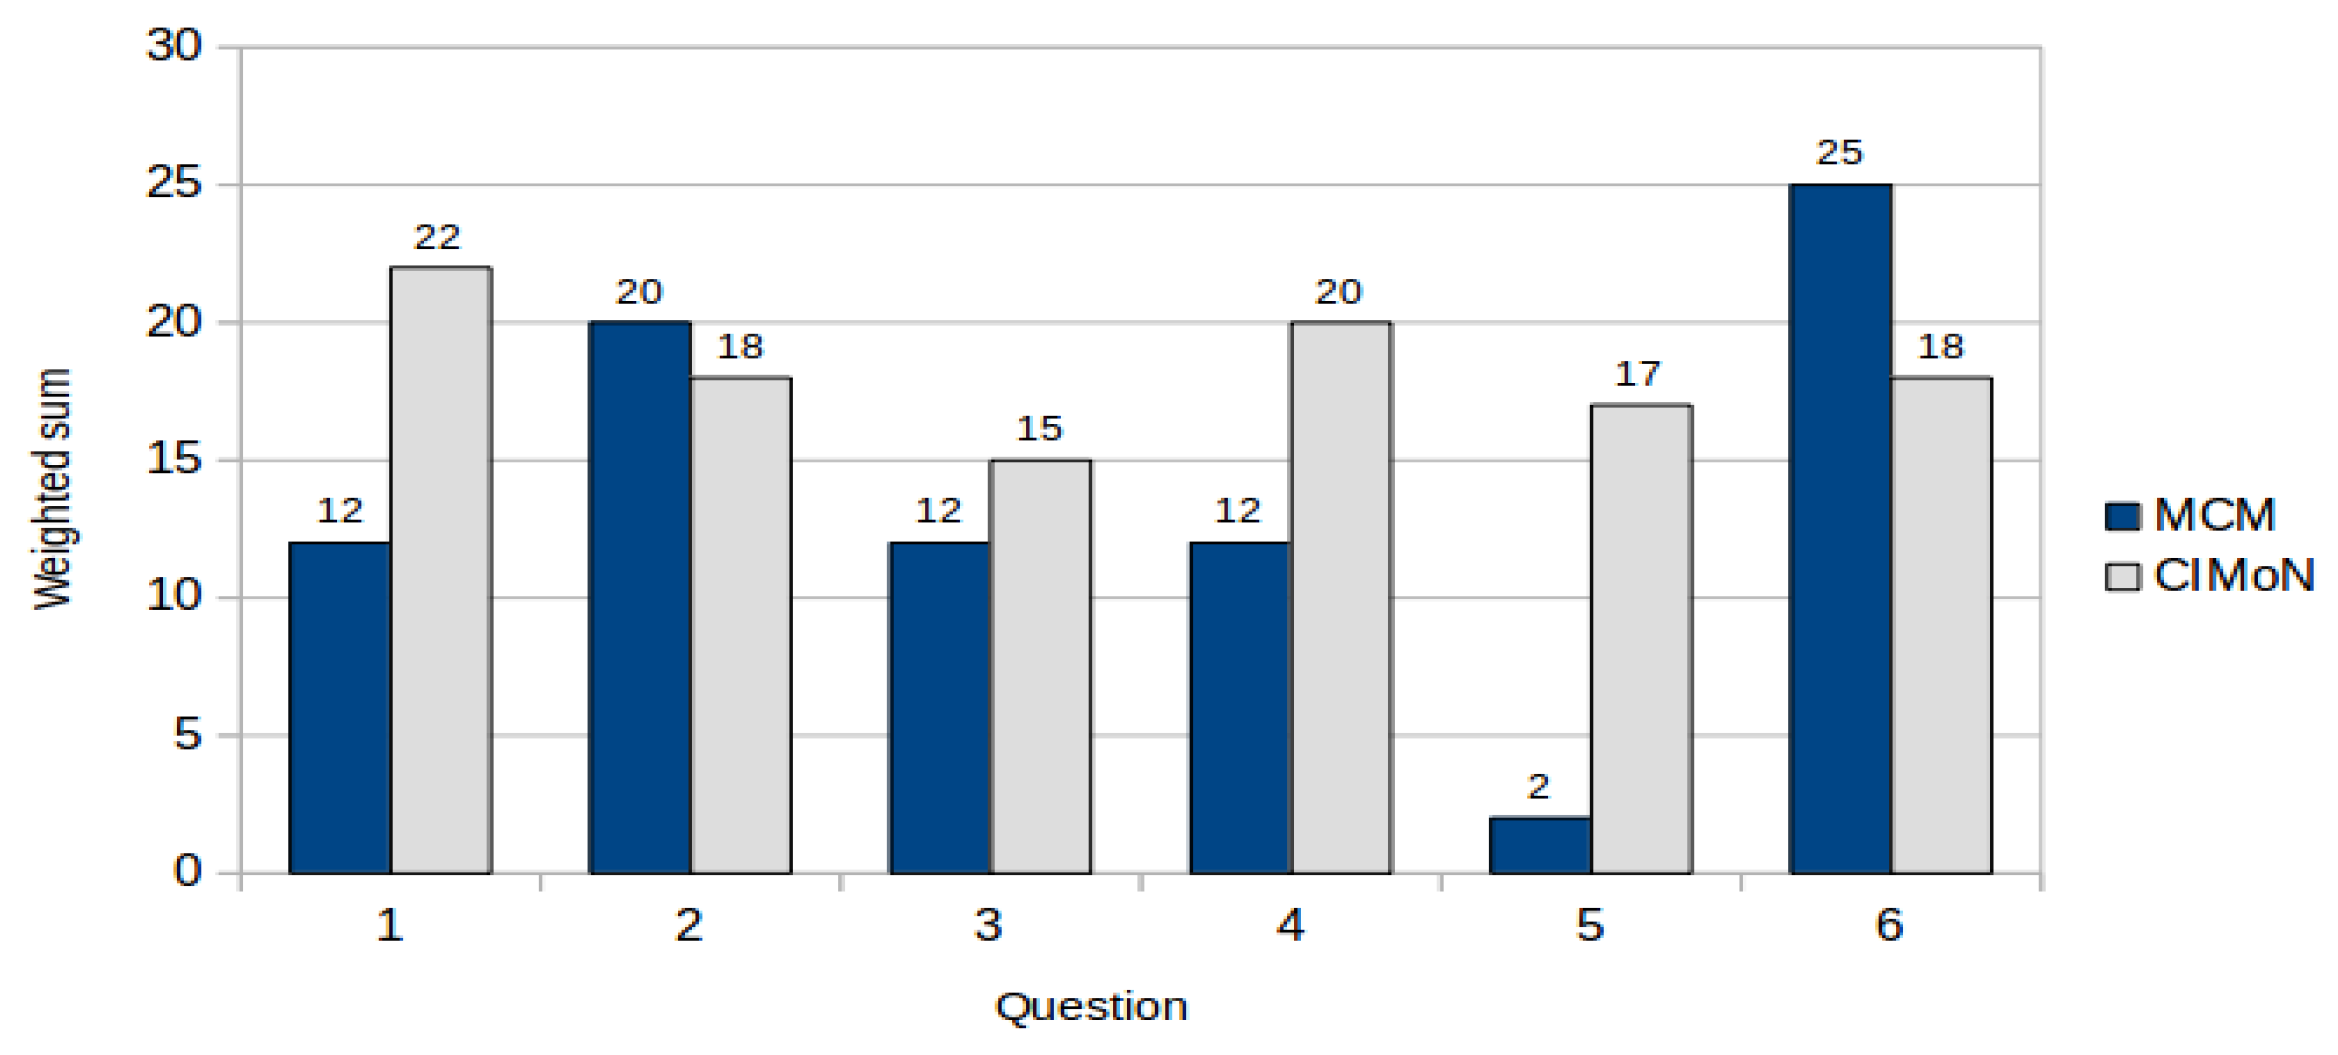
In order to make comparable results obtained for both notations, the weighted sum of the results was calculated for each item of the questionnaire, considering: −2: strongly disagree, −1: disagree, 1: agree, and 2: strongly agree, as recommended in [
22]. The weighted sums for both notations (MCM and CIMoN) are shown in
Figure 2.
Regarding to the goals “effectiveness” of the notation (item 1) and “terminology” (item 4), we can note a significant advantage of the CIMoN notation over MCM, whereas the results were acceptable and very similar for both notations for the goal “aesthetic appearance” (items 2 and 3).
Furthermore, an important difference in favor of CIMoN was identified in the “intuitiveness” (item 5); however, in terms of “learnability” (item 6) MCM was better than CIMoN. This last result can be explained because CIMoN representation includes more elements than MCM, which make it a bit more difficult to learn, but much more expressive to represent interaction scenarios.
6. Analyzing the Expressiveness of the CIMoN Notation
In order to compare the level of expressiveness of both notations,
Table 9 presents the equivalence of concept (if any) in both representations.
Regarding to the nodes types, we note that CIMoN has one additional type with respect to MCM. That seems to be not necessary, however this representation gives designers valuable information to model autonomous services that can be required (or be helpful) to support the collaboration process. Concerning the representation of link types, both notations specify different information, i.e., MCM represents reachability of the nodes, whereas CIMoN specifies stability of the communication channel. Although one concept is close to the other, the evaluation results shown in the previous section suggest the link representations of CIMoN are easier to understand for the potential users (i.e., the collaborative system designers).
Furthermore, note that only CIMoN is able to represent some modeling aspects, such as availability, roles criticality and the minimum number of participants for mandatory roles. Representing these aspects in a collaborative process specification is not only valuable, but also required to then derive the software requirements related to the groupware support provided the system. For instance, knowing the availability of a certain actor can help implement awareness mechanism to represent this information to other participants. Similarly, knowing if a role is critical can help determine if a certain activity can be done or not in a certain time instant.
On the other hand, the CIMoN notation differentiates the interactions between end-users from those conducted between the computing devices they use. This also add important information to design applications supporting particular people-driven collaborative processes.
7. Conclusions and Future Work
This paper has shown the limitations that modeling languages reported in the literature have to represent computer-mediated user interactions in ubiquitous collaborative systems. The most suitable proposals to represent these scenarios seems to be the MCM notation [
14] and its extension to address IoT settings [
9]. However, both notations were conceived to model collaborative processes in a particular application domain, therefore they are limited to model people-driven processes out of those domains. In order to find a solution that helps model the interaction scenarios in a more complete and domain independent way, this paper proposes the CIMoN notation to allow software engineers to inform the design of ubiquitous collaborative systems.
The usability and expressiveness of CIMoN was evaluated in two different instances, and the results were compared with those obtained from using MCM. The new proposal shown to be more usable and expressive than MCM. These results should be confirmed by performing more experiments that is part of the future work.
Given that these processes involve several modeling aspects that can be managed in background and thus avoid overwhelming the designers, we hypothesize that a modeling tool that implements the CIMoN notation could help practitioners to make more feasible these processes representation, and thus to inform the analysis and design of the supporting systems in a better way. Among the features to be included in his visual modeling application, which will take advance of the capabilities of the proposed notation, are the following:
Model analysis. The tool will be able to automatically evaluate the created models to detect general design flaws.
Representation of interactions among three or more actors. The tool will allow the users to establish relationship among three or more actors, keeping the validity of the mechanisms used to evaluate the RI graphs.
Generation of the complete model from a set of simple interaction models. The tool will also allow to generate a complete interaction model by composing simple models (small representations) generated by the designers.
This notation represents a first step towards the building of a modeling language to specify people-driven processes, and the user interaction scenarios involved in it. Thus, the language will help software engineers inform the analysis and design of the ubiquitous collaborative systems that support to these processes.


