1. Introduction
Nowadays, citizen security plays an important role in national and regional governments in every country around the world; it is explained by the increase of violence which has been exponential these last years. Citizen security is defined as the process to safeguard, maintain, and enforce democratic civil order, eliminating violence threats in the population and giving a secure and pacific co-existence between citizens. This explains why citizen security is not oriented solely to the reduction of offenses, but, to develop dynamic and efficient strategies to improve the quality of life of the population, meaning a communitarian action in order to prevent criminality. Nowadays, more than 1.500 million of people live in countries with a high index of violence and conflicts or alarming levels of criminality, and more than 526,000 people die in a violent form per year, it means some more than one person per minute [
1].
This situation at world level has demanded to the scientific community to work and generate multiple solutions to fight against violence in many different countries. There has been developed surveillance systems and technologic patrolling, which gives to police and citizen security agents the information about the crimes realized in critical points of the city. With these systems is intended to provide tools to maintain a low criminal percentage in a continuous form.
There are many articles related to intelligent patrolling and the use of mobile devices for transportation. As it is the one developed by Singh [
2], where is presented a detection and crowdsourcing model with the application of smartphones to identify the conditions of road’s surfaces. Sensors incorporated into smartphones such as accelerometer and GPS has been used to observe the road’s conditions. The objective of this study was to improve the precision of the classification to detect the conditions of the road’s surface using DTW, which is a technique that has not been researched, in data based on movements’ sensors. This article gives a precision and efficiency for the detection of the 88.66% and 88.89% for potholes and bumps respectively. There was realized a comparison with other existent techniques where it has been checked that the study’s performance is optimal and showed excellent results.
The study realized by Nayan [
3], presented a model for traffic optimization and regulation, as well as buses routes’ transportation within the city. The generation of optimal routes is transformed on a linear program of mixed wholes (MILP) through the use of linearization techniques. This technique guarantees a global optimization of the proposed solution. After this, tests on a transit real net were realized to evaluate the validity of the model. This proposal has obtained acceptable results and has been taken as an option for transportation routes within a city with a high effectiveness rate.
The work presented by Lorintiu [
4], has focused on the mode of transportation applying a method to automatically classify different transportation modes with a smartphone. This method was designed with real information on the routes of transportation. The study presented an optimal result in near performance to 94% when classifying 7 different modes with the technique of random forest. Also, parallel to it, it was implemented a statistical model applying Markov’s hidden networks (DHMM) and, on the other hand, the utilization of GPS evidenced a performance improvement of 2%.
The research conducted by Su [
5], proposes a system based on GPS and network connections to detect a traveler’s mode of transportation using mobile phone’s sensors. The application is based on an Android platform with multimodality sensors. The system applies an online learning classification model. This model has reached near to 100% of precision on a binary classification in every type of journey on wheels, and in the rest of journeys (buses, metro, automobiles, bicycles, jogging or walking) with an average precision of 97.1%. The application allows adapting to each behavioral patron of the user utilizing the model of learning online. The resultant performance in tests is a lot faster in comparison with others off-line.
Another study developed by Garg [
6], presents a system based on mobile phones’ sensors to classify vehicles that travel on roads in four categories such as bicycles (two wheels), auto-rickshaws of three wheels, vehicles of four wheels and public transportations such as buses. This model has utilized the characteristics of detection of smart sensors. In this model data of a traveler’s journey as well as time estimation, the detection of driving behavior, the classification of traffic state and monitoring of road’s surfaces are analyzed. This study contributed with important information about the design and implementation of applications based on the characteristics and requirements of traffic from a region in development. The result of the application has obtained a precision higher than 90% in classifying. Tests of the model have been conducted in a variety of stretches of highways of 1500 kilometers of conduction data in the city of Delhi in India.
The present work focused on the analysis of data of reported offenses in Ecuador’s National Police in the period comprehend among the yeas 2014 and 2018, in order to develop a model of dynamic routes for intelligent police patrolling in a mobile application with an Android operative system. In this paper, it is proposed an adaptive model of critical points applying the technique of classification K-means, as well as the application of the API for routes drawn from Google Maps for police agents with critical points identified by the previous model. The development of intelligent routes based on the history of activities is a complex task and very applicative, which has been largely studied and developed on computer’s science area, because of this, it will be addressed in the present work.
The present article is structured as follows, in the section number 2 method and materials used in the study are presented, the description of the data base PoliciaEC is also presented, as wells as the artificial intelligence technique and API from google to develop routes are presented in detail. Section number 3 details the proposed model, developing multiple prototypes to identify the problematic. In section number 4, results are presented obtaining the precision and performance of the data gathering and the generation of routes for patrolling. In section number 5, obtained conclusions from the study are presented and future research is mentioned.
2. Method and Materials
In this section is presented in detail the dataset “PoliciaEc” used to the development of the model, as well as the artificial intelligence techniques, and API from Google that were applied.
2.1. Description of Dataset PoliciaEC
For this article, a collection of information given by Ecuador’s National Police called “PoliciaEc” was used. This data gathers the information about offenses executed between the years 2014 and 2018 divided by circuits. Circuits from where the information was collected are the most conflictive ones of the country and with the highest rate of offenses reported. This information is detailed and exact when reporting an offense that has been committed, geographic location (latitude and longitude), date and hour, type of offense and generic characteristics of the victim. In
Table 1 is presented a sample of the information from the data collected for this study.
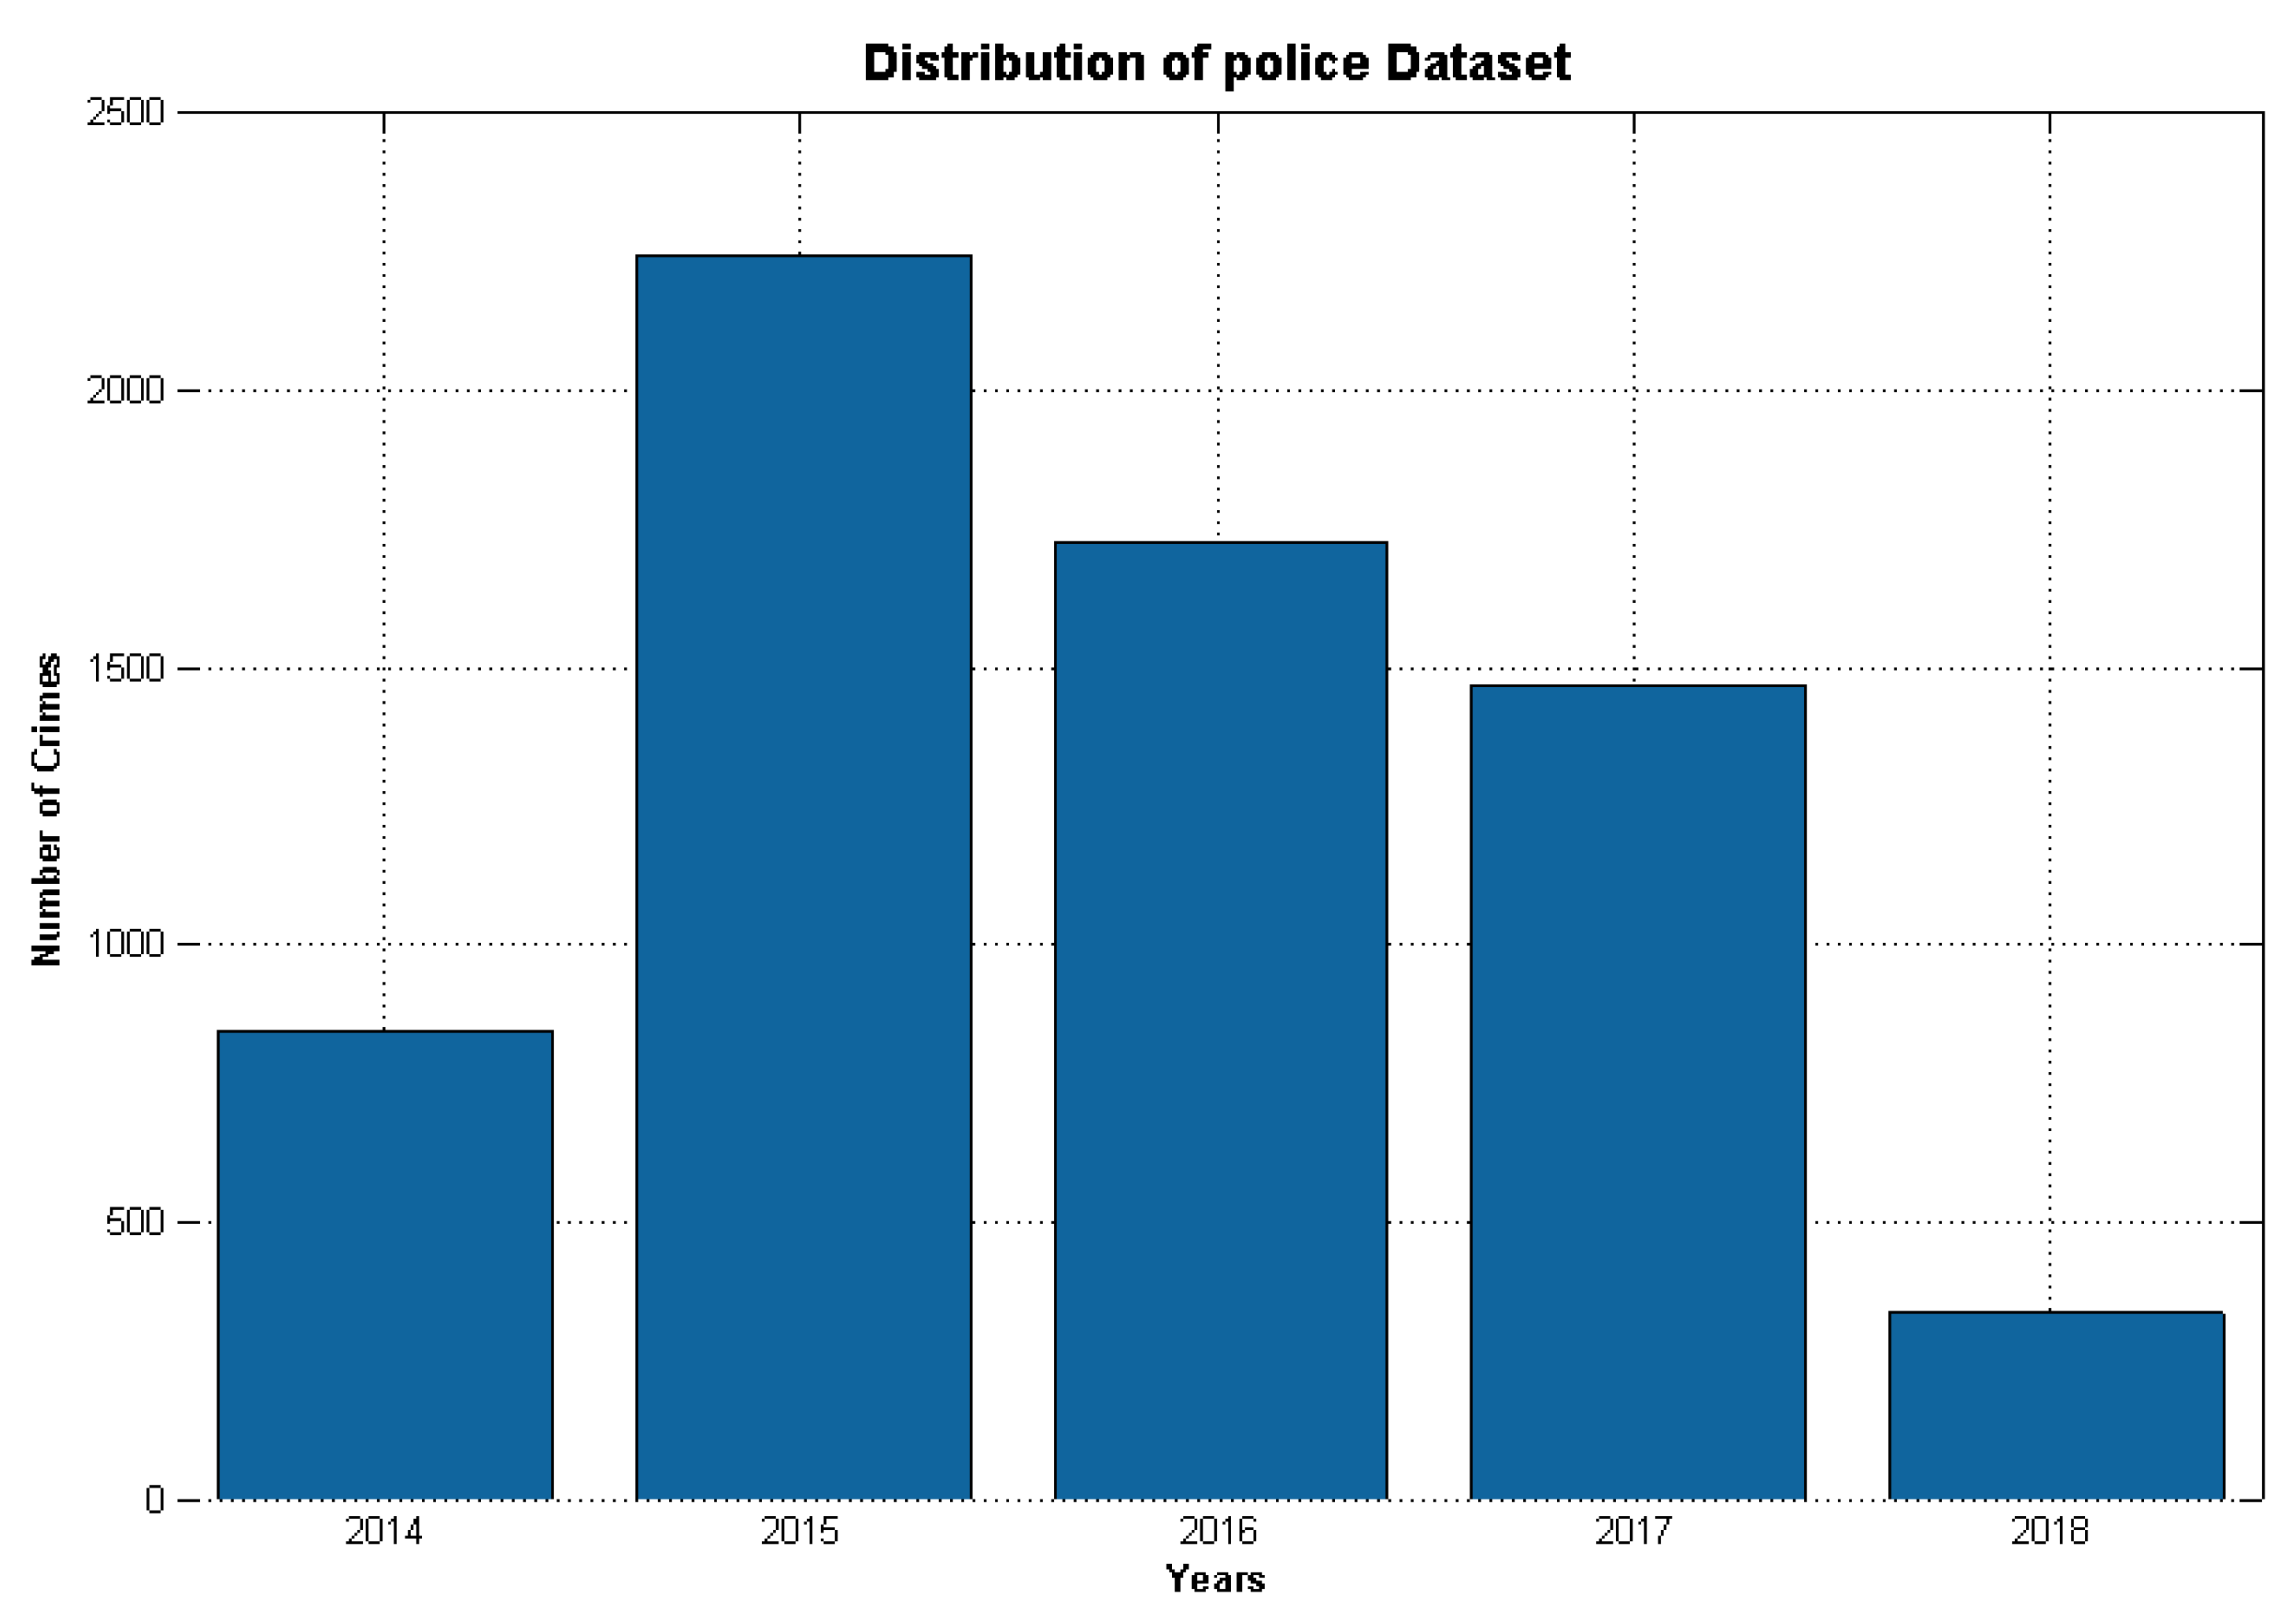
This dataset counted with 6605 registrations in a period of 4 years, where offenses were registered during 24 h a day and 365 days of the year. On
Figure 1, is presented the distribution of the data for the years 2014 to 2018.
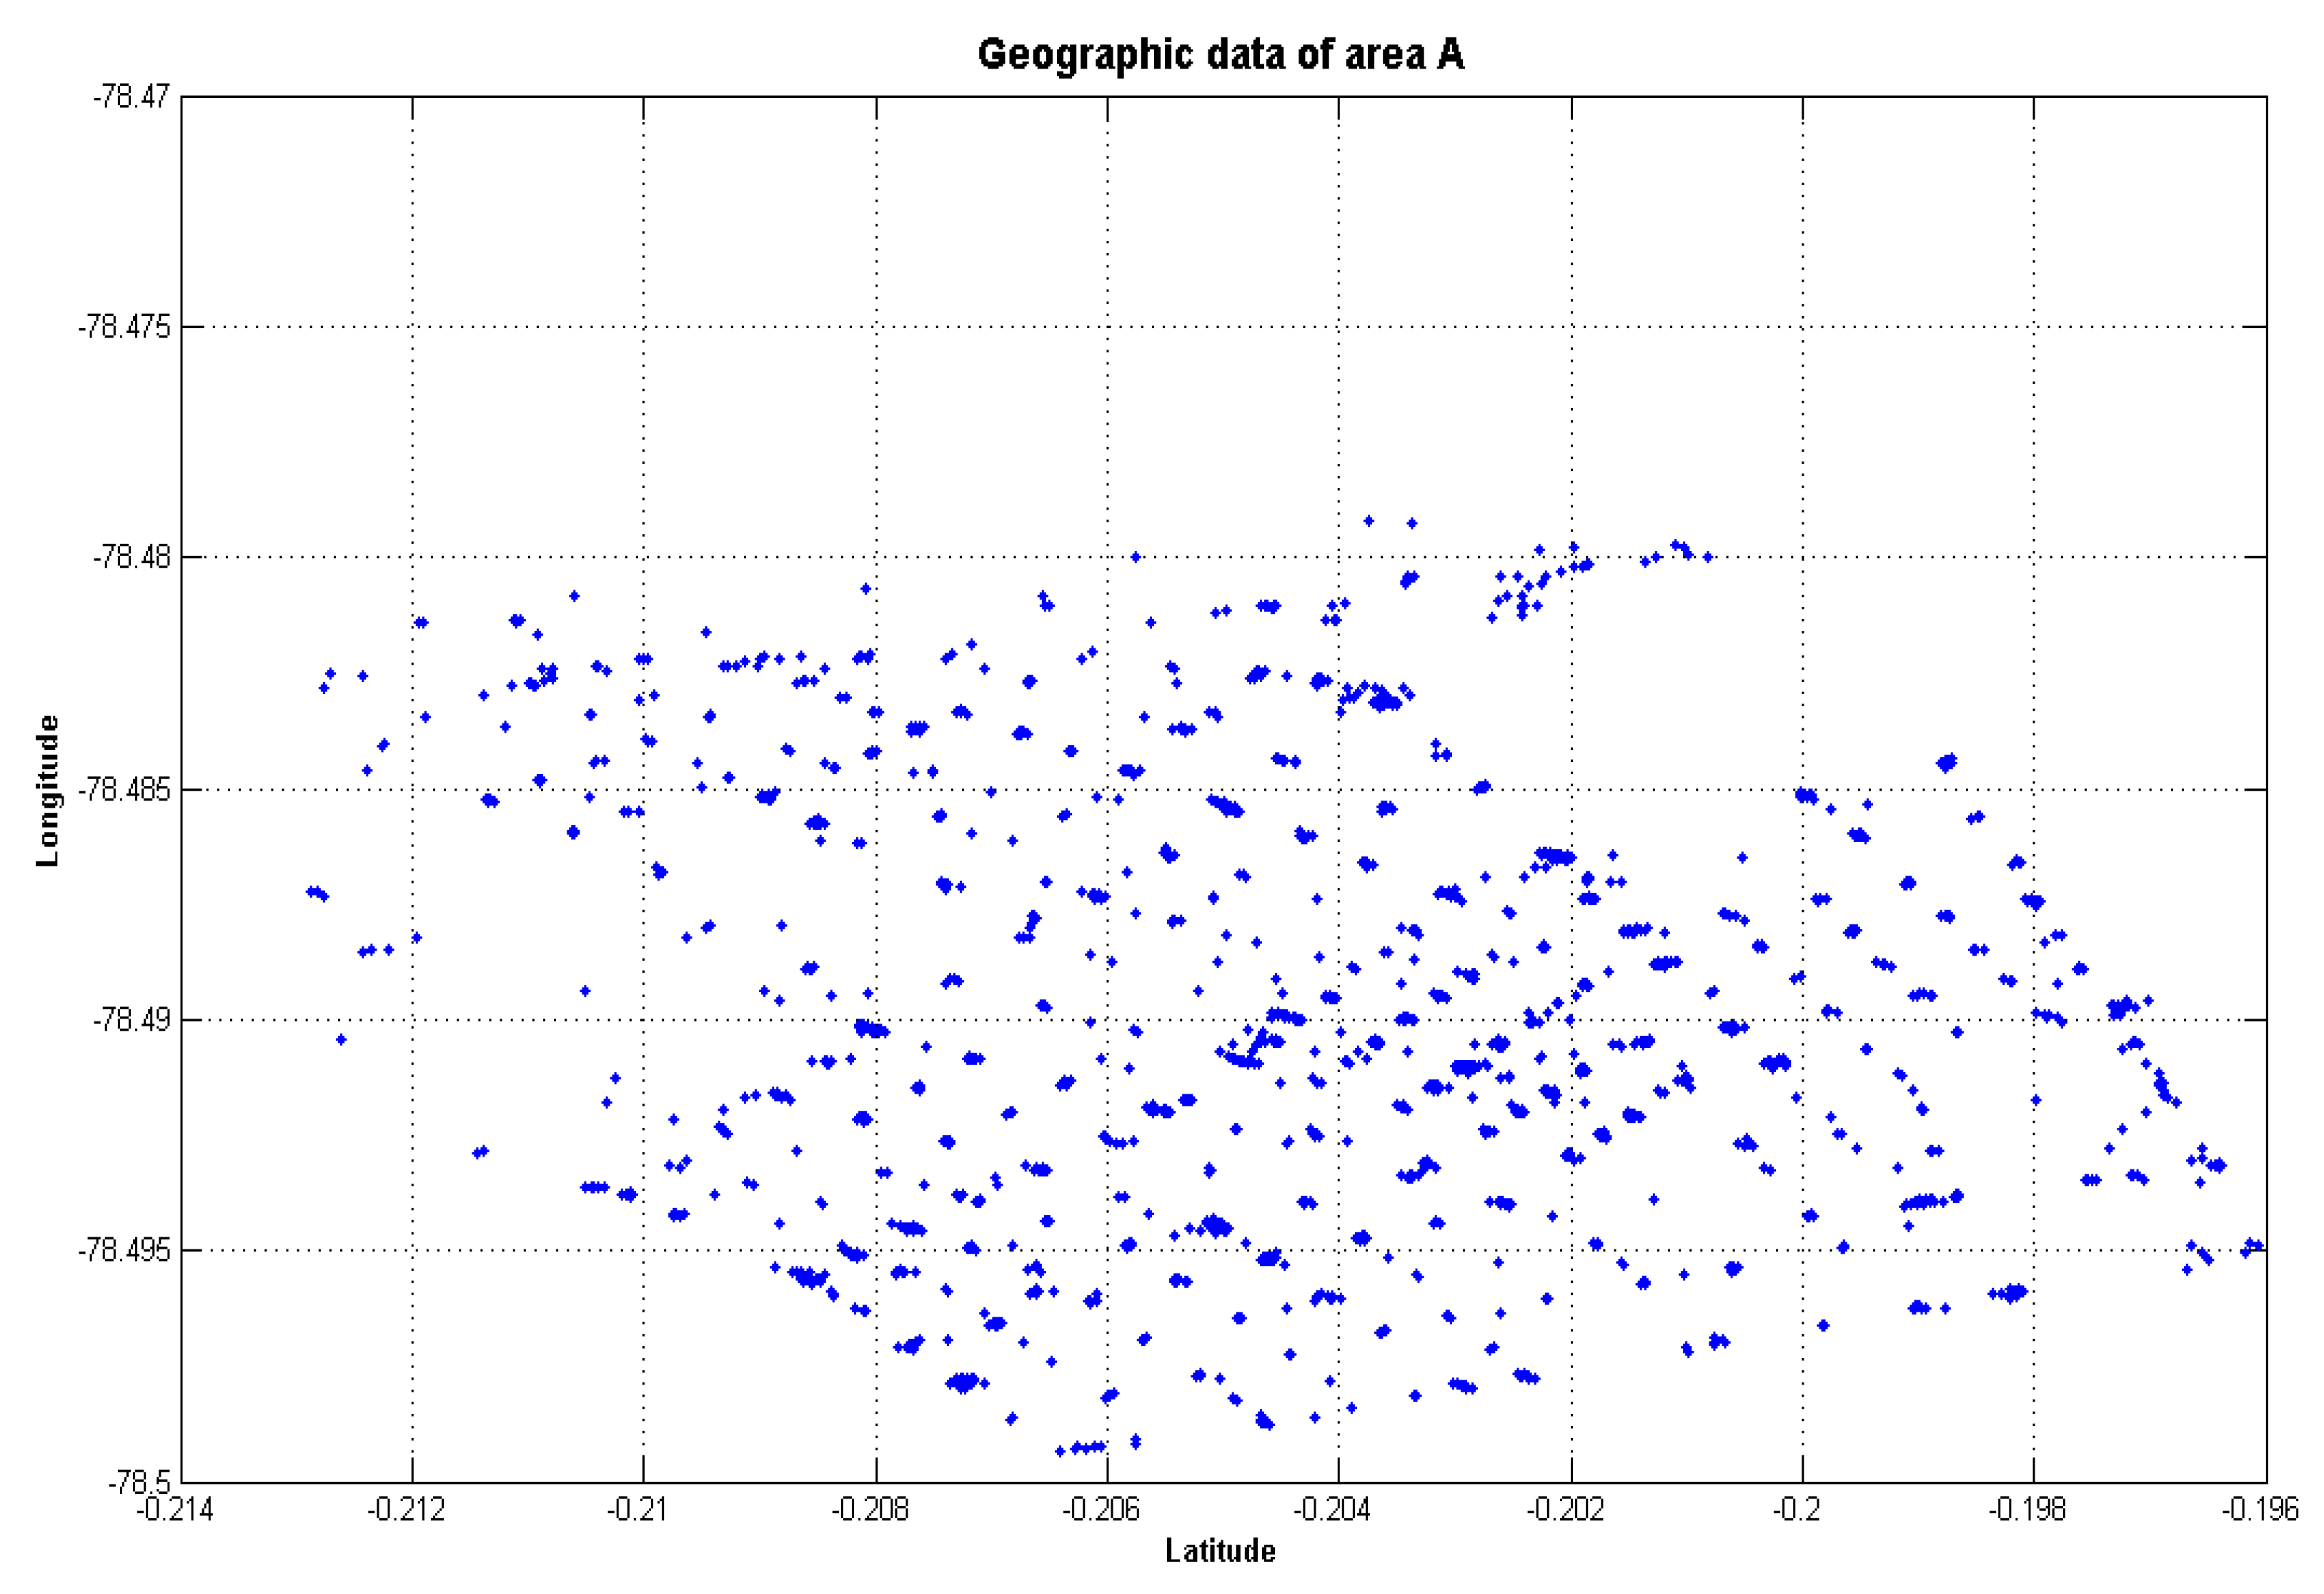
Using this dataset, it was proposed to develop an algorithm that allowed the creation of a route of the dynamic patrolling. This route must cover in an efficient way most of the area of the circuit (territorial distribution
Figure 2) where offenses have been reported. On the other hand, these routes must vary according to the time of the day.
Our study focused on gathering the parishes which are part of a circuit, with an extension of 5 km2 and goes until 5000 people. Ecuador counts with 1134 circuits, which are conformed by 2028 sub-circuits with an approximate extension of 1 km2 from 5000 to 10,000 people.
Figure 3,
Figure 4 and
Figure 5 show the distribution of geographic data per each circuit. This allows identifying in a better way where are the most conflictive places, and, in the end, to be able to design an efficient patrolling model.
2.2. Artificial Intelligence Techniques and application of API’s
In this section, it is described in detail each technique and algorithms applied in the proposal, such as K-means (cluster) and API from Google (geographic routes).
- (1)
K-means
It is an artificial intelligence technique that
realizes the gathering of data, which has as principal objective to divide a
number of n registers into a K number of groups, according to its most
approximate average value. This algorithm uses an iterative refinement technique,
which is called the K-means algorithm [7, 8]. The K-means algorithm uses an
initial set with K centroids defined as , where continues alternating between two steps:
The algorithm assigned each observation n into the group k with the most approximate average value, as it is presented in the equation that follows , where was gathered within or within two groups.
To calculate the centroids from the observations in the groups, it was applied the equation
K-means calculated groups of centroids in a variety of different forms to the different distance metrics admitted applying the Euclidian distance with the equation
The cluster K-means algorithm uses the heuristic, which is based on Lloyd’s algorithm, and it is implemented to a big amount of information. K-means is frequently used in a variety of areas such as vision through computers, geo-statistics, data astronomy, and data mining. This technique realizes data pre-process to other algorithms, for example, looking up for a configuration of initial information [
9].
- (2)
API from Google Maps for Android system.
This is a free tool designed by Google, which creates personalized maps to applications developed in Android system. This tool allows using a variety of geographic applications such as routes designing and points of reference, images of the environment (google street view) buildings on 3D, urban and fluvial planes, etc. The API administers and manages in an autonomous way the access to servers, data downloading, maps visualization and responses to maps’ resources. One of the advantages of this tool is using API calls to add markers, polygons, and superposition to a basic map, also, user’s view might be modified (changing a particular map’s area). These objects allow obtaining important information about locations on the map and allow the interaction between the user and this tool.
Within API exists the Google Maps Distance Matrix API, which is an application that provides trip’s distance and time according to a matrix made of geographical points of starting and destination. This route is generated between the start, intermediate points, and the end, looking for the most efficient route. This API uses Haversin’s formula, which is used to calculate the distance of the maximum circle among two points, it means, the shorter distance over Earth’s surface, giving a distance between the points. The equation is:
where the function is
. Where
is the distance between two points,
R is the spherical radio,
is the latitude of point 1,
is the latitude of point 2 and
is the longitudes differences [
10].
3. Proposed Model
The objective of the present work is to develop a model in order to generate routes of intelligent patrolling for Ecuadorian Police, based on the history of offenses executed in three circuits of the Ecuadorian territory. The proposed model applies artificial intelligence techniques such as K-means and the API from Google Maps, which allows obtaining a variety of dynamic routes with a high precision. This model provides a result based on the technique of applied classification, generating a sole solution for each circuit according to the police agent guard’s time, as it is showed in
Figure 6.
- (1)
Data Pre-Process
To develop the data model is necessary to realize a pre-process for the application of the clusters K-means. This process is executed in each geographic circuit eliminating inconsistent data, empty data, and noise in the information. To realize this task, not supervision filters were applied in order to eliminate repetitive instances and noises applying Weka software [
11,
12]. On the other hand, the information was organized according to the order in which it was reported, to evidence criminality’s evolution of each circuit. After this, a minable sight from each of the geographic circuits and agents’ orderly guard (periods of time of patrolling) that police agents must realize is generated. Police agents’ guards are defined in
Table 2.
For every circuit existed four patrolling routes in different schedules, the routes changed according to the offenses reported history information. In the following section, the model of critical points applying K-means with minable sight pre-processed is described.
- (2)
Model of critical points with K-means
The model to generate critical points (cluster’s centroids)
is based on the application of K-means algorithm into a minable sight
V of a circuit
, where
where
is the number of the circuit national wide. Also, each
was generated on each patrolling guard, where
, where
was the number of existent turns, it means
. The gathering of critical points is defined as
, where
was the number of clusters to be generated into a minable sight
. For the calculation of centroids it was necessary to apply the Equation (1) from Euclidian distance of
Section 2. Matlab tool was used for the application of k-means algorithm and the calculations of the centroids
, where a matrix with centroids data was obtained, as it is shown in the next code:
X ‘National Police Database’
k ‘number of centroids’
algorithm = ‘sqeuclidean’ ‘type of algorithm used in the function’
C = means(X, k, algorithm) ‘Function of calculation of centroids’ |
Depending on the quantity of reported information for each circuit , the quantity of registers in is , where the calculation of the number of cluster was generated by k-means algorithm is , where , it meant 1% of the registers of the sight .
From the minable sight only latitude and longitude data about offenses reported were used.
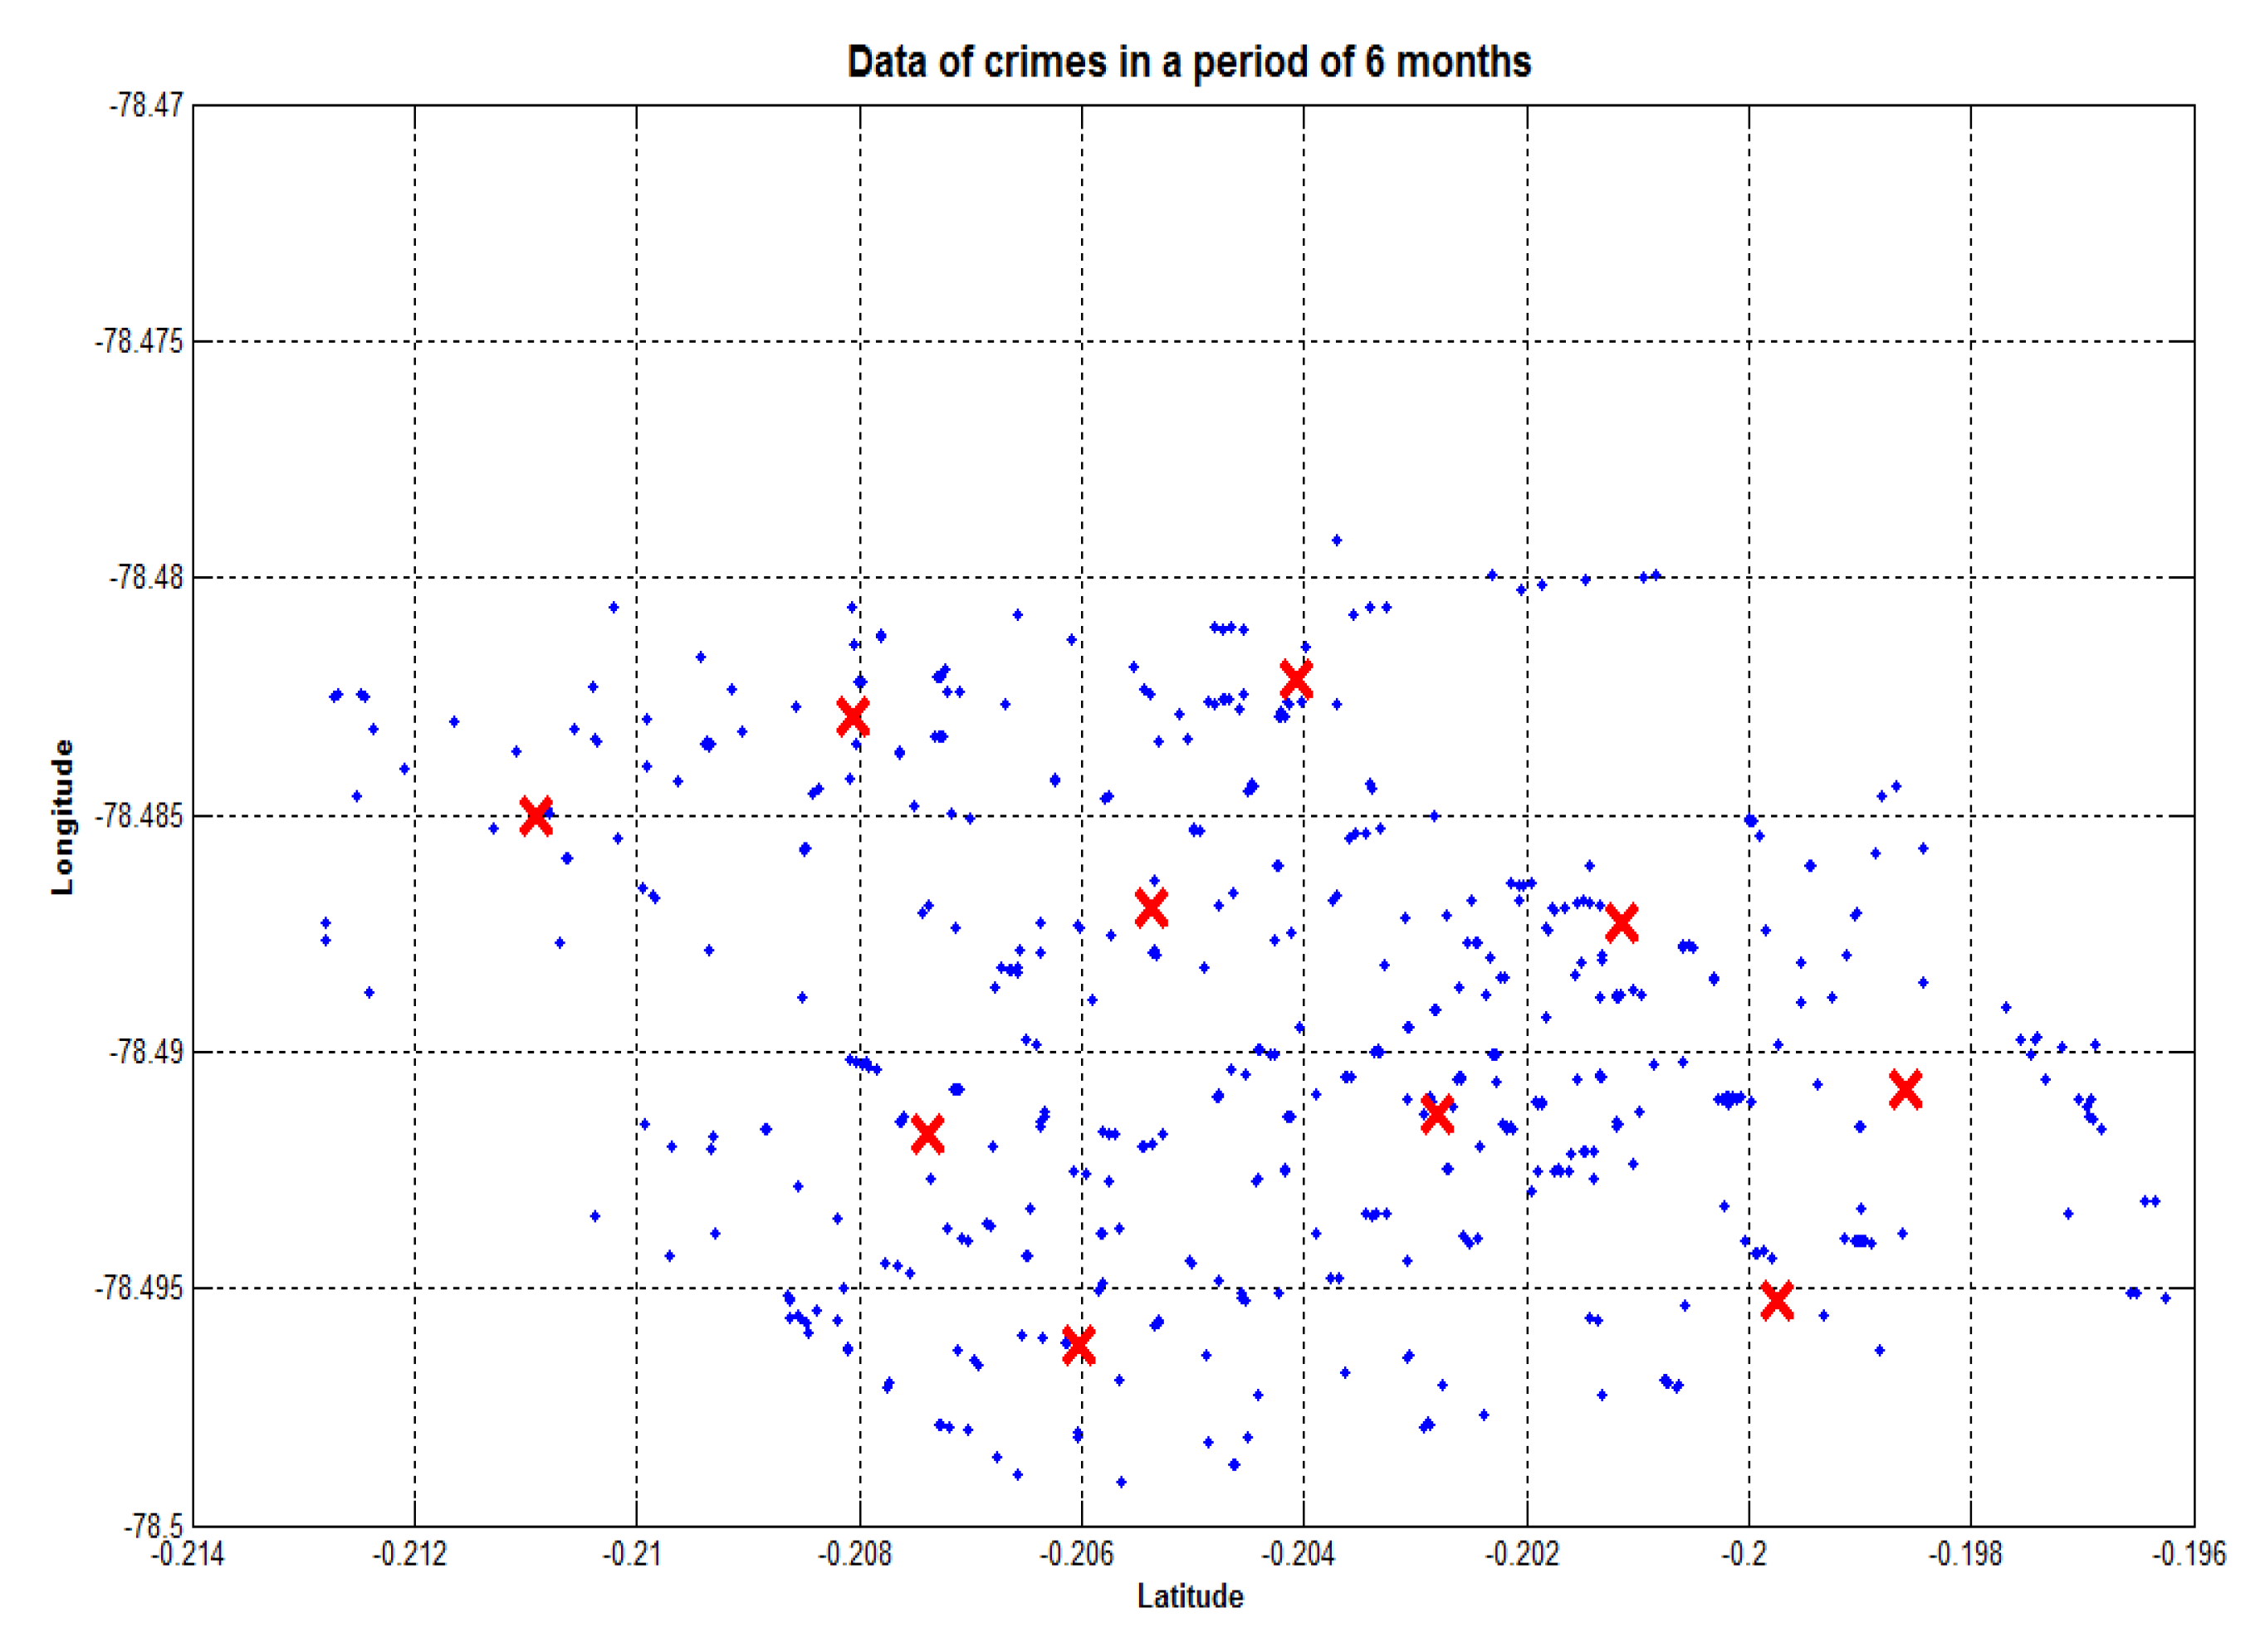
Algorithm training was realized using data with different periods of time, in order to evidence the optimal number of months for the proposed model. In this case, tests with 6, 3, and 2 months with each model were realized, as it is shown in the
Figure 7,
Figure 8 and
Figure 9.
As it was possible to evidence, the period of 6 months provided an adequate quantity of information to cover most of the field from each circuit to be patrolled. In the next section, the application of API by Google Maps to generate optimal routes will be detailed.
- (3)
API Google Maps application for patrolling routes
With the information provided by the critical points
of each circuit, the tool API from Google Maps was applied to identify the most optimal route to travel the
critical points. The application developed in Android was able to create dynamic routes which could travel for each of the points
, as it has been showed in
Figure 10. It has been applied in the Equation (2) to calculate efficient routes with intermediate points
.
In the next section, results of the proposed model are presented, as well as the effectiveness on the phase of testing both in precision and performance of the model.
4. Results
In the application of the proposed model, it was possible to evidence that data distribution was quite scattered. Besides, offenses reported in short periods of time such as 2 to 3 months did not proportionate useful information to generate critical points for patrolling routes design.
The presented model’s efficiency examination of this work consisted in supervised tests with three circuits that were realized during the last 6 months of the year 2018. This information was classified and tested, the technique k-fold was applied for training and algorithm testing. In this case, for our testing, a was used.
In
Table 3,
Table 4 and
Table 5 results of the classification with k-mean of the three circuits distributed in the four existent guards are presented.
In the application of the tool by Google Maps, it was possible to evidence that in the generation of the suggested routes patrolling time decreased in a 35% in comparison with the ones realized in a conventional form. It means that in the phase of testing the time was optimized and the circuit’s area was covered in a more efficient way.
In the next paragraph, a discussion of the results and conclusions obtained from this study are presented.
5. Conclusions and Future Work
In this work, the generation of dynamic routes to realize intelligent patrolling of Ecuadorian National Police for an Android application has been developed. This work uses information about the reported crimes on three circuits during a period of time of four years.
To identify the critical points of each circuit based on the history of reported crimes is an important task for citizen security. This task is used to develop dynamic routes for police patrolling. It was proved that realizing a pre-process of the information and then applying an artificial intelligence gathering technique called K-means, gave excellent results in classification, obtaining a near precision of 93%. Also, it was possible to calculate in an efficient way the centroids from the data gathering by circuit and agent police guard. The proposed method localizes in an automatic way the points with higher rates of offenses dividing the geographic circuits into pieces, promoting a more effective surveillance.
Once critical points were obtained, the tool API from Google Maps was applied; it helped to generate routes in different modes of transportation that the police agent may use. Performance of this tool altogether with the proposed model showed good results in the testing phase, which makes this clear evidence of being an innovate solution to surveillance corps worldwide. This model was tested with real data with optimal results, endorsing the efficiency of the proposed procedure.
As a future investigation, it is proposed to apply on this work prediction algorithms such as artificial neuronal networks, which allows identifying where an offense will take place in a specific area and at the same time preventing offenses execution. On the other hand, it was addressed the usage of the algorithm of Deep-learning in order to identify the characteristics of criminals, criminal groups procedures, etc.

 ,
, 


